


Total staff
155
Employees
131
Contractors
24
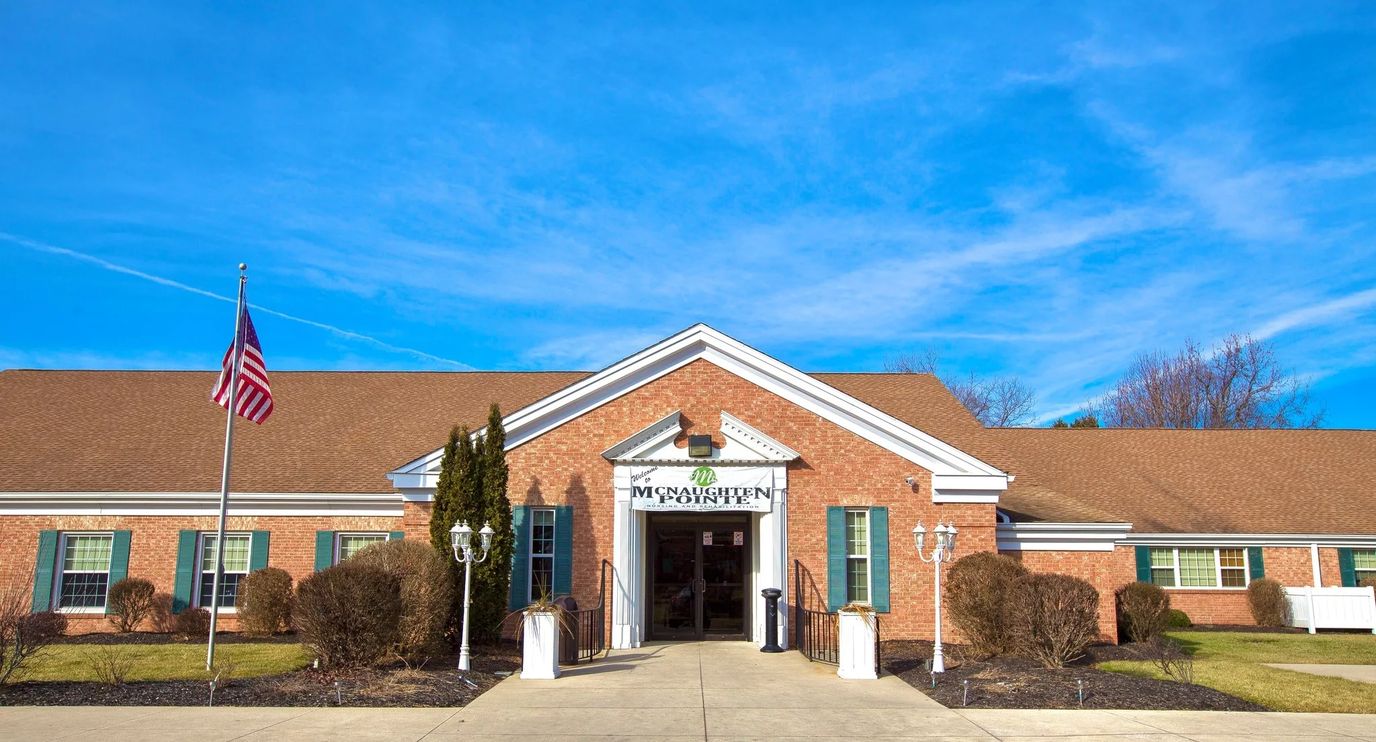
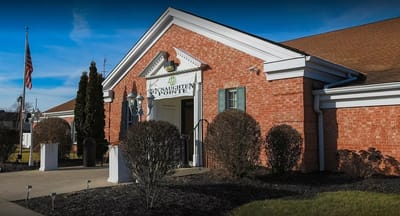
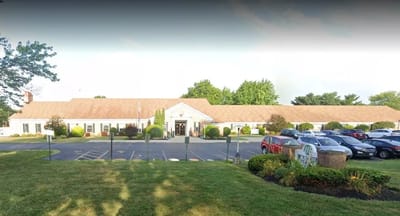
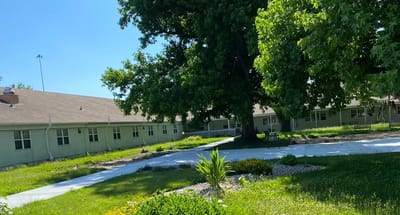

McNaughten Pointe Nursing and Rehabilitation Center boasts a warm and inviting atmosphere where residents can enjoy and experience a vibrant lifestyle. The skilled nursing community focuses on subacute rehabilitation and long-term care. They consist of professional care staff who are dedicated to enhancing the quality of living. McNaughten Pointe is a community that strives to enrich the holistic wellness of all its residents in their journey to recovery.
The nursing home offers a list of services such as memory care, respite care, hospice, ventilator management, long-term care, and rehabilitation that are delivered by a clinical team. The home has a registered nurse available 24/7, licensed therapists, and dieticians. Their 24/7 skilled care services focus on individualized treatments– physical, occupational, and speech therapy.
| Staff type | Hours / Day / Resident | vs state avg |
|---|---|---|
|
Registered Nurse (RN)
| 1h 4m per day | ▲ 69% State avg: 38m per day · National avg: 41m per day |
|
LPN / LVN
| 52m per day | ▼ 11% State avg: 58m per day · National avg: 52m per day |
|
Nurse Aide
| 2h 38m per day | ▲ 23% State avg: 2h 8m per day · National avg: 2h 21m per day |
|
Weekend Total Nursing
| 3h 58m per day | ▲ 21% State avg: 3h 17m per day · National avg: 3h 26m per day |
|
Physical Therapist
| 1m per day | ▼ 75% State avg: 3m per day · National avg: 4m per day |
|
Weekend RN
| 50m per day | ▲ 100% State avg: 25m per day · National avg: 29m per day |
Reporting period: October 1 – December 31, 2025 (Q4 2025). Source: CMS Payroll-Based Journal report.
Manages medical care and health needs.
Assists with medical care and medications.
Helps with daily care and mobility.
Total hours from contractors
1,276 contractor hours this quarter
| Certified Nursing Assistant | 68 | 0 | 68 | 26,381 | 92 | 100% | 11.3 |
| Registered Nurse | 22 | 2 | 24 | 8,778 | 92 | 100% | 12.4 |
| Licensed Practical Nurse | 18 | 0 | 18 | 6,441 | 92 | 100% | 12 |
| Qualified Activities Professional | 6 | 0 | 6 | 2,545 | 92 | 100% | 10.7 |
| RN Director of Nursing | 5 | 0 | 5 | 2,250 | 69 | 75% | 7.8 |
| Clinical Nurse Specialist | 3 | 0 | 3 | 1,452 | 64 | 70% | 8 |
| Other Dietary Services Staff | 2 | 0 | 2 | 588 | 67 | 73% | 8.5 |
| Administrator | 2 | 0 | 2 | 504 | 64 | 70% | 7.9 |
| Nurse Practitioner | 1 | 0 | 1 | 496 | 62 | 67% | 8 |
| Dietitian | 1 | 0 | 1 | 492 | 62 | 67% | 7.9 |
| Mental Health Service Worker | 1 | 0 | 1 | 488 | 61 | 66% | 8 |
| Occupational Therapy Aide | 2 | 0 | 2 | 424 | 51 | 55% | 7.8 |
| Physical Therapy Assistant | 0 | 5 | 5 | 197 | 46 | 50% | 3.9 |
| Qualified Social Worker | 0 | 3 | 3 | 195 | 60 | 65% | 3.3 |
| Physical Therapy Aide | 0 | 5 | 5 | 145 | 45 | 49% | 3 |
| Respiratory Therapy Technician | 0 | 4 | 4 | 125 | 40 | 43% | 3 |
| Occupational Therapy Assistant | 0 | 1 | 1 | 56 | 9 | 10% | 6.2 |
| Speech Language Pathologist | 0 | 3 | 3 | 26 | 5 | 5% | 5.1 |
| Medical Director | 0 | 1 | 1 | 24 | 12 | 13% | 2 |
Federal penalties imposed by CMS for regulatory violations, including civil money penalties (fines) and denials of payment for new Medicare/Medicaid admissions.
Source: CMS Penalties Database
No penalties in the past 3 years
No civil money penalties or payment denials were reported in the last 3 years.
These measures show how residents usually do over time at this home, based on health outcomes and preventive care.
Ohio average: 5.8
Ohio average: 12.7
Ohio average: 6.8%
Ohio average: 8.9%
Ohio average: 22.0%
Ohio average: 3.4%
Ohio average: 3.9%
Ohio average: 0.5%
Ohio average: 6.2%
Ohio average: 24.0%
Ohio average: 8.4%
Ohio average: 92.4%
Ohio average: 94.5%
Ohio average: 1.77
Ohio average: 1.83
Ohio average: 78.0%
Ohio average: 1.3%
Ohio average: 75.6%
Ohio average: 25.1%
Ohio average: 12.5%
Ohio average: 0.8%
Ohio average: 53.7%
Ohio average: 50.6%
Quality measures are calculated from Minimum Data Set (MDS) assessments. For most measures, lower percentages indicate better care quality.
12% of new residents, usually for short-term rehab.
81% of new residents, often for short stays.
7% of new residents, often for long-term daily care.
Source: CMS Long-Term Care Facility Characteristics (Data as of Jan 2026)
Residents meet regularly to discuss policies, care quality, and activities
Organized group of residents that meets regularly to discuss facility policies, quality of life, and activities.
Data sourced from CMS Long-Term Care Facility Characteristics quarterly report. Payer mix reflects the current resident census by primary payment source.
Historical financial and operational data for McNaughten Pointe Nursing and Rehabilitation Center from 2011–2023, based on CMS SNF Cost Reports.
Key figures below are for fiscal year ending in 12/2023.
Based on CMS SNF Cost Report for fiscal year ending in 12/2023.
Residents typically stay for brief periods, with frequent admissions and discharges throughout the year.
Most new residents arrive under private pay (81% of admissions), and a typical private pay stay runs around 4 - 5 months.
Coverage residents most often arrive under.
Coverage residents most often leave under.
![]() 8.5 miles from city center
8.5 miles from city center
![]() Estimated distance in miles from Columbus's city center to McNaughten Pointe Nursing and Rehabilitation Center's address, calculated via Google Maps.
— 0.57 miles to nearest hospital (Visual Care Associates)
Estimated distance in miles from Columbus's city center to McNaughten Pointe Nursing and Rehabilitation Center's address, calculated via Google Maps.
— 0.57 miles to nearest hospital (Visual Care Associates)
Add your location
Info below is compiled from CMS reports & the OH Dept. of Health, senior community websites & trusted data sources such as Walk Score & BBB.
Communities are listed from highest to lowest based on our ranking methodology.
| Westerwood | NH AL IL MC RC SNF | Columbus (Northland) | 75
Facility
75
OH AVG
75
Rank
#151 / 309 |
83.1%
Facility
83.1%
OH AVG
81.7
Rank
#84 / 138 | +2% | 4.39
Facility
4.39
OH AVG
3.54
Rank
#21 / 182 | +26% | +24% | $0
Facility
$0
OH AVG
$74.0k
Rank
#1 / 183 | 16
Facility
16
OH AVG
30.9
Rank
#43 / 183 | 2.3
Facility
2.3
OH AVG
4.6
Rank
#16 / 183 | - | 62 | - |
26
Facility
26
OH AVG
40
Rank
#488 / 704 | United Church Homes Management, Inc | $8.5MFiscal year ending 06/2024
Facility
$8.5MFiscal year ending 06/2024
OH AVG
$10.1M
Rank
#49 / 183 | $5.7MFiscal year ending 06/2024
Facility
$5.7MFiscal year ending 06/2024
OH AVG
$3.9M
Rank
#52 / 183 | 66.8%Fiscal year ending 06/2024
Facility
66.8%Fiscal year ending 06/2024
OH AVG
40.2%
Rank
#116 / 183 | 365399 | ||||
| Worthington Christian Village | NH AL IL SNF | Columbus (Olentangy High Bluffs) | 40
Facility
40
OH AVG
75
Rank
#250 / 309 |
80.0%
Facility
80.0%
OH AVG
81.7
Rank
#94 / 138 | -2% | 5.68
Facility
5.68
OH AVG
3.54
Rank
#5 / 182 | +29% | +60% | $0
Facility
$0
OH AVG
$74.0k
Rank
#1 / 183 | 11
Facility
11
OH AVG
30.9
Rank
#26 / 183 | 5.5
Facility
5.5
OH AVG
4.6
Rank
#143 / 183 | - | 32 | A+ |
30
Facility
30
OH AVG
40
Rank
#445 / 704 | Lynn Borton | $3.8MFiscal year ending 12/2023
Facility
$3.8MFiscal year ending 12/2023
OH AVG
$10.1M
Rank
#174 / 183 | $2.7MFiscal year ending 12/2023
Facility
$2.7MFiscal year ending 12/2023
OH AVG
$3.9M
Rank
#153 / 183 | 70.5%Fiscal year ending 12/2023
Facility
70.5%Fiscal year ending 12/2023
OH AVG
40.2%
Rank
#7 / 183 | 365671 | ||||
| Ohio Living Westminster – Thurber | NH AL IL MC SNF | Columbus (Harrison West) | 73
Facility
73
OH AVG
75
Rank
#155 / 309 |
39.7%
Facility
39.7%
OH AVG
81.7
Rank
#134 / 138 | -51% | 5.17
Facility
5.17
OH AVG
3.54
Rank
#9 / 182 | +14% | +46% | $14.7k
Facility
$14.7k
OH AVG
$74.0k
Rank
#142 / 183 | 22
Facility
22
OH AVG
30.9
Rank
#69 / 183 | 3.7
Facility
3.7
OH AVG
4.6
Rank
#71 / 183 | 2 | 29 | A+ |
71
Facility
71
OH AVG
40
Rank
#62 / 704 | Sydney Mcbride | $4.5MFiscal year ending 06/2024
Facility
$4.5MFiscal year ending 06/2024
OH AVG
$10.1M
Rank
#160 / 183 | $2.9MFiscal year ending 06/2024
Facility
$2.9MFiscal year ending 06/2024
OH AVG
$3.9M
Rank
#164 / 183 | 65.1%Fiscal year ending 06/2024
Facility
65.1%Fiscal year ending 06/2024
OH AVG
40.2%
Rank
#87 / 183 | 365416 | ||||
| Wesley Glen Retirement Community | NH AL HOS IL MC SNF | Columbus (Sharon Heights) | 29
Facility
29
OH AVG
75
Rank
#280 / 309 | - | - | 5.54
Facility
5.54
OH AVG
3.54
Rank
#6 / 182 | -26% | +57% | $0
Facility
$0
OH AVG
$74.0k
Rank
#1 / 183 | 30
Facility
30
OH AVG
30.9
Rank
#98 / 183 | 6.0
Facility
6.0
OH AVG
4.6
Rank
#156 / 183 | 1 | 51 | - |
81
Facility
81
OH AVG
40
Rank
#22 / 704 | Celia Conlon | $6.5MFiscal year ending 12/2023
Facility
$6.5MFiscal year ending 12/2023
OH AVG
$10.1M
Rank
#113 / 183 | $5.1MFiscal year ending 12/2023
Facility
$5.1MFiscal year ending 12/2023
OH AVG
$3.9M
Rank
#98 / 183 | 78.2%Fiscal year ending 12/2023
Facility
78.2%Fiscal year ending 12/2023
OH AVG
40.2%
Rank
#52 / 183 | 365504 | ||||
| McNaughten Pointe Nursing and Rehabilitation Center | NH PC SNF | Columbus (Far East) | 124
Facility
124
OH AVG
75
Rank
#36 / 309 |
88.1%
Facility
88.1%
OH AVG
81.7
Rank
#59 / 138 | +8% | 3.01
Facility
3.01
OH AVG
3.54
Rank
#153 / 182 | +68% | -15% | $0
Facility
$0
OH AVG
$74.0k
Rank
#1 / 183 | 38
Facility
38
OH AVG
30.9
Rank
#133 / 183 | 5.4
Facility
5.4
OH AVG
4.6
Rank
#142 / 183 | 2 | 109 | - |
46
Facility
46
OH AVG
40
Rank
#297 / 704 | Michael Fatica | $18.5MFiscal year ending 12/2023
Facility
$18.5MFiscal year ending 12/2023
OH AVG
$10.1M
Rank
#18 / 183 | $9.0MFiscal year ending 12/2023
Facility
$9.0MFiscal year ending 12/2023
OH AVG
$3.9M
Rank
#20 / 183 | 48.7%Fiscal year ending 12/2023
Facility
48.7%Fiscal year ending 12/2023
OH AVG
40.2%
Rank
#95 / 183 | 365195 |
McNaughten Pointe Nursing and Rehabilitation Center is located in Columbus, Ohio.
Here are the financial assistance programs available to residents in Ohio.
McNaughten Pointe Nursing and Rehabilitation Center is in the Far East neighborhood.
McNaughten Pointe Nursing and Rehabilitation Center has a walk score of 46. Somewhat walkable. A few nearby services may be reachable on foot, but most trips require transportation.
McNaughten Pointe Nursing and Rehabilitation Center's occupancy is 84.1%.
No, McNaughten Pointe Nursing and Rehabilitation Center has a no-pet policy.
McNaughten Pointe Nursing and Rehabilitation Center is registered as a for-profit.
Yes — there are 5 photos of McNaughten Pointe Nursing and Rehabilitation Center in the photo gallery on this page.
McNaughten Pointe Nursing and Rehabilitation Center is located at 1425 Yorkland Rd, Columbus, OH 43232.
Care Cost Calculator: See Prices in Your Area
Nursing Home Data Explorer
Don’t Wait Too Long: 7 Red Flag Signs Your Parent Needs Assisted Living Now
The True Cost of Assisted Living in 2025 – And How Families Are Paying For It
Understanding Senior Living Costs: Pricing Models, Discounts & Financial Assistance


