


Medilodge of Capital Area
Nursing Home, Hospice Care, Memory Care, Palliative Care, Respite Care & Skilled Nursing · Lansing, MI
CMS overall rating Info CMS (the Centers for Medicare & Medicaid Services) is the federal agency that rates nursing home quality. Its Overall Rating runs from 1 to 5 stars, combining health inspections, staffing, and quality measures, with inspections weighted most heavily.

Medilodge of Capital Area

Nursing Home, Hospice Care, Memory Care, Palliative Care, Respite Care & Skilled Nursing · Lansing, MI
CMS overall rating Info CMS (the Centers for Medicare & Medicaid Services) is the federal agency that rates nursing home quality. Its Overall Rating runs from 1 to 5 stars, combining health inspections, staffing, and quality measures, with inspections weighted most heavily.
Calculator: See prices in your area
Medilodge of Capital Area accepts Medicare, Medicaid, and private pay.

Overview of Medilodge of Capital Area

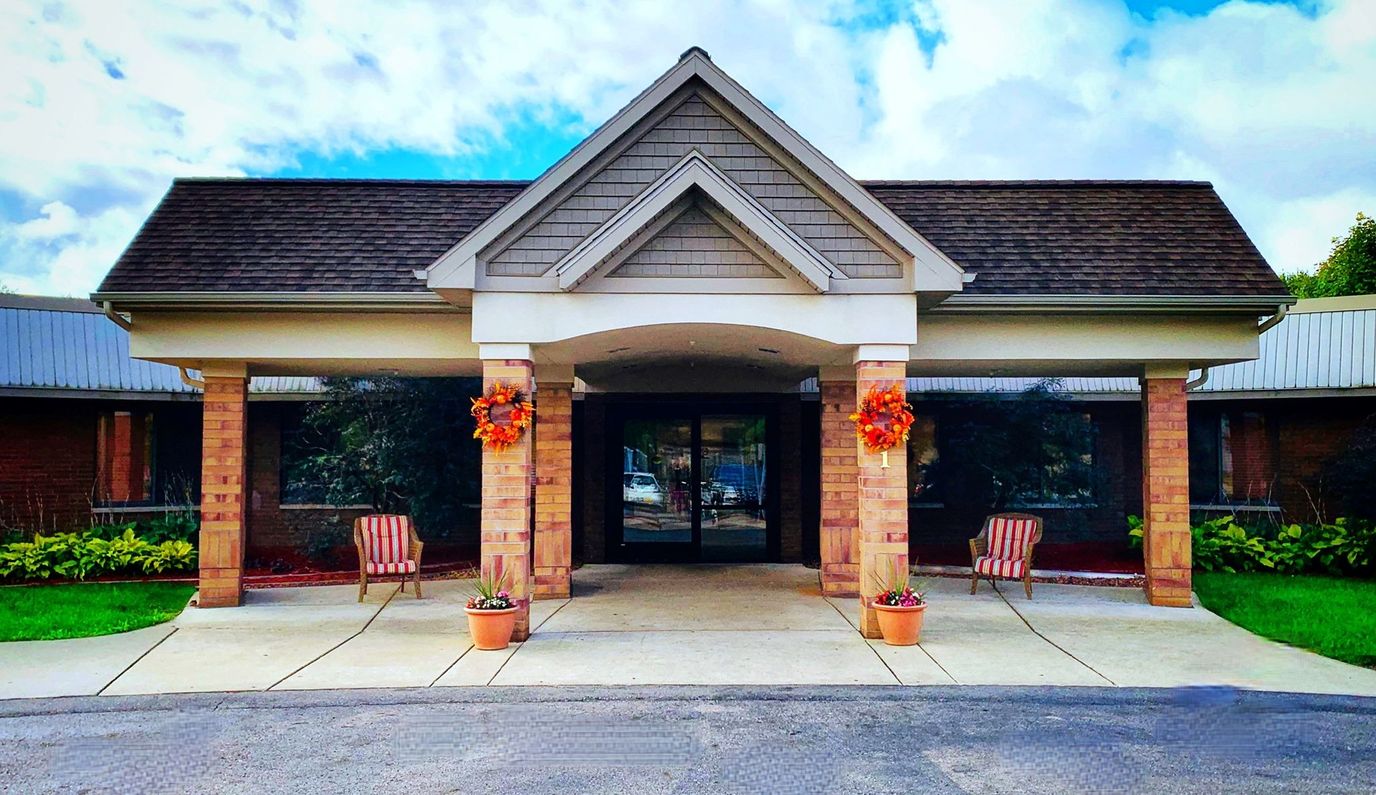
Medilodge of Capital Area embraces seniors with open arms in Lansing, Michigan. From intensive rehabilitation to long-term skilled nursing care, this cherished home provides a comprehensive range of healthcare services tailored to individual needs. With an emphasis on fall management programs, IV medication therapy, and wound care, residents find comfort in a community dedicated to their well-being. Beyond these essential offerings, Medilodge of Capital Area goes the extra mile, extending its embrace to respite care, outpatient therapy, hospice support, and a secure and nurturing memory care unit.
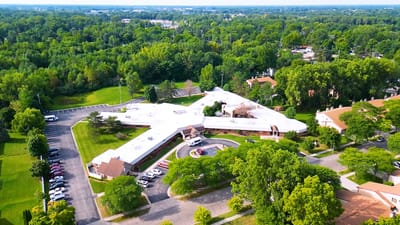
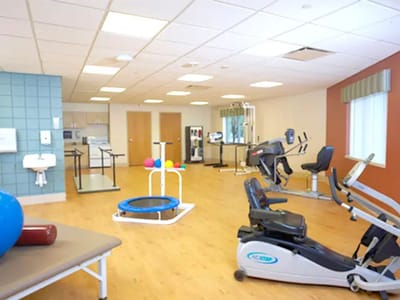
State-of-the-art therapy equipment stands ready to support residents’ rehabilitation journeys, while the soothing ambiance of on-site salon and spa services brings comfort and relaxation. Amidst manicured gardens and inviting outdoor courtyards, residents can find solace and connection. As they enjoy the convenience of on-site dental services and enriching religious offerings, Medilodge of Capital Area stands as a testament to its commitment to seniors’ quality of life. With open arms and compassionate care, this home addresses not only healthcare needs but also the heartfelt nursing home questions and concerns that often accompany the journey of senior living.

Quality ratings

Measured by Centers for Medicare & Medicaid Services (CMS)

Overall rating Info The Overall CMS Rating combines results from health inspections, staffing levels and quality measures. Health inspections carry the most weight. Staffing and quality scores can increase or decrease the final rating based on performance compared to state and national standards.
▼ 4.4% Below MI avg. ▼ 4.4% Below MI avg.MI average: 3.1Click the badge to see the full State ranking.Click here to see the full State ranking.
Health Inspection Info Based on the results of the facility's three most recent standard inspections and any complaint investigations. CMS reviews the number, scope, and severity of deficiencies, with more recent findings weighted more heavily.
▼ 29.3% Below MI avg. ▼ 29.3% Below MI avg.MI average: 2.8Click the badge to see the full State ranking.Click here to see the full State ranking.
Staffing Info Measures average nursing staff hours per resident per day, including Registered Nurses (RNs) and total nursing staff. Ratings are adjusted based on the level of care residents require and are compared to state and national benchmarks.
▲ 43.0% Above MI avg. ▲ 43.0% Above MI avg.MI average: 3.5Click the badge to see the full State ranking.Click here to see the full State ranking.
Quality Measures Info Based on clinical and physical health indicators reported to CMS, such as hospital readmissions, falls, pressure ulcers, and improvements in mobility. These measures reflect how well residents' health needs are being managed.
▲ 6.4% Above MI avg. ▲ 6.4% Above MI avg.MI average: 3.8Click the badge to see the full State ranking.Click here to see the full State ranking.

Staffing hours breakdown

Info Daily nursing hours per resident by staff type, reported to CMS. Higher is generally better — compare this facility to state and national averages to see where staffing stands.

Hours per resident per day — compared to Michigan state averages

Total nursing care / resident Info This home is ranked 40th out of 140 homes in Michigan for nurse hours. Total adjusted nursing hours per resident per day, combining RN, LPN, and aide time. CMS adjusts this for case-mix so facilities can be fairly compared.
4h 26m per day
Rank #40 / 140Nurse hours — State benchmarkedThis home is ranked 40th out of 140 homes in Michigan for nurse hours. Shows adjusted nurse hours per resident per day benchmarked to the Michigan average, with a ranking across 140 Michigan facilities. More hours mean more direct care. The national average is about 3.5 hrs; below 3.0 is a red flag.Facilities with the same value for a metric share the same rank. Rankings are based only on facilities in Michigan that report data for that category. Facilities without available data are excluded from the ranking.Click the rank badge to see the full State ranking.Click here to see the full State ranking.
This facility Michigan avg (4h 18m per day)
vs Michigan avg
+3%

4 of 6 metrics below state avg

Standout metric Registered Nurse (RN) is +28% above state avg
Staff typeHours / Day / Residentvs state avg
Registered Nurse (RN) Info RNs hold the highest nursing license and can assess residents, interpret test results, and direct care plans. More RN hours per day often signals stronger clinical oversight and faster response to health changes. 59m per day ▲ 28% State avg: 46m per day · National avg: 41m per day
LPN / LVN Info Licensed Practical Nurses (LPNs) or Licensed Vocational Nurses (LVNs) deliver routine hands-on care — medication administration, wound dressing, and monitoring vital signs. They work under RN supervision and make up a large share of daily bedside care. 39m per day ▼ 27% State avg: 53m per day · National avg: 52m per day
Nurse Aide Info Certified Nurse Aides (CNAs) provide the most direct day-to-day assistance: bathing, dressing, feeding, and mobility. Nurse aide hours are typically the largest staffing category and directly affect residents' quality of life. 2h 13m per day ▼ 5% State avg: 2h 20m per day · National avg: 2h 20m per day
Weekend Total Nursing Info Combined nursing hours (RN + LPN + Nurse Aide) per resident per day on weekends. Staffing often drops on weekends — this figure reveals whether the facility maintains adequate coverage outside of weekday hours. 3h 13m per day ▼ 9% State avg: 3h 31m per day · National avg: 3h 27m per day
Physical Therapist Info Hours per resident per day provided by licensed Physical Therapists (PTs) or PT Assistants. PT services help residents recover mobility after injury or illness and are especially important for post-acute (short-stay) rehabilitation. 3m per day ▼ 27% State avg: 4m per day · National avg: 4m per day
Weekend RN Info Registered nurse hours specifically on weekends. Facilities sometimes reduce RN presence on Saturdays and Sundays — a low weekend RN figure compared to weekday hours can indicate reduced clinical oversight when most administrative staff are absent. 37m per day ▲ 26% State avg: 29m per day · National avg: 29m per day

Capacity and availability

Medium-capacity home

Offers a balance of services and community atmosphere.

Total beds 120
Avg. Length of Stay Info Average number of days residents stay at this facility, based on CMS cost report data. Shorter stays often reflect post-acute or rehab care; longer stays reflect long-term care.
83 days
Walk Score
Walk Score: 15 / 100 Rank #564 / 703Walk Score — State benchmarkedThis home is ranked 564th out of 703 homes in Michigan for walk score. Shows how walkable this facility's neighborhood is compared to the average walk score across Michigan facilities. Higher scores benefit residents, families, and staff.Facilities with the same value for a metric share the same rank. Rankings are based only on facilities in Michigan that report data for that category. Facilities without available data are excluded from the ranking.Click the rank badge to see the full State ranking.Click here to see the full State ranking.
Car-dependent. Most errands require a car, with limited nearby walkable options.

Therapy & Rehabilitation

3 services
Rehabilitation Services
Respite Care
Short-Term Rehab

Staffing & Medical

1 service
24-Hour Staffing

Additional Services

1 service
Short-Term Rehabilitation

Amenities & Lifestyle

Rehabilitation / Therapy Center
On-Site Medical Director
On-Site Podiatrist
On-Site Dentist
On-Site Salon / Spa Services
On-Site Religious Services
State-Of-The-Art Therapy Equipment
Pet Therapy
Wifi Accessibility
Fine Dining With Gourmet Menus
Warmly Decorated Private And Semi-Private Rooms
In-Room Free Cable Service
Private Phones
In-Room Phones (Arranged By Family)
Manicured Gardens
Outdoor Courtyard
Comfortable Family / Resident Lounge
Specific Programs24-hour Skilled Nursing Care, Short & Long Term Care, Physical Therapy, Respiratory Therapy, Outpatient Therapy, Occupational Therapy, Wound Care Therapies, Restorative Care, Tracheostomy Care, Hospice Support Services, IV Medication Therapy, Community Reintegration Program, Fall Management Program, Recreational Therapy, Secure Memory Care
Religious Services

Contact Medilodge of Capital Area

Penalties and fines

Federal penalties imposed by CMS for regulatory violations, including civil money penalties (fines) and denials of payment for new Medicare/Medicaid admissions.

Source: CMS Penalties Database

No penalties in the past 3 years

No civil money penalties or payment denials were reported in the last 3 years.

Breakdown by payment type

Medicare

11% of new residents, usually for short-term rehab.

Typical stay 29 days

Private pay

62% of new residents, often for short stays.

Typical stay 1 months

Medicaid

27% of new residents, often for long-term daily care.

Typical stay 7 - 8 months

Finances and operations

Based on CMS SNF Cost Report for fiscal year ending in 12/2023.

For-profit
Corporation
Net patient revenue Info Net patient revenue — what the home actually collects for resident care, after contractual allowances, bad debt and discounts are subtracted from its gross charges (CMS cost report, Worksheet G-3). It covers resident care only; money the home earns from other sources is shown separately as "Other income."
$10.7M
Net patient income Info Net patient income: net patient revenue minus the home's total operating expenses. A positive figure means it earns more from resident care than it spends to deliver it; a negative figure means the opposite. It excludes non-operating "other income."
-$596.6K
For-profit Corporation
Net patient revenue Info Net patient revenue — what the home actually collects for resident care, after contractual allowances, bad debt and discounts are subtracted from its gross charges (CMS cost report, Worksheet G-3). It covers resident care only; money the home earns from other sources is shown separately as "Other income."
$10.7M Rank #77 / 141Revenue — State benchmarkedThis home is ranked 77th out of 141 homes in Michigan for revenue. Shows this facility's annual revenue compared to the Michigan average. Higher revenue generally means more resources for staffing and capital — read alongside Payroll %.Facilities with the same value for a metric share the same rank. Rankings are based only on facilities in Michigan that report data for that category. Facilities without available data are excluded from the ranking.Click the rank badge to see the full State ranking.Click here to see the full State ranking.
Net patient income Info Net patient income: net patient revenue minus the home's total operating expenses. A positive figure means it earns more from resident care than it spends to deliver it; a negative figure means the opposite. It excludes non-operating "other income."
-$596.6K
Other income Info Money the home earns outside of resident care — such as investments, grants, rentals and other non-operating sources (CMS cost report, Worksheet G-3). It is tracked separately from net patient revenue: it is not part of that figure, and it is not included in net patient income.
$441.1K
Payroll costs Info Staff salaries plus wage-related costs — benefits such as payroll taxes, health insurance and retirement — from the home's own accounting records (CMS cost report, Worksheet A). Contract or agency labor is counted separately, under other operating costs. Rank #96 / 141Payroll — State benchmarkedThis home is ranked 96th out of 141 homes in Michigan for payroll. Shows total annual staff payroll benchmarked to the Michigan average. Higher payroll investment relative to peers often signals better staffing and less reliance on cheaper contract labor.Facilities with the same value for a metric share the same rank. Rankings are based only on facilities in Michigan that report data for that category. Facilities without available data are excluded from the ranking.Click the rank badge to see the full State ranking.Click here to see the full State ranking.
$5.8M 54.4% of net patient revenue Info Payroll as a share of revenue: staff salaries and wage-related benefits divided by net patient revenue. A higher figure means more of each revenue dollar goes to staff pay. Rank #89 / 141Payroll % — State benchmarkedThis home is ranked 89th out of 141 homes in Michigan for payroll %. Shows payroll as a percentage of revenue versus the Michigan average. Well-run Michigan facilities typically land around 48–58% — the top third Statewide. Below 25% may signal understaffing or heavy agency use — read with Staffing ratings.Facilities with the same value for a metric share the same rank. Rankings are based only on facilities in Michigan that report data for that category. Facilities without available data are excluded from the ranking.Click the rank badge to see the full State ranking.Click here to see the full State ranking.
Other operating costs Info Everything it costs to run the home apart from payroll — food, utilities, supplies, maintenance, contract labor and administration. Calculated as total operating expense minus payroll (staff salaries and wage-related benefits).
$5.5M
Total costs Info The home's total operating expense for the year — all the costs of running it, salaries included (CMS cost report, Worksheet G-3).
$11.3M

Who this home usually serves

TYPE OF STAY

Primarily long-term care, limited rehab

Most residents stay long-term, while a smaller portion are admitted for short-term rehab.

Most new residents arrive under private pay (62% of admissions), and a typical private pay stay runs around 1 months.

Admissions
387 total

Coverage residents most often arrive under.

Medicare 11%
Private pay 62%
Medicaid 27%
Discharges
388 total

Coverage residents most often leave under.

Medicare 7%
Private pay 64%
Medicaid 30%

Compare Nursing Homes around Lansing

The information below is reported by the Michigan Department of Licensing and Regulatory Affairs (LARA).

CMS & MI Dept. of Health data

The Willows at East Lansing
NH
ADC
AL
MC
SNF
Lansing
65
Facility 65
MI AVG 74
Rank #225 / 430
95.1%
Facility 95.1%
MI AVG 74
Rank #15 / 119
+28%
3.41
Facility 3.41
MI AVG 4.30
Rank #129 / 140
+44%-21%
$0
Facility $0
MI AVG $87.6k
Rank #1 / 143
36
Facility 36
MI AVG 33.5
Rank #84 / 142
7.2
Facility 7.2
MI AVG 5.2
Rank #109 / 142
-62-
19
Facility 19
MI AVG 39
Rank #536 / 703
-
$13.3MFiscal year ending 12/2023
Facility $13.3MFiscal year ending 12/2023
MI AVG $15.8M
Rank #80 / 141
$7.0MFiscal year ending 12/2023
Facility $7.0MFiscal year ending 12/2023
MI AVG $5.6M
Rank #58 / 141
53.2%Fiscal year ending 12/2023
Facility 53.2%Fiscal year ending 12/2023
MI AVG 39%
Rank #30 / 141
235700
Holt Senior Care & Rehab Center
NH
SNF
Lansing
141
Facility 141
MI AVG 74
Rank #38 / 430
81.4%
Facility 81.4%
MI AVG 74
Rank #60 / 119
+10%
4.09
Facility 4.09
MI AVG 4.30
Rank #60 / 140
+37%-5%
$53.4k
Facility $53.4k
MI AVG $87.6k
Rank #112 / 143
22
Facility 22
MI AVG 33.5
Rank #50 / 142
4.4
Facility 4.4
MI AVG 5.2
Rank #54 / 142
4115-
25
Facility 25
MI AVG 39
Rank #480 / 703
John Merlo
$13.0MFiscal year ending 12/2023
Facility $13.0MFiscal year ending 12/2023
MI AVG $15.8M
Rank #59 / 141
$7.5MFiscal year ending 12/2023
Facility $7.5MFiscal year ending 12/2023
MI AVG $5.6M
Rank #53 / 141
57.9%Fiscal year ending 12/2023
Facility 57.9%Fiscal year ending 12/2023
MI AVG 39%
Rank #67 / 141
235123
The Dimondale Nursing Care Center
NH
MC
SNF
Lansing
150
Facility 150
MI AVG 74
Rank #29 / 430
94.5%
Facility 94.5%
MI AVG 74
Rank #19 / 119
+28%
4.35
Facility 4.35
MI AVG 4.30
Rank #40 / 140
-2%+1%
$35.3k
Facility $35.3k
MI AVG $87.6k
Rank #105 / 143
38
Facility 38
MI AVG 33.5
Rank #91 / 142
4.8
Facility 4.8
MI AVG 5.2
Rank #65 / 142
4142-
0
Facility 0
MI AVG 39
Rank #688 / 703
Hollie Stambersky
$17.0MFiscal year ending 12/2023
Facility $17.0MFiscal year ending 12/2023
MI AVG $15.8M
Rank #35 / 141
$9.6MFiscal year ending 12/2023
Facility $9.6MFiscal year ending 12/2023
MI AVG $5.6M
Rank #36 / 141
56.5%Fiscal year ending 12/2023
Facility 56.5%Fiscal year ending 12/2023
MI AVG 39%
Rank #73 / 141
235256
Burcham Hills
NH
AL
IL
MC
RC
SNF
East Lansing (Burcham Drive)
266
Facility 266
MI AVG 74
Rank #2 / 430
--
4.82
Facility 4.82
MI AVG 4.30
Rank #29 / 140
-48%+12%
$37.6k
Facility $37.6k
MI AVG $87.6k
Rank #106 / 143
49
Facility 49
MI AVG 33.5
Rank #109 / 142
4.9
Facility 4.9
MI AVG 5.2
Rank #67 / 142
6112-
11
Facility 11
MI AVG 39
Rank #601 / 703
Angela Brummette
$29.0MFiscal year ending 06/2024
Facility $29.0MFiscal year ending 06/2024
MI AVG $15.8M
Rank #11 / 141
$14.1MFiscal year ending 06/2024
Facility $14.1MFiscal year ending 06/2024
MI AVG $5.6M
Rank #8 / 141
48.7%Fiscal year ending 06/2024
Facility 48.7%Fiscal year ending 06/2024
MI AVG 39%
Rank #36 / 141
235236

Financial Assistance for
Nursing Home in Michigan

Medilodge of Capital Area is located in Lansing, Michigan.
Here are the financial assistance programs available to residents in Michigan.

Get Financial aid guidance

MI Choice Waiver

Michigan Medicaid MI Choice Waiver

Age 65+ or disabled
General Michigan resident, Medicaid- eligible, nursing home-level care need.
Income Limits (2025) ~$2,829/month 300% FBR, individual
Asset Limits $2,000 (individual), $3,000 (couple).
MI

Delivered through regional waiver agents; waitlists possible.

Benefits
Personal care (5-7 hours/day) Respite care (240 hours/year) Home modifications ($1,500 avg.) Adult day care ($65/day)

Home Help Program

Michigan Home Help

Age 65+ or disabled
General Michigan resident, Medicaid- eligible or low-income.
Income Limits ~$1,732/month individual, Medicaid threshold
Asset Limits $2,000 individual
MI

Can hire family caregivers; less intensive than waiver.

Benefits
Personal care (up to 60 hours/month) Homemaker services Respite (varies)

Program of All-Inclusive Care for the Elderly (PACE)

Michigan PACE

Age 55+
General Michigan resident, nursing home-level care need, safe with PACE support.
Income Limits (2025) ~$2,829/month (Medicaid-eligible); private pay option available.
Asset Limits $2,000 (individual), $3,000 (couple).
MI

16 PACE centers (e.g., Ingham, Wayne counties); expanding slowly.

Benefits
Personal care (5-7 hours/day) Medical care Meals Transportation Therapy Respite

Medicare Savings Program (MSP)

Michigan Medicare Savings Program

Age 65+ or disabled
General Michigan resident, Medicare Part A/B.
Income Limits (2025) ~$2,510/month (QMB), ~$3,380/month (SLMB), ~$3,598/month (QI)—individual.
Asset Limits $9,430 (individual), $14,130 (couple).
MI

Three tiers; no waitlist; includes Extra Help for Part D.

Benefits
Covers Part B premiums ($174.70/month) Deductibles ($240/year) Copays (~20%)

National Family Caregiver Support Program (NFCSP) Respite

Michigan NFCSP Respite Care

Age
General Caregivers of 60+ needing care or 55+ caregivers of others; Michigan resident; functional needs (2+ ADLs).
Income Limits (2025) Prioritizes ~$24,980/year (individual); no strict cap.
Asset Limits Not assessed; need-based.
MI

16 AAAs; prioritizes low-income, rural caregivers.

Benefits
Respite (4-6 hours/week or 5 days/year) Adult day care ($60/day) Caregiver training

VA Aid and Attendance (A&A) and Housebound Benefits

Michigan VA Aid and Attendance/Housebound

Age 65+ or disabled veteran/spouse
General Michigan resident, wartime service, need for ADL help (A&A) or homebound.
Income Limits (2025) Net income < ~$1,984/month (veteran with dependent, A&A); pension offsets income.
Asset Limits ~$155,356 net worth limit
MI

High veteran demand in urban/rural areas.

Benefits
Cash (~$1,433-$2,642/month veteran, ~$951-$1,318 spouse) for care costs

Frequently Asked Questions about Medilodge of Capital Area

Is Medilodge of Capital Area in a walkable area?

Medilodge of Capital Area has a walk score of 15. Car-dependent. Most errands require a car, with limited nearby walkable options.

What is the occupancy rate at Medilodge of Capital Area?

Medilodge of Capital Area's occupancy is 73.5%.

Are pets allowed at Medilodge of Capital Area?

No, Medilodge of Capital Area has a no-pet policy.

Does Medilodge of Capital Area operate as a for-profit or non-profit?

Medilodge of Capital Area is registered as a for-profit.

Are there photos of Medilodge of Capital Area?

Yes — there are 17 photos of Medilodge of Capital Area in the photo gallery on this page.

What is the phone number of Medilodge of Capital Area?

(517) 272-4029 will put you in contact with the team at Medilodge of Capital Area.

Is Medilodge of Capital Area Medicare or Medicaid certified?

Medilodge of Capital Area is not currently listed as a CMS-certified provider of Medicare or Medicaid.

Guides for Better Senior Living

Care Cost Calculator: See Prices in Your Area

Nursing Home Data Explorer

Don’t Wait Too Long: 7 Red Flag Signs Your Parent Needs Assisted Living Now

The True Cost of Assisted Living in 2025 – And How Families Are Paying For It

Understanding Senior Living Costs: Pricing Models, Discounts & Financial Assistance


