


Total staff
111
Employees
92
Contractors
19
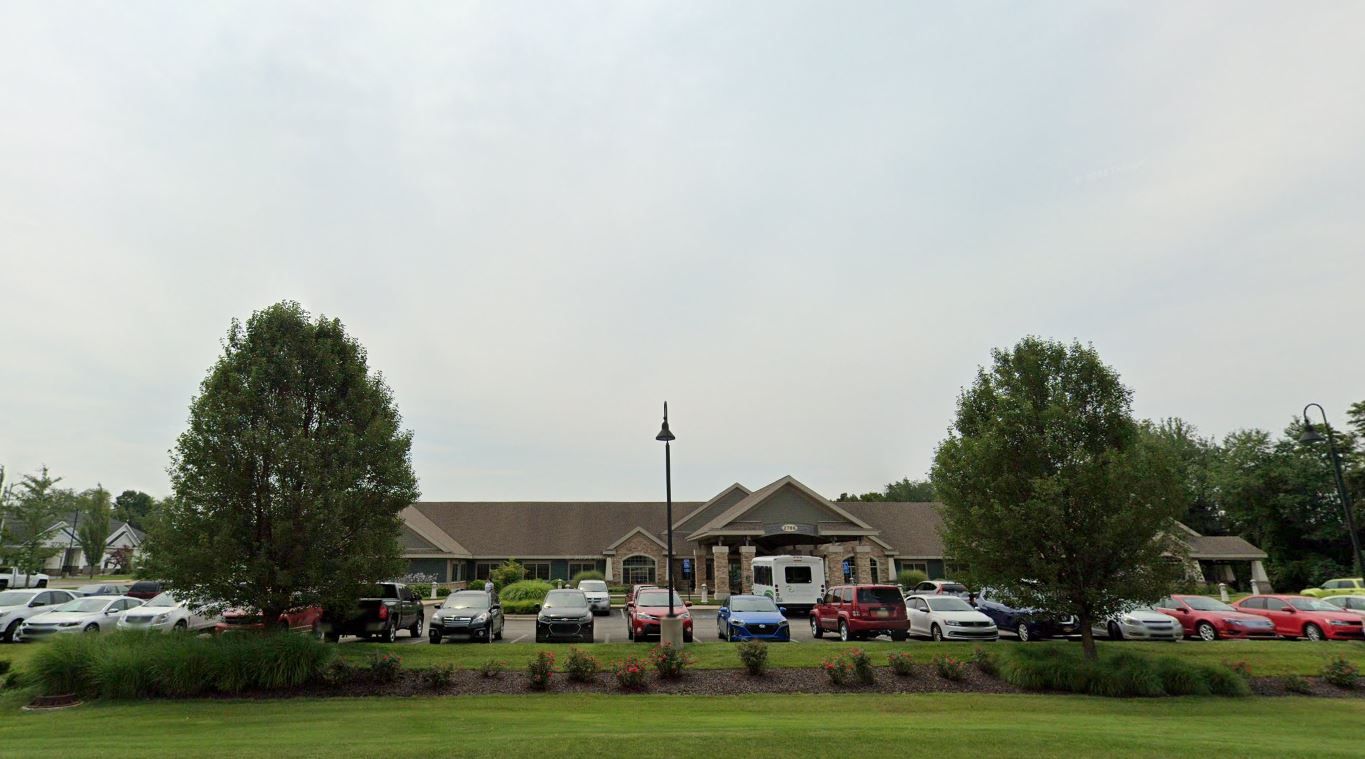
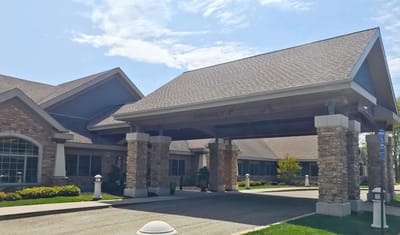
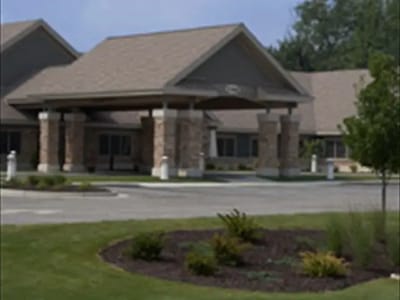
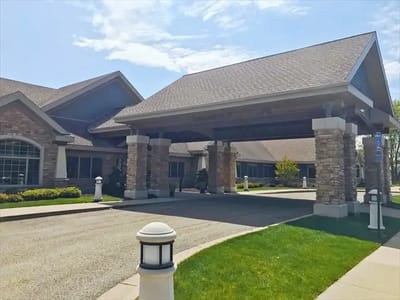

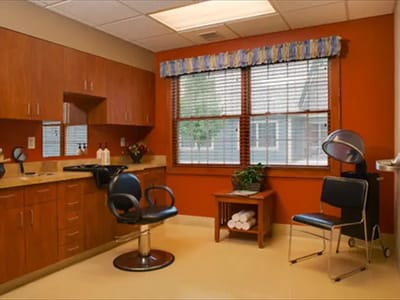
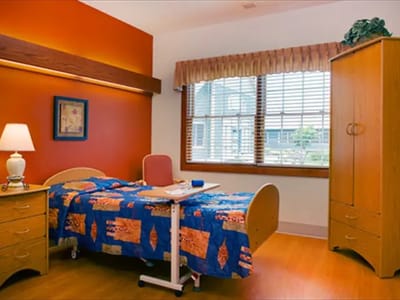
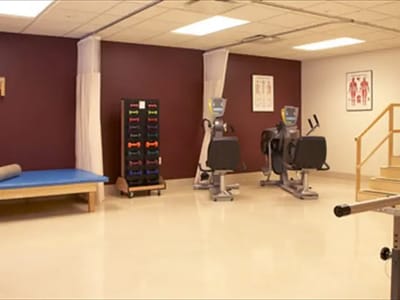
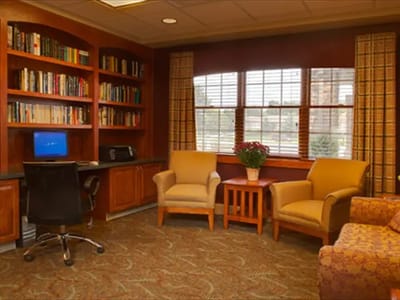
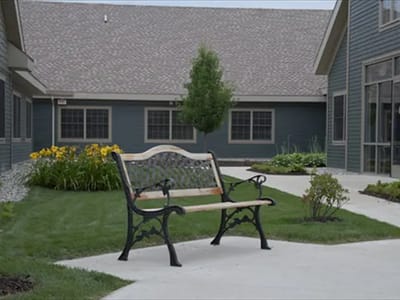
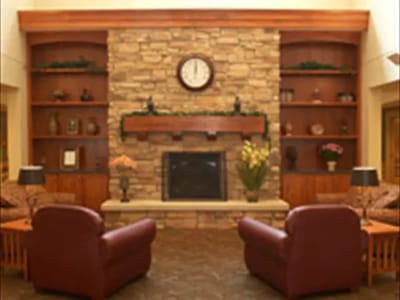
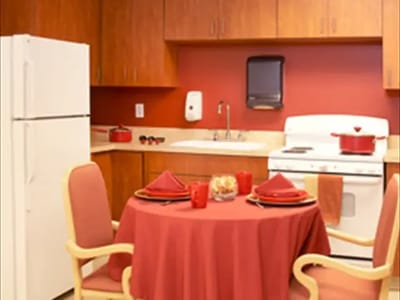

Medilodge of Wyoming in Grand Rapids offers long-term skilled nursing care and short-term rehabilitation services, as well as adaptive healthcare options for maximum independence and comfort. For those requiring specialized care, the facility also provides IV and infusion therapy, respite care, and wound care treatments.
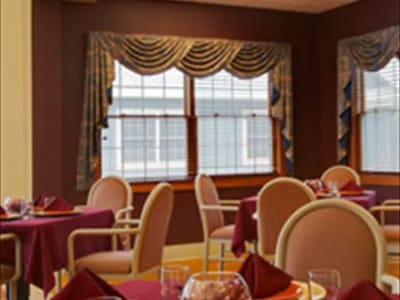
Transportation is made easy with Medilodge of Wyoming’s VA-contracted facility, and residents can enjoy plenty of outings to stay active and engaged. The dining options at Medilodge of Wyoming are exceptional as well. Experienced chefs prepare savory and exquisite flavors that are sure to delight residents everyday, punctuated by the airy atmosphere of the facility that is perfect for healing and rejuvenation.
| Staff type | Hours / Day / Resident | vs state avg |
|---|---|---|
|
Registered Nurse (RN)
| 1h 0m per day | ▲ 31% State avg: 46m per day · National avg: 41m per day |
|
LPN / LVN
| 37m per day | ▼ 30% State avg: 53m per day · National avg: 52m per day |
|
Nurse Aide
| 2h 25m per day | ■ Avg State avg: 2h 23m per day · National avg: 2h 21m per day |
|
Weekend Total Nursing
| 3h 23m per day | ▼ 4% State avg: 3h 31m per day · National avg: 3h 26m per day |
|
Physical Therapist
| 4m per day | ▲ 6% State avg: 4m per day · National avg: 4m per day |
|
Weekend RN
| 29m per day | ■ Avg State avg: 29m per day · National avg: 29m per day |
Reporting period: October 1 – December 31, 2025 (Q4 2025). Source: CMS Payroll-Based Journal report.
Manages medical care and health needs.
Assists with medical care and medications.
Helps with daily care and mobility.
Total hours from contractors
3,626 contractor hours this quarter
| Certified Nursing Assistant | 46 | 0 | 46 | 16,891 | 92 | 100% | 7.8 |
| Licensed Practical Nurse | 12 | 0 | 12 | 4,317 | 92 | 100% | 8.4 |
| Registered Nurse | 17 | 0 | 17 | 3,298 | 92 | 100% | 8.8 |
| Clinical Nurse Specialist | 9 | 0 | 9 | 3,147 | 72 | 78% | 9.1 |
| Mental Health Service Worker | 2 | 0 | 2 | 1,028 | 70 | 76% | 8 |
| Other Dietary Services Staff | 2 | 0 | 2 | 982 | 88 | 96% | 8 |
| Physical Therapy Aide | 0 | 4 | 4 | 899 | 77 | 84% | 7.1 |
| Speech Language Pathologist | 0 | 3 | 3 | 823 | 67 | 73% | 6.4 |
| Nurse Practitioner | 1 | 0 | 1 | 580 | 58 | 63% | 10 |
| Qualified Social Worker | 0 | 3 | 3 | 534 | 74 | 80% | 6.9 |
| Dietitian | 1 | 0 | 1 | 520 | 65 | 71% | 8 |
| Physical Therapy Assistant | 0 | 2 | 2 | 519 | 60 | 65% | 8.6 |
| Respiratory Therapy Technician | 0 | 3 | 3 | 495 | 71 | 77% | 6.9 |
| Administrator | 1 | 0 | 1 | 472 | 59 | 64% | 8 |
| Occupational Therapy Aide | 1 | 1 | 2 | 262 | 32 | 35% | 8.2 |
| Occupational Therapy Assistant | 0 | 2 | 2 | 66 | 19 | 21% | 3.5 |
| Medical Director | 0 | 1 | 1 | 36 | 12 | 13% | 3 |
Federal penalties imposed by CMS for regulatory violations, including civil money penalties (fines) and denials of payment for new Medicare/Medicaid admissions.
Source: CMS Penalties Database
No penalties in the past 3 years
No civil money penalties or payment denials were reported in the last 3 years.
These measures show how residents usually do over time at this home, based on health outcomes and preventive care.
Michigan average: 8.4
Michigan average: 16.3
Michigan average: 12.5%
Michigan average: 15.3%
Michigan average: 21.0%
Michigan average: 3.2%
Michigan average: 5.7%
Michigan average: 1.7%
Michigan average: 5.7%
Michigan average: 3.9%
Michigan average: 15.0%
Michigan average: 94.9%
Michigan average: 95.0%
Michigan average: 1.74
Michigan average: 1.54
Michigan average: 82.5%
Michigan average: 1.4%
Michigan average: 79.5%
Michigan average: 24.2%
Michigan average: 11.5%
Michigan average: 0.8%
Michigan average: 53.7%
Michigan average: 50.6%
Quality measures are calculated from Minimum Data Set (MDS) assessments. For most measures, lower percentages indicate better care quality.
13% of new residents, usually for short-term rehab.
70% of new residents, often for short stays.
17% of new residents, often for long-term daily care.
Source: CMS Long-Term Care Facility Characteristics (Data as of Jan 2026)
Residents meet regularly to discuss policies, care quality, and activities
Organized group of residents that meets regularly to discuss facility policies, quality of life, and activities.
Data sourced from CMS Long-Term Care Facility Characteristics quarterly report. Payer mix reflects the current resident census by primary payment source.
Historical financial and operational data for Medilodge of Wyoming from 2011–2023, based on CMS SNF Cost Reports.
Key figures below are for fiscal year ending in 12/2023.
Based on CMS SNF Cost Report for fiscal year ending in 12/2023.
Most residents stay long-term, while a smaller portion are admitted for short-term rehab.
Most new residents arrive under private pay (70% of admissions), and a typical private pay stay runs around 1 - 2 months.
Coverage residents most often arrive under.
Coverage residents most often leave under.
![]() 3.7 miles from city center
3.7 miles from city center
![]() Estimated distance in miles from Wyoming's city center to Medilodge of Wyoming's address, calculated via Google Maps.
— 0.69 miles to nearest hospital (University of Michigan Health West)
Estimated distance in miles from Wyoming's city center to Medilodge of Wyoming's address, calculated via Google Maps.
— 0.69 miles to nearest hospital (University of Michigan Health West)
Add your location
The information below is reported by the Michigan Department of Licensing and Regulatory Affairs (LARA).
| Medilodge of Wyoming | NH PC SNF | Wyoming (Gezon Park) | 80
Facility
80
MI AVG
74
Rank
#176 / 430 |
95.0%
Facility
95.0%
MI AVG
74
Rank
#16 / 119 | +28% | 3.83
Facility
3.83
MI AVG
4.30
Rank
#94 / 140 | +50% | -11% | $0
Facility
$0
MI AVG
$87.6k
Rank
#1 / 143 | 12
Facility
12
MI AVG
33.5
Rank
#19 / 142 | 3.0
Facility
3.0
MI AVG
5.2
Rank
#16 / 142 | - | 76 | - |
41
Facility
41
MI AVG
39
Rank
#311 / 703 | - | $9.4MFiscal year ending 12/2023
Facility
$9.4MFiscal year ending 12/2023
MI AVG
$15.8M
Rank
#101 / 141 | $4.7MFiscal year ending 12/2023
Facility
$4.7MFiscal year ending 12/2023
MI AVG
$5.6M
Rank
#114 / 141 | 50.6%Fiscal year ending 12/2023
Facility
50.6%Fiscal year ending 12/2023
MI AVG
39%
Rank
#96 / 141 | 235630 | ||||
| St. Ann’s Home | NH AL HOS MC SNF | Grand Rapids (Westside Connection) | 95
Facility
95
MI AVG
74
Rank
#144 / 430 |
24.2%
Facility
24.2%
MI AVG
74
Rank
#114 / 119 | -67% | 5.07
Facility
5.07
MI AVG
4.30
Rank
#20 / 140 | -10% | +18% | $0
Facility
$0
MI AVG
$87.6k
Rank
#1 / 143 | 15
Facility
15
MI AVG
33.5
Rank
#24 / 142 | 5.0
Facility
5.0
MI AVG
5.2
Rank
#71 / 142 | - | 23 | A+ |
25
Facility
25
MI AVG
39
Rank
#480 / 703 | Carmelite Sisters Of The Divine Heart Of Jesus | $8.7MFiscal year ending 12/2023
Facility
$8.7MFiscal year ending 12/2023
MI AVG
$15.8M
Rank
#117 / 141 | $6.9MFiscal year ending 12/2023
Facility
$6.9MFiscal year ending 12/2023
MI AVG
$5.6M
Rank
#70 / 141 | 78.7%Fiscal year ending 12/2023
Facility
78.7%Fiscal year ending 12/2023
MI AVG
39%
Rank
#13 / 141 | 235643 | ||||
| Holland Home Raybrook Campus | NH AL IL MC SNF | Grand Rapids (Ridgemoor) | 236
Facility
236
MI AVG
74
Rank
#3 / 430 |
22.5%
Facility
22.5%
MI AVG
74
Rank
#116 / 119 | -70% | 5.02
Facility
5.02
MI AVG
4.30
Rank
#24 / 140 | -16% | +17% | $0
Facility
$0
MI AVG
$87.6k
Rank
#1 / 143 | 21
Facility
21
MI AVG
33.5
Rank
#47 / 142 | 5.3
Facility
5.3
MI AVG
5.2
Rank
#80 / 142 | 1 | 53 | - |
41
Facility
41
MI AVG
39
Rank
#311 / 703 | Christian Living Services | $24.0MFiscal year ending 12/2023
Facility
$24.0MFiscal year ending 12/2023
MI AVG
$15.8M
Rank
#23 / 141 | $14.2MFiscal year ending 12/2023
Facility
$14.2MFiscal year ending 12/2023
MI AVG
$5.6M
Rank
#13 / 141 | 59.1%Fiscal year ending 12/2023
Facility
59.1%Fiscal year ending 12/2023
MI AVG
39%
Rank
#35 / 141 | 235440 | ||||
| Covenant Living of the Great Lakes | NH AL MC RC SNF | Grand Rapids (Westside Connection) | 102
Facility
102
MI AVG
74
Rank
#116 / 430 |
28.4%
Facility
28.4%
MI AVG
74
Rank
#113 / 119 | -62% | 3.49
Facility
3.49
MI AVG
4.30
Rank
#125 / 140 | +51% | -19% | $0
Facility
$0
MI AVG
$87.6k
Rank
#1 / 143 | 31
Facility
31
MI AVG
33.5
Rank
#76 / 142 | 10.3
Facility
10.3
MI AVG
5.2
Rank
#140 / 142 | - | 29 | A+ |
35
Facility
35
MI AVG
39
Rank
#371 / 703 | Covenant Living Of The Great Lakes | $4.8MFiscal year ending 09/2023
Facility
$4.8MFiscal year ending 09/2023
MI AVG
$15.8M
Rank
#138 / 141 | $2.3MFiscal year ending 09/2023
Facility
$2.3MFiscal year ending 09/2023
MI AVG
$5.6M
Rank
#134 / 141 | 46.9%Fiscal year ending 09/2023
Facility
46.9%Fiscal year ending 09/2023
MI AVG
39%
Rank
#26 / 141 | 235614 | ||||
| SKLD Leonard | NH HOS RC SNF | Grand Rapids (Northeast) | 69
Facility
69
MI AVG
74
Rank
#219 / 430 |
87.0%
Facility
87.0%
MI AVG
74
Rank
#48 / 119 | +18% | 4.09
Facility
4.09
MI AVG
4.30
Rank
#60 / 140 | +12% | -5% | $0
Facility
$0
MI AVG
$87.6k
Rank
#1 / 143 | 32
Facility
32
MI AVG
33.5
Rank
#79 / 142 | 6.4
Facility
6.4
MI AVG
5.2
Rank
#100 / 142 | 3 | 60 | A+ |
45
Facility
45
MI AVG
39
Rank
#267 / 703 | - | $7.3MFiscal year ending 12/2023
Facility
$7.3MFiscal year ending 12/2023
MI AVG
$15.8M
Rank
#114 / 141 | $4.0MFiscal year ending 12/2023
Facility
$4.0MFiscal year ending 12/2023
MI AVG
$5.6M
Rank
#118 / 141 | 55.1%Fiscal year ending 12/2023
Facility
55.1%Fiscal year ending 12/2023
MI AVG
39%
Rank
#81 / 141 | 235261 |
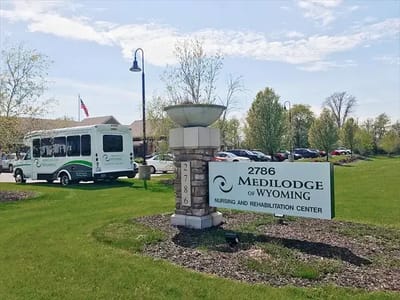
Medilodge of Wyoming is located in Wyoming, Michigan.
Here are the financial assistance programs available to residents in Michigan.
Medilodge of Wyoming is in the Gezon Park neighborhood.
Medilodge of Wyoming has a walk score of 41. Somewhat walkable. A few nearby services may be reachable on foot, but most trips require transportation.
Medilodge of Wyoming's occupancy is 93.5%.
No, Medilodge of Wyoming has a no-pet policy.
Medilodge of Wyoming is registered as a for-profit.
Yes — there are 21 photos of Medilodge of Wyoming in the photo gallery on this page.
Medilodge of Wyoming is located at 2786 56Th St Sw, Wyoming, MI 49418.
Care Cost Calculator: See Prices in Your Area
Nursing Home Data Explorer
Don’t Wait Too Long: 7 Red Flag Signs Your Parent Needs Assisted Living Now
The True Cost of Assisted Living in 2025 – And How Families Are Paying For It
Understanding Senior Living Costs: Pricing Models, Discounts & Financial Assistance


