Menig Nursing Home
Nursing Home & Independent Living · Rutland, VT
CMS overall rating Info The Overall CMS Rating is scored from 1 to 5 stars and combines results from health inspections, staffing levels, and quality measures. Health inspections carry the most weight. Staffing and quality scores can increase or decrease the final rating based on performance compared to state and national standards.

Menig Nursing Home

Nursing Home & Independent Living · Rutland, VT
CMS overall rating Info The Overall CMS Rating is scored from 1 to 5 stars and combines results from health inspections, staffing levels, and quality measures. Health inspections carry the most weight. Staffing and quality scores can increase or decrease the final rating based on performance compared to state and national standards.

Overview of Menig Nursing Home

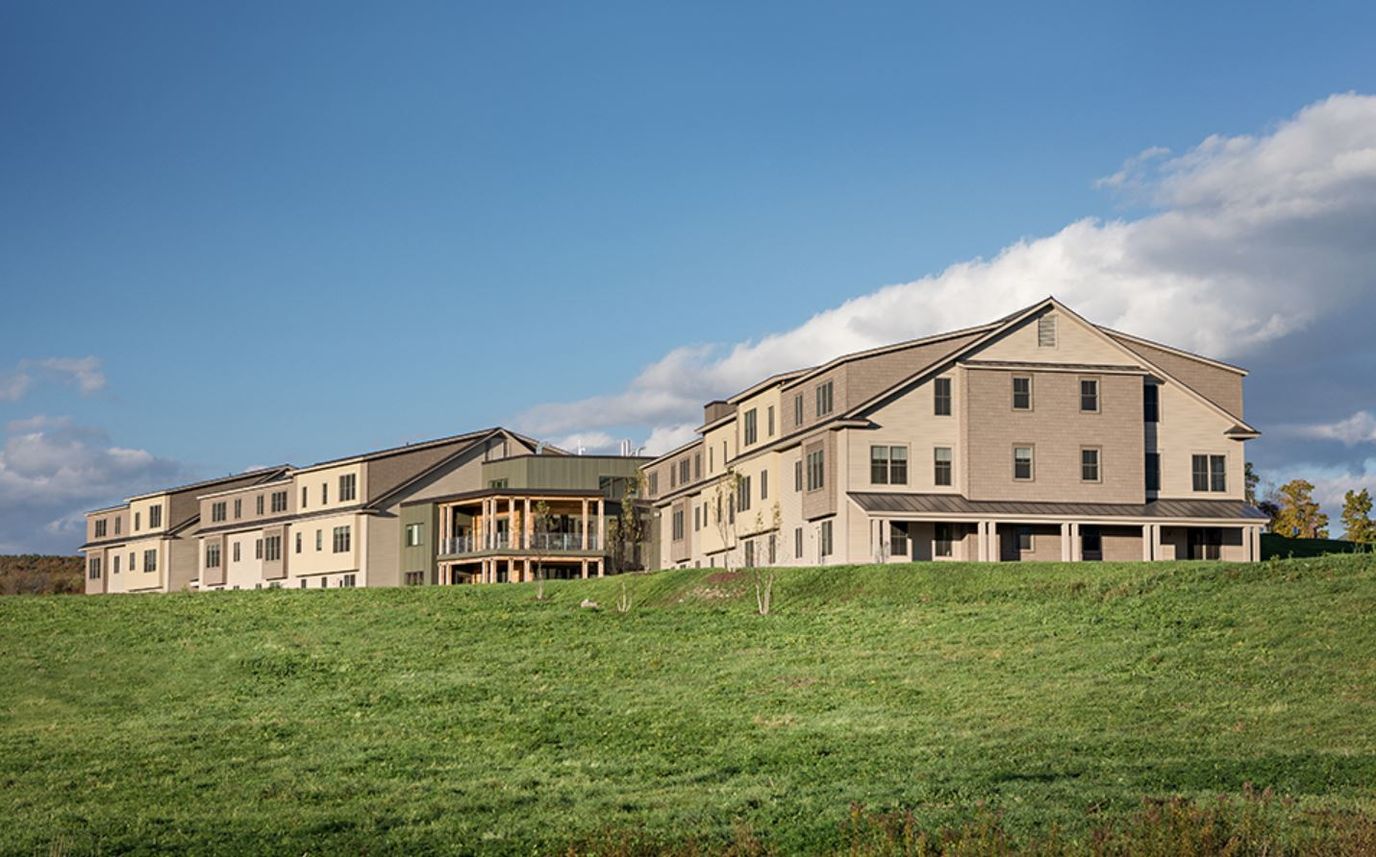
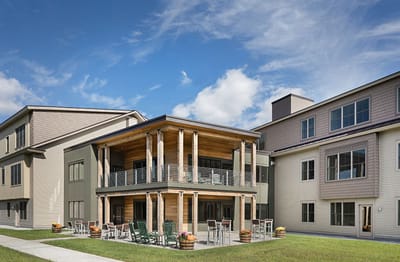
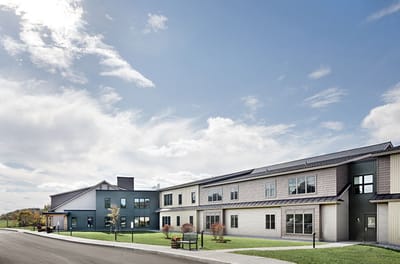
Menig Nursing Home is a community focusing on personalized care for efficient senior living care. Considerably one of the most trusted nursing homes in the city, management and staff ensure that everything is designed and catered to the needs of the individual resident. Specializing in independent living and skilled nursing, the lifestyle aims to change the meaning of recovery for seniors through an outstanding level of care delivered. 

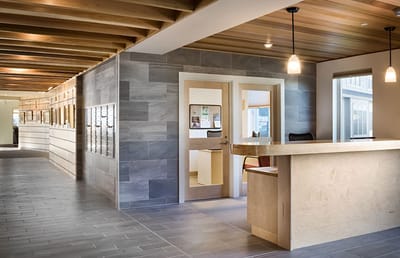
Menig Nursing Home offers wellness-centered services and amenities including specialized programs, social gatherings, a 24/7 emergency response system, routine maintenance. Parking spaces, housekeeping, transportation, and scheduled activities.

(802) 728-7800

Quality ratings

Measured by Centers for Medicare & Medicaid Services (CMS)

Overall rating Info The Overall CMS Rating combines results from health inspections, staffing levels and quality measures. Health inspections carry the most weight. Staffing and quality scores can increase or decrease the final rating based on performance compared to state and national standards.
▼ 24.2% Below VT avg. ▼ 24.2% Below VT avg.Click the badge to see the full State ranking.Click here to see the full State ranking.
Health Inspection Info Based on the results of the facility's three most recent standard inspections and any complaint investigations. CMS reviews the number, scope, and severity of deficiencies, with more recent findings weighted more heavily.
▼ 21.6% Below VT avg. ▼ 21.6% Below VT avg.Click the badge to see the full State ranking.Click here to see the full State ranking.
Staffing Info Measures average nursing staff hours per resident per day, including Registered Nurses (RNs) and total nursing staff. Ratings are adjusted based on the level of care residents require and are compared to state and national benchmarks.
▲ 29.4% Above VT avg. ▲ 29.4% Above VT avg.Click the badge to see the full State ranking.Click here to see the full State ranking.
Quality Measures Info Based on clinical and physical health indicators reported to CMS, such as hospital readmissions, falls, pressure ulcers, and improvements in mobility. These measures reflect how well residents' health needs are being managed.
▼ 35.3% Below VT avg. ▼ 35.3% Below VT avg.Click the badge to see the full State ranking.Click here to see the full State ranking.

Staffing hours breakdown

Info Daily nursing hours per resident by staff type, reported to CMS. Higher is generally better — compare this facility to state and national averages to see where staffing stands.

Hours per resident per day — compared to Vermont state averages

Total nursing care / resident Info This home is ranked 2nd out of 12 homes in Vermont. Total adjusted nursing hours per resident per day, combining RN, LPN, and aide time. CMS adjusts this for case-mix so facilities can be fairly compared.
5h 11m per day
Rank #2 / 12Nurse hours — State benchmarkedThis home is ranked 2nd out of 12 homes in Vermont. Shows adjusted nurse hours per resident per day benchmarked to the Vermont average, with a ranking across 12 Vermont SNFs. More hours mean more direct care. The national average is about 3.5 hrs; below 3.0 is a red flag.Click the rank badge to see the full State ranking.Click here to see the full State ranking.
This facility Vermont avg (4h 13m per day)
vs Vermont avg
+23%

1 of 5 metrics below state avg

Standout metric RN (Weekend) is +81% above state avg
Staff typeHours / Day / Residentvs state avg
Registered Nurse (RN) Info RNs hold the highest nursing license and can assess residents, interpret test results, and direct care plans. More RN hours per day often signals stronger clinical oversight and faster response to health changes. 1h 10m per day ▲ 43% State avg: 49m per day · National avg: 41m per day
LPN / LVN Info Licensed Practical Nurses (LPNs) or Licensed Vocational Nurses (LVNs) deliver routine hands-on care — medication administration, wound dressing, and monitoring vital signs. They work under RN supervision and make up a large share of daily bedside care. 36m per day ▼ 33% State avg: 54m per day · National avg: 52m per day
Nurse Aide Info Certified Nurse Aides (CNAs) provide the most direct day-to-day assistance: bathing, dressing, feeding, and mobility. Nurse aide hours are typically the largest staffing category and directly affect residents' quality of life. 2h 53m per day ▲ 11% State avg: 2h 36m per day · National avg: 2h 20m per day
Total Nursing (Weekend) Info Combined nursing hours (RN + LPN + Nurse Aide) per resident per day on weekends. Staffing often drops on weekends — this figure reveals whether the facility maintains adequate coverage outside of weekday hours. 3h 52m per day ▲ 5% State avg: 3h 42m per day · National avg: 3h 26m per day
RN (Weekend) Info Registered nurse hours specifically on weekends. Facilities sometimes reduce RN presence on Saturdays and Sundays — a low weekend RN figure compared to weekday hours can indicate reduced clinical oversight when most administrative staff are absent. 56m per day ▲ 81% State avg: 31m per day · National avg: 28m per day

Types of Care at Menig Nursing Home

Independent Living Nursing Home

Capacity and availability

This home usually has limited availability

Occupancy between 85% and 95% suggests balanced demand.

Higher occupancy than the Vermont average: 81%
Occupancy rate 94% Rank #2 / 12Occupancy rate — State benchmarkedThis home is ranked 2nd out of 12 homes in Vermont. Shows this facility's occupancy rate versus the Vermont average, with its Statewide rank out of 12. Higher occupancy signals strong local demand and financial stability.Click the rank badge to see the full State ranking.Click here to see the full State ranking.
Occupancy rate
94% Rank #2 / 12Occupancy rate — State benchmarkedThis home is ranked 2nd out of 12 homes in Vermont. Shows this facility's occupancy rate versus the Vermont average, with its Statewide rank out of 12. Higher occupancy signals strong local demand and financial stability.Click the rank badge to see the full State ranking.Click here to see the full State ranking.
Walk Score
Walk Score: 8 / 100 Rank #9 / 12Walk Score — State benchmarkedThis home is ranked 9th out of 12 homes in Vermont. Shows how walkable this facility's neighborhood is compared to the average Walk Score across Vermont SNFs. Higher scores benefit residents, families, and staff.Click the rank badge to see the full State ranking.Click here to see the full State ranking.
Car-dependent. Most errands require a car, with limited nearby walkable options.

About this community

License Details

Facility TypeNursing Home
CountyOrange

Contact Information

Fax802-728-2143

Contact Menig Nursing Home

Health Inspection History

Inspections Since 2022
Total health inspections 3

Vermont average 6.5


Last Health inspection on Jul 2024

Total health citations
20 Rank #3 / 12Health citations — State benchmarkedThis home is ranked 3rd out of 12 homes in Vermont. Shows this facility's total health deficiency citations benchmarked to the Vermont State average, with a ranking across all 12 VT SNFs. Lower citation counts earn a better rank.Click the rank badge to see the full State ranking.Click here to see the full State ranking.

Vermont average 28.9

Citations per inspection
6.67 Rank #10 / 12Citations per inspection — State benchmarkedThis home is ranked 10th out of 12 homes in Vermont. Shows average deficiency citations per CMS inspection for this facility versus the Vermont mean across 12 SNFs with citation data. Lower is better.Click the rank badge to see the full State ranking.Click here to see the full State ranking.

Vermont average 4.31


Health citations are formal notices following inspections when they fail to comply with safety and care standards.

17 of 20 citations resulted from standard inspections; and 3 of 20 resulted from complaint investigations.

Breakdown of citation severity (last 4 years)
Critical Health citations
0
100% better than Vermont average

Vermont average: 0.7


Serious Health citations
0
100% better than Vermont average

Vermont average: 1.9

0 critical citations Vermont average: 0.7

0 serious citations Vermont average: 1.9

19 moderate citations Vermont average: 24.6

1 minor citation Vermont average: 1.5
Citations history (last 4 years)
Administration moderate citation Jul 25, 2024
Corrected

Administration moderate citation Jul 25, 2024
Corrected

Administration moderate citation Jul 25, 2024
Corrected

Administration moderate citation Jul 25, 2024
Corrected

Staffing Data

Reporting period: October 1 – December 31, 2025 (Q4 2025). Source: CMS Payroll-Based Journal report.

Total staff 50
Employees 43
Contractors 7
Staff to resident ratio 1.79:1
10% better than Vermont average
Vermont average ratio: 1.63:1 Vermont average ratio: 1.63:1See full Vermont ranking
Avg staff/day 19
Average shift 7.6 hours
7% worse than Vermont average
Vermont average: 8.2 hours Vermont average shift: 8.2 hoursSee full Vermont ranking
Total staff hours (quarter) 13,346

Nursing staff breakdown

Q4 2025 · Oct 1 – Dec 31 More info This data comes from the CMS Payroll-Based Journal report covering October 1 – December 31, 2025.
Registered Nurse

Manages medical care and health needs.

Total count 11
Average shift length Info Average shift length. Calculated as total hours divided by days worked and average staff per day. 7.3 hours

No contractors work on this role.

Licensed Practical Nurse

Assists with medical care and medications.

Total count 7
Average shift length Info Average shift length. Calculated as total hours divided by days worked and average staff per day. 7.7 hours

No contractors work on this role.

Certified Nursing Assistant

Helps with daily care and mobility.

Total count 21
Average shift length Info Average shift length. Calculated as total hours divided by days worked and average staff per day. 8 hours

This role is partially covered by contractors.

Contractor staffing

Q4 2025 · Oct 1 – Dec 31 More info This data comes from the CMS Payroll-Based Journal report covering October 1 – December 31, 2025.

Total hours from contractors

22.1%

2,949 contractor hours this quarter

Certified Nursing Assistant: 5 Occupational Therapy Assistant: 1 Medical Director: 1

Staff by category

Q4 2025 · Oct 1 – Dec 31 More info This data comes from the CMS Payroll-Based Journal report covering October 1 – December 31, 2025.
Certified Nursing Assistant165216,73892100%8
Registered Nurse110111,90592100%7.3
Licensed Practical Nurse7071,78092100%7.7
Other Dietary Services Staff3035347076%6.9
Dietitian1014816368%7.6
Administrator1014776065%8
Nurse Practitioner1014125459%7.6
Dental Services Staff1013945358%7.4
RN Director of Nursing1013444953%7
Medication Aide/Technician1012383033%7.9
Medical Director0112878%4
Occupational Therapy Assistant0111644%4.1
21 Certified Nursing Assistant
% of Days 100%
11 Registered Nurse
% of Days 100%
7 Licensed Practical Nurse
% of Days 100%
3 Other Dietary Services Staff
% of Days 76%
1 Dietitian
% of Days 68%
1 Administrator
% of Days 65%
1 Nurse Practitioner
% of Days 59%
1 Dental Services Staff
% of Days 58%
1 RN Director of Nursing
% of Days 53%
1 Medication Aide/Technician
% of Days 33%
1 Medical Director
% of Days 8%
1 Occupational Therapy Assistant
% of Days 4%

Penalties and fines

Includes penalties issued in 2024

Federal penalties imposed by CMS for regulatory violations, including civil money penalties (fines) and denials of payment for new Medicare/Medicaid admissions.

Source: CMS Penalties Database (Data as of Jan 2026)

Total fines amount $77K Rank #8 / 12Federal fines — State benchmarkedThis home is ranked 8th out of 12 homes in Vermont. Shows this facility's cumulative CMS federal fine dollars versus the Vermont average among facilities with fines, and where it ranks among 12 skilled nursing facilities in the pool. Lower total dollars mean a better rank.Click the rank badge to see the full State ranking.Click here to see the full State ranking.
40% lower than Vermont average

Vermont average: $128K

Number of fines 1
44% fewer fines than Vermont average

Vermont average: 1.8

Payment Denials Info Serious action where Medicare and/or Medicaid temporarily stops payments for new residents until issues are fixed. 0
100% fewer payment denials than Vermont average

Vermont average: 0.5

Fines amount comparison
This facility $77K
Vermont average $128K
Penalty History

Penalties are imposed by CMS for violations of federal nursing home regulations.

1 penalty in the past 3 years

Jul 25, 2024 · $77K

Civil Money Penalty Info Fines imposed for noncompliance, which can be assessed per day or per instance of violation. Jul 25, 2024
$77K

Last updated: Jan 2026

Quality of care over time

These measures show how residents usually do over time at this home, based on health outcomes and preventive care.

High-risk clinical events score Info A composite score based on pressure ulcers, falls with injury, weight loss, walking ability decline, and activities of daily living decline. 14.0
20% worse than Vermont average

Vermont average: 11.6

Functional decline score Info A composite score based on activities of daily living decline, walking ability decline, and incontinence. 25.7
13% worse than Vermont average

Vermont average: 22.7

Long-stay resident measures
Below average Vermont avg: 2.5 Info CMS star rating based on long-stay quality measure performance. 5 stars = significantly above average, 1 star = significantly below average.
Need for Help with Daily Activities Increased Info Percent of long-stay residents whose need for help with daily activities has increased 24.8%
21% worse than Vermont average

Vermont average: 20.4%

Walking Ability Worsened Info Percent of long-stay residents whose ability to move independently worsened 21.7%
8% worse than Vermont average

Vermont average: 20.1%

Low Risk Residents with Bowel/Bladder Incontinence Info Percent of low risk long-stay residents who lose control of their bowels or bladder 30.7%
11% worse than Vermont average

Vermont average: 27.6%

Falls with Major Injury Info Percent of long-stay residents experiencing one or more falls with major injury 8.9%
52% worse than Vermont average

Vermont average: 5.8%

High Risk Residents with Pressure Ulcers Info Percent of long-stay high risk residents with pressure ulcers 10.9%
71% worse than Vermont average

Vermont average: 6.4%

Urinary Tract Infection Info Percent of long-stay residents with a urinary tract infection 0.9%
64% better than Vermont average

Vermont average: 2.5%

Lost Too Much Weight Info Percent of long-stay residents who lose too much weight 3.6%
34% better than Vermont average

Vermont average: 5.5%

Depressive Symptoms Info Percent of long-stay residents who have depressive symptoms 0.0%
100% better than Vermont average

Vermont average: 10.0%

Antipsychotic Use Info Percent of long-stay residents who received an antipsychotic medication 15.9%
18% better than Vermont average

Vermont average: 19.4%

Pneumococcal Vaccine Info Percent of long-stay residents assessed and appropriately given the pneumococcal vaccine 100.0%
5% better than Vermont average

Vermont average: 95.6%

Influenza Vaccine Info Percent of long-stay residents assessed and appropriately given the seasonal influenza vaccine 100.0%
In line with Vermont average

Vermont average: 97.6%

Hospitalizations per 1,000 days Info Number of hospitalizations per 1,000 long-stay resident days. 0.76
47% better than Vermont average

Vermont average: 1.44

ED visits per 1,000 days Info Number of outpatient emergency department visits per 1,000 long-stay resident days. 1.02
59% better than Vermont average

Vermont average: 2.48

Facility Characteristics

Source: CMS Long-Term Care Facility Characteristics (Data as of Jan 2026)

Total residents 28
Medicaid
19
67.9% of residents
Private pay or other
9
32.1% of residents
Programs & Services
Residents Group

Residents meet regularly to discuss policies, care quality, and activities

Active Resident Council

Organized group of residents that meets regularly to discuss facility policies, quality of life, and activities.

What does this home offer?

Room sizes icon
Room sizes icon

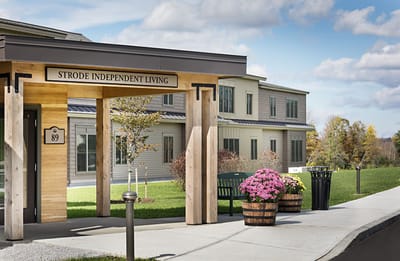
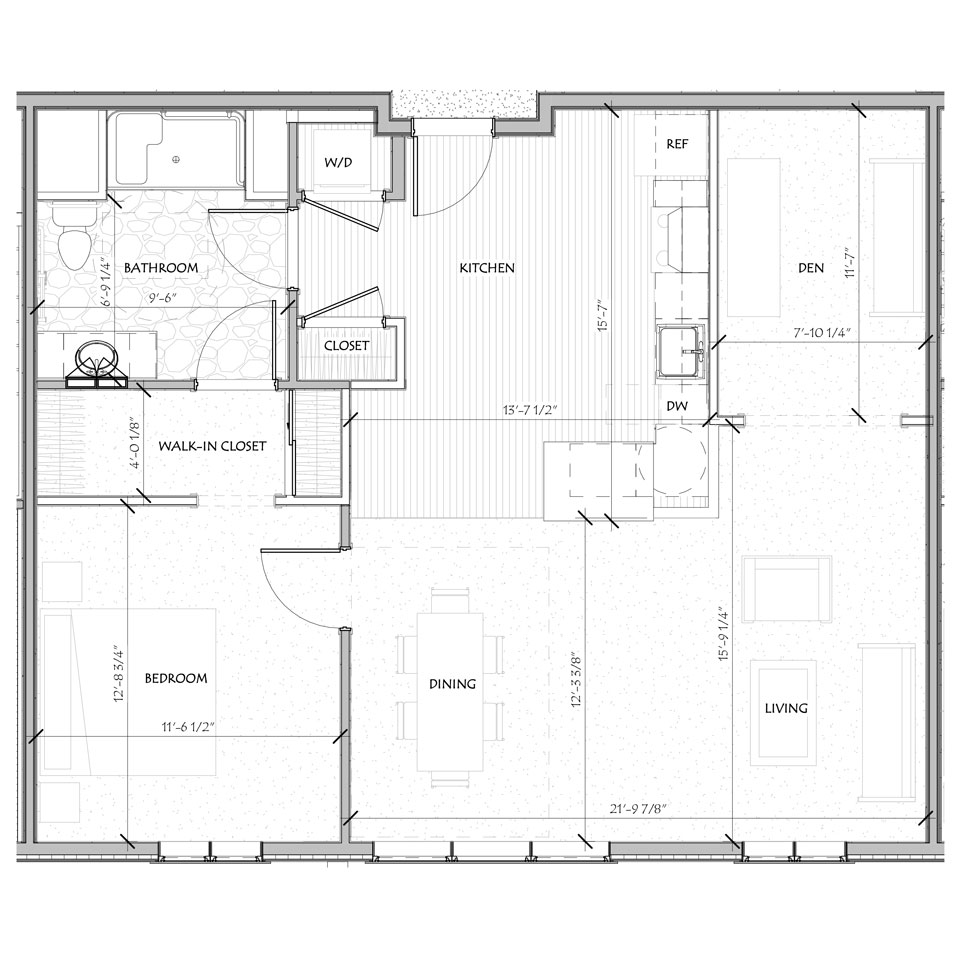
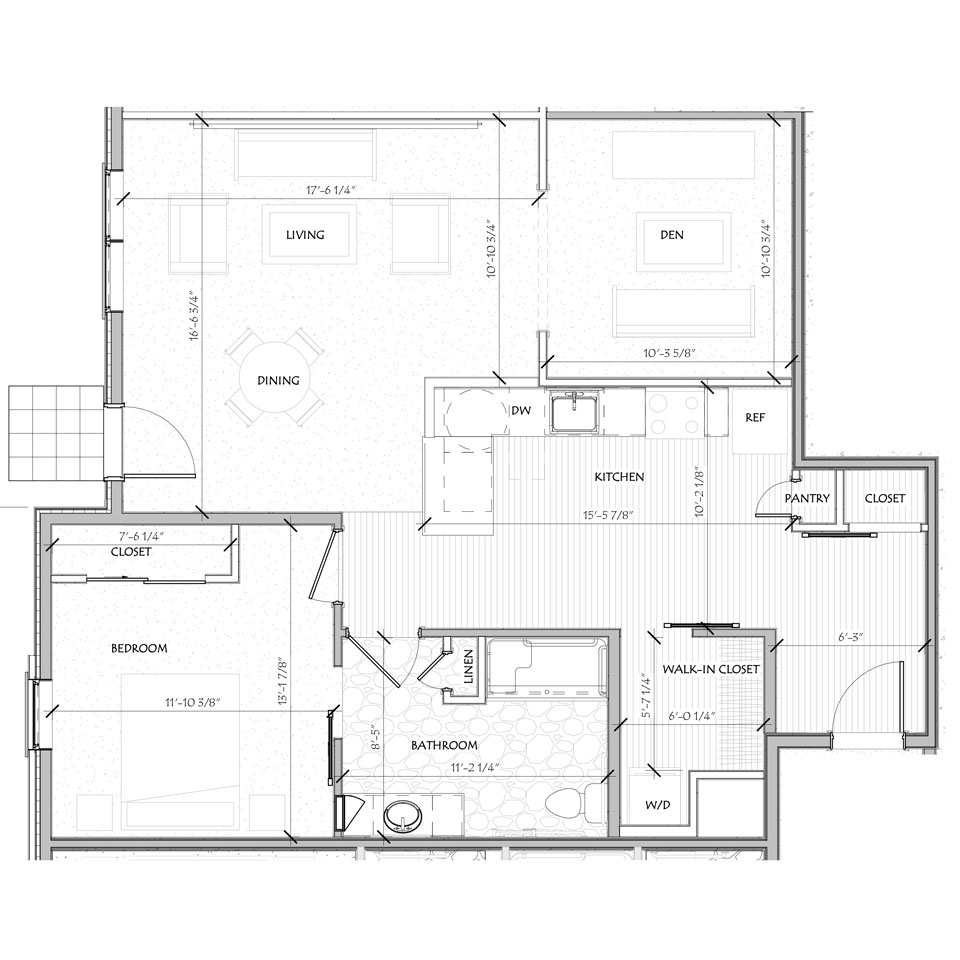
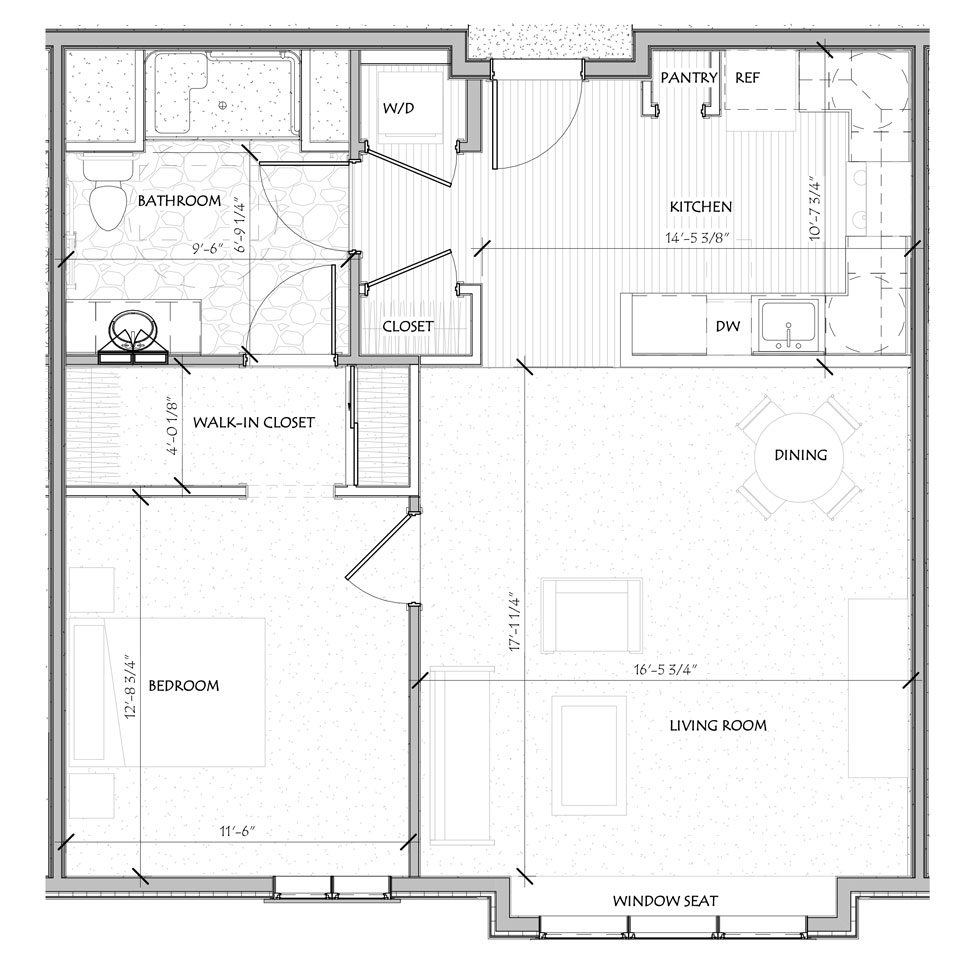
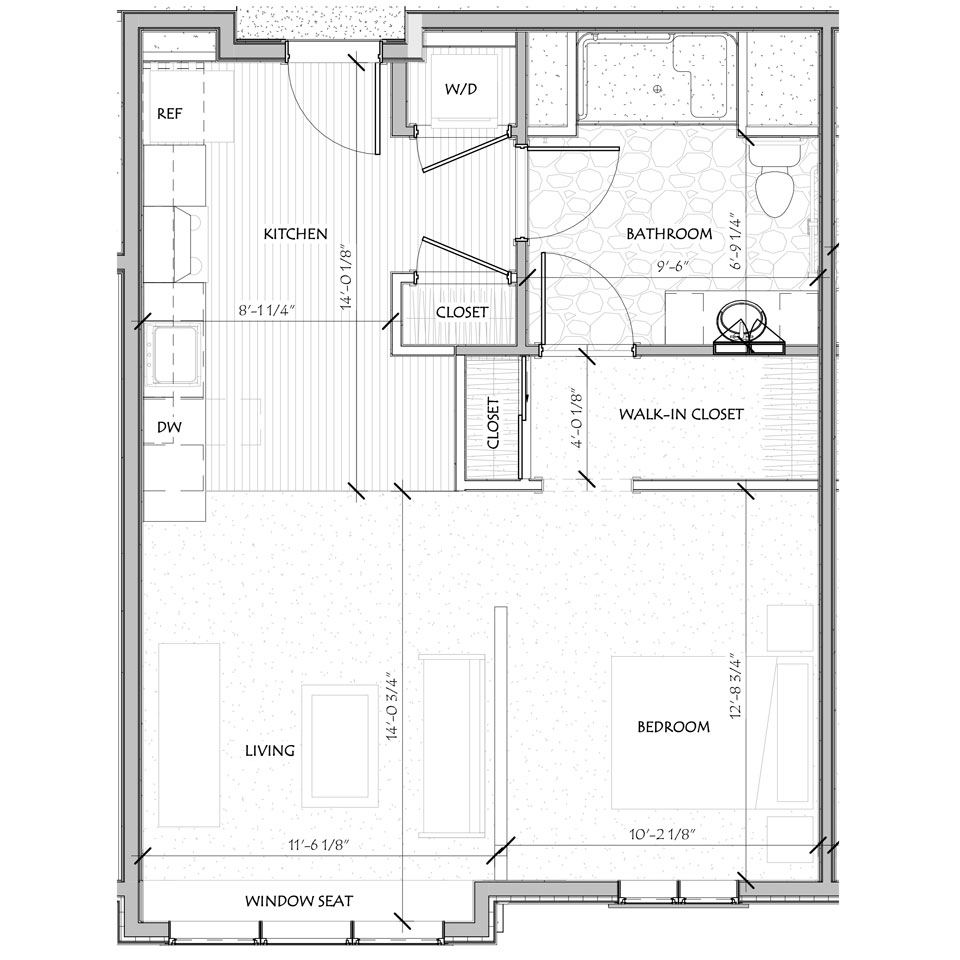
Room Sizes: 602 - 1,075 sq. ft

Housing options icon

Housing Options: Studio / 1 Bed / 2 Bed

Building type icon
Building type icon

Building Type: 3-story

Transportation services icon

Transportation Services

Fitness and recreation icon

Fitness and Recreation

Living Spaces & Floor Plans for Menig Nursing Home

Menig Nursing Home P4
Menig Nursing Home P3
Menig Nursing Home P2
Menig Nursing Home P1

Places of interest near Menig Nursing Home

Address 44.0 miles from city center Info Estimated distance in miles from Randolph Center's city center to Menig Nursing Home's address, calculated via Google Maps. — 1.2 miles to nearest hospital (Kingwood Health Center)

Calculate Travel Distance to Menig Nursing Home

Add your location

Address

Financial Assistance for
Nursing Home in Vermont

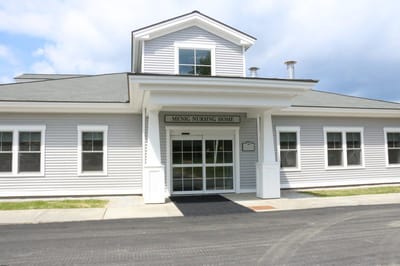
Menig Nursing Home is located in Randolph Center, Vermont.
Here are the financial assistance programs available to residents in Vermont.

Get Financial aid guidance

Choices for Care

VT Medicaid CFC

Age 65+ or disabled
General Vermont resident, Medicaid-eligible, nursing home-level care need.
Income Limits (2025) ~$2,829/month 300% FBR, individual
Asset Limits $2,000 (individual), $3,000 (couple).
VT

Small state; rural access emphasis.

Benefits
Personal care (5-7 hours/day) Respite (240 hours/year) Adult day care (~$65/day) Assisted living options

Vermont Assistive Community Care Services (ACCS)

VT ACCS

Age 65+
General Vermont resident, in approved residential setting.
Income Limits ~$1,732/month individual, varies
Asset Limits $2,000 individual
VT

Facility-based; limited funding.

Benefits
Personal care (2-4 hours/day in facility) Respite (varies) Basic support services

Older Americans Act (OAA) Services

Vermont OAA Services

Age 60+
General VT resident; no income/asset limits.
Income Limits (2025) None; donations encouraged.
Asset Limits Not assessed.
VT

5 AAAs (Age Well, CVCOA, NEKCOA, Senior Solutions, SVCOA); rural focus.

Benefits
Meals (~$5-$7/meal) Transportation Homemaker services (~4 hours/week) Respite (~5 days/year) Legal aid

Medicare Savings Program (MSP)

Vermont Medicare Savings Program

Age 65+ or disabled
General VT resident, Medicare Part A/B.
Income Limits (2025) ~$2,510/month (QMB), ~$3,380/month (SLMB), ~$3,598/month (QI)—individual.
Asset Limits $9,430 (individual), $14,130 (couple).
VT

Includes Extra Help for Part D; no waitlist.

Benefits
Covers Part B premiums ($174.70/month) Deductibles ($240/year) Copays (~20%)

Fuel Assistance Program

Vermont Seasonal Fuel Assistance

Age 60+ prioritized
General VT resident, low-income household.
Income Limits (2025) ~$3,970/month 185% FPL
Asset Limits Not assessed.
VT

Covers oil, gas, wood; emergency aid available.

Benefits
Heating aid ($300-$1,000/season) Crisis aid ($500 max)

Family Caregiver Support Program (FCSP)

Vermont Family Caregiver Support Program

Age
General Caregivers of 60+ needing care or 55+ caregivers of others; VT resident; 2+ ADLs.
Income Limits (2025) No strict cap; prioritizes low-income ~$24,980/year
Asset Limits Not assessed.
VT

Includes grandparent caregivers; serves ~1,000 annually.

Benefits
Respite (4-6 hours/week or 5 days/year) Adult day care ($60/day) Training Supplies (~$500/year)

VA Aid and Attendance (A&A) and Housebound Benefits

Vermont VA Aid and Attendance/Housebound

Age 65+ or disabled veteran/spouse
General VT resident, wartime service, ADL help (A&A) or homebound.
Income Limits (2025) Net income < ~$1,984/month (veteran with dependent, A&A); pension offsets income.
Asset Limits ~$155,356 net worth
VT

High rural veteran use; supports care costs.

Benefits
Cash (~$1,433-$2,642/month veteran, ~$951-$1,318 spouse) for care costs

Property Tax Adjustment Assistance

Vermont Property Tax Credit

Age 65+ (or all ages)
General VT resident, homeowner/renter, income-based.
Income Limits (2025) ~$47,000/year (household); caps credit at ~$128,000.
Asset Limits Not assessed.
VT

Credits up to $8,000; serves ~20,000 households.

Benefits
Tax credit (~$500-$2,500 avg., up to $8,000 max) reduces property tax

Commodity Supplemental Food Program (CSFP)

Vermont CSFP

Age 60+
General VT resident, low-income.
Income Limits (2025) ~$1,632/month 130% FPL
Asset Limits Not assessed.
VT

Serves ~5,000 seniors via 50+ drop sites.

Benefits
Monthly food box (~$50 value) with shelf-stable goods (e.g., cereal, canned goods)

Attendant Services Program (ASP)

Vermont Attendant Services Program

Age 65+ (or disabled 18+)
General VT resident, severe/permanent disability, 2+ ADL needs.
Income Limits (2025) Medicaid-eligible (~$2,829/month) or near-eligible for General Fund.
Asset Limits $2,000 (individual) for Medicaid; varies for General Fund.
VT

Participants hire/manage caregivers; serves ~500 annually.

Benefits
Personal care (4-6 hours/day) Respite (~5 days/year) Limited supplies

Frequently Asked Questions about Menig Nursing Home

What neighborhood is Menig Nursing Home in?

Menig Nursing Home is in the Randolph Center neighborhood of Randolph Center.

Is Menig Nursing Home in a walkable area?

Menig Nursing Home has a walk score of 8. Car-dependent. Most errands require a car, with limited nearby walkable options.

What is the phone number of Menig Nursing Home?

(802) 728-7800 will put you in contact with the team at Menig Nursing Home.

What county is Menig Nursing Home located in?

Menig Nursing Home is in Orange County.

Is Menig Nursing Home Medicare or Medicaid certified?

Yes — Menig Nursing Home is a CMS-certified provider of Medicare and Medicaid.

Guides for Better Senior Living

Care Cost Calculator: See Prices in Your Area

Nursing Home Data Explorer

Don’t Wait Too Long: 7 Red Flag Signs Your Parent Needs Assisted Living Now

The True Cost of Assisted Living in 2025 – And How Families Are Paying For It

Understanding Senior Living Costs: Pricing Models, Discounts & Financial Assistance

Explore Open Rooms
1 Contact details
2 What type of senior care service are you looking for?
3 What budget do you have in mind for senior care?
4 How soon do you need to find care?
5 Additional details

Thank you for your interest!

Our team will be in touch shortly to help with next steps.