Mountain View Center
Nursing Home, Hospice Care, Palliative Care & Respite Care · Rutland, VT
CMS overall rating Info CMS (the Centers for Medicare & Medicaid Services) is the federal agency that rates nursing home quality. Its Overall Rating runs from 1 to 5 stars, combining health inspections, staffing, and quality measures, with inspections weighted most heavily.

Mountain View Center

Nursing Home, Hospice Care, Palliative Care & Respite Care · Rutland, VT
CMS overall rating Info CMS (the Centers for Medicare & Medicaid Services) is the federal agency that rates nursing home quality. Its Overall Rating runs from 1 to 5 stars, combining health inspections, staffing, and quality measures, with inspections weighted most heavily.
Calculator: See prices in your area
Mountain View Center accepts Medicaid, Medicare, and private pay.

Overview of Mountain View Center

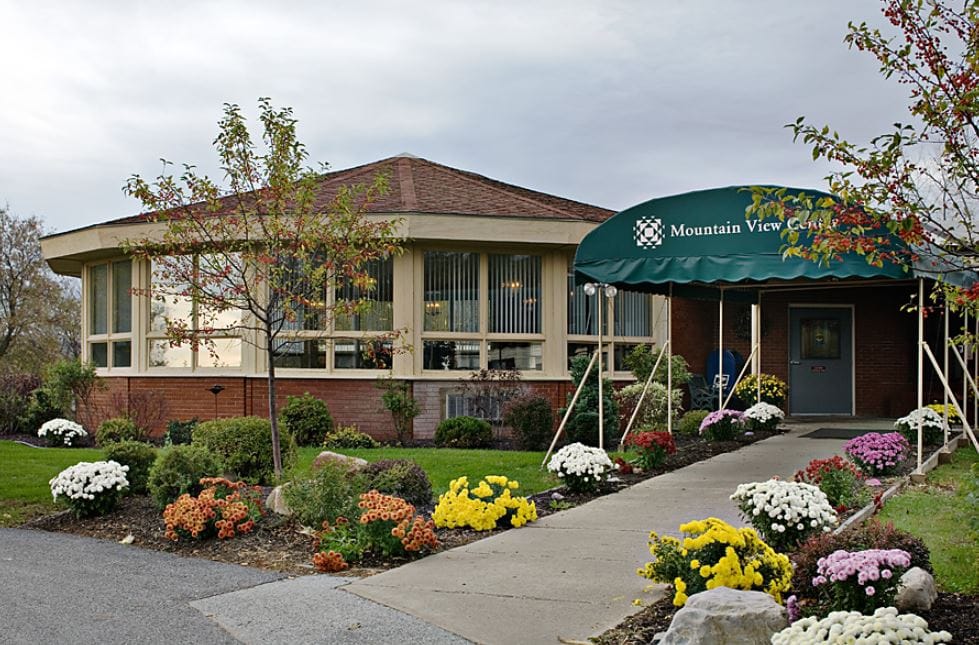
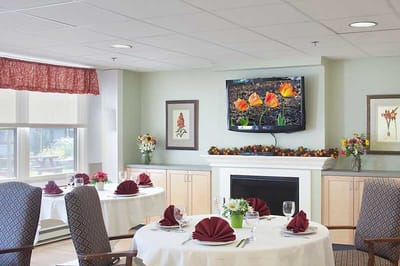
Mountain View Center of the Genesis Healthcare Community is a nursing home ideal for residents who seek to relax and recover. Specializing in short-term rehabilitation and long-term care, the multi-awarded community provides professional and compassionate service for its residents. Mountain View Center cultivates the holistic needs of its residents in a home-like setting.

The services are multidisciplinary for both skilled nursing and rehabilitation– focusing on post-surgical care, on-site therapy (physical, occupational, speech), strength conditioning, mobility improvement; colostomy care, dementia care, pain management, wound care; and medical professionals are on-call– medical directors, nurse practitioners, and physicians.

(802) 775-0007

Quality ratings

Measured by Centers for Medicare & Medicaid Services (CMS)

Overall rating Info The Overall CMS Rating combines results from health inspections, staffing levels and quality measures. Health inspections carry the most weight. Staffing and quality scores can increase or decrease the final rating based on performance compared to state and national standards.
▲ 45.1% Above VT avg. ▲ 45.1% Above VT avg.VT average: 2.8Click the badge to see the full State ranking.Click here to see the full State ranking.
Health Inspection Info Based on the results of the facility's three most recent standard inspections and any complaint investigations. CMS reviews the number, scope, and severity of deficiencies, with more recent findings weighted more heavily.
▲ 6.5% Above VT avg. ▲ 6.5% Above VT avg.VT average: 2.8Click the badge to see the full State ranking.Click here to see the full State ranking.
Staffing Info Measures average nursing staff hours per resident per day, including Registered Nurses (RNs) and total nursing staff. Ratings are adjusted based on the level of care residents require and are compared to state and national benchmarks.
At VT avg. At VT avg.VT average: 3.0Click the badge to see the full State ranking.Click here to see the full State ranking.
Quality Measures Info Based on clinical and physical health indicators reported to CMS, such as hospital readmissions, falls, pressure ulcers, and improvements in mobility. These measures reflect how well residents' health needs are being managed.
▲ 68.4% Above VT avg. ▲ 68.4% Above VT avg.VT average: 3.0Click the badge to see the full State ranking.Click here to see the full State ranking.

Staffing hours breakdown

Info Daily nursing hours per resident by staff type, reported to CMS. Higher is generally better — compare this facility to state and national averages to see where staffing stands.

Hours per resident per day — compared to Vermont state averages

Total nursing care / resident Info This home is ranked 10th out of 12 homes in Vermont for nurse hours. Total adjusted nursing hours per resident per day, combining RN, LPN, and aide time. CMS adjusts this for case-mix so facilities can be fairly compared.
3h 20m per day
Rank #10 / 12Nurse hours — State benchmarkedThis home is ranked 10th out of 12 homes in Vermont. Shows adjusted nurse hours per resident per day benchmarked to the Vermont average, with a ranking across 12 Vermont facilities. More hours mean more direct care. The national average is about 3.5 hrs; below 3.0 is a red flag.Ranking totals vary by category as each rank only includes facilities that report data for that metric. Homes missing that data point aren't included in the ranking.Click the rank badge to see the full State ranking.Click here to see the full State ranking.
This facility Vermont avg (4h 16m per day)
vs Vermont avg
-22%

5 of 6 metrics below state avg

Standout metric LPN / LVN is +13% above state avg
Staff type Hours / Day / Resident vs state avg
Registered Nurse (RN) Info RNs hold the highest nursing license and can assess residents, interpret test results, and direct care plans. More RN hours per day often signals stronger clinical oversight and faster response to health changes. 46m per day ▼ 6% State avg: 49m per day · National avg: 41m per day
LPN / LVN Info Licensed Practical Nurses (LPNs) or Licensed Vocational Nurses (LVNs) deliver routine hands-on care — medication administration, wound dressing, and monitoring vital signs. They work under RN supervision and make up a large share of daily bedside care. 1h 0m per day ▲ 13% State avg: 53m per day · National avg: 52m per day
Nurse Aide Info Certified Nurse Aides (CNAs) provide the most direct day-to-day assistance: bathing, dressing, feeding, and mobility. Nurse aide hours are typically the largest staffing category and directly affect residents' quality of life. 1h 54m per day ▼ 26% State avg: 2h 35m per day · National avg: 2h 21m per day
Weekend Total Nursing Info Combined nursing hours (RN + LPN + Nurse Aide) per resident per day on weekends. Staffing often drops on weekends — this figure reveals whether the facility maintains adequate coverage outside of weekday hours. 3h 16m per day ▼ 11% State avg: 3h 41m per day · National avg: 3h 26m per day
Physical Therapist Info Hours per resident per day provided by licensed Physical Therapists (PTs) or PT Assistants. PT services help residents recover mobility after injury or illness and are especially important for post-acute (short-stay) rehabilitation. 5m per day ▼ 12% State avg: 6m per day · National avg: 4m per day
Weekend RN Info Registered nurse hours specifically on weekends. Facilities sometimes reduce RN presence on Saturdays and Sundays — a low weekend RN figure compared to weekday hours can indicate reduced clinical oversight when most administrative staff are absent. 30m per day ▼ 5% State avg: 32m per day · National avg: 29m per day

Capacity and availability

This home usually has availability

Lower occupancy than the Vermont average: 81%
Occupancy rate
22.8% Rank #12 / 12Occupancy rate — State benchmarkedThis home is ranked 12th out of 12 homes in Vermont. Shows this facility's occupancy rate versus the Vermont average, with its Statewide rank out of 12. Higher occupancy signals strong local demand and financial stability.Ranking totals vary by category as each rank only includes facilities that report data for that metric. Homes missing that data point aren't included in the ranking.Click the rank badge to see the full State ranking.Click here to see the full State ranking.
Avg. Length of Stay
155 days
Bed community size
158-bed community Rank #2 / 13Bed count — State benchmarkedThis home is ranked 2nd out of 13 homes in Vermont. Shows this facility's certified or reported bed count compared to other Vermont facilities. Larger communities may offer more amenities, programs, and on-site services for residents and families.Ranking totals vary by category as each rank only includes facilities that report data for that metric. Homes missing that data point aren't included in the ranking.Click the rank badge to see the full State ranking.Click here to see the full State ranking.
A large-scale community that may provide a wide range of amenities, services, and structured programs.
Walk Score
Walk Score: 24 / 100 Rank #50 / 70Walk Score — State benchmarkedThis home is ranked 50th out of 70 homes in Vermont. Shows how walkable this facility's neighborhood is compared to the average Walk Score across Vermont facilities. Higher scores benefit residents, families, and staff.Ranking totals vary by category as each rank only includes facilities that report data for that metric. Homes missing that data point aren't included in the ranking.Click the rank badge to see the full State ranking.Click here to see the full State ranking.
Car-dependent. Most errands require a car, with limited nearby walkable options.

About this community

Awards

Awards2020 AHCA Bronze Award Winner, Quality Initiative Recognition Program Achiever, Genesis Center of Excellence

License Details

Facility TypeNursing Home
CountyRutland
AccreditationsAmerican Health Care Association (AHCA) Silver Quality Award winner, Patriot's Award Winner, Gold Star Employer

Safety & Compliance

Emergency Systems24-hour emergency alert and response system
Safety FeaturesSecure Care System for patients with cognitive deficits

Payment & Insurance

2 services
Accept Medicaid
Accept Medicare

Therapy & Rehabilitation

2 services
Rehabilitation Services
Respite Care

Staffing & Medical

2 services
Doctor on Staff
24-Hour Staffing

State Programs & Certifications (VT)

ACCS Program Assistive Community Care Services (ACCS) is a Medicaid-funded program providing personal care and homemaker services to eligible seniors and adults with disabilities.
ERC Program Enhanced Residential Care (ERC) is a Medicaid-funded program providing nursing-level care in licensed residential care homes as an alternative to nursing home placement.
Dementia/Memory Care Services

Contact Information

Fax802-775-3241

Amenities & Lifestyle

Private And Semi-Private Rooms
Spacious Rooms
Fully Air Conditioned
Activity Room
Wellness Center
Beautiful Garden(S) / Courtyard(S)
Scenic Views
Beauty Salon / Barber Services
Cable Television
Café With Always Available Menu Options
Comfortable Common And Lounge Areas
Country Kitchen
Dining Room
Private Dining Rooms For Family Gatherings
Restaurant-Style Dining
Complimentary Laundry Facility On-Site
Computer With Internet Access
Housekeeping
Mail And Newspaper Service
Telephone
Wireless Internet
Smoke Free Environment
ActivitiesRecreation activities available.
Specific ProgramsShortStay care, LongTerm care, Rehabilitation therapy, Podiatry care, Wound care, Pain management, Dietary and nutrition needs management, Discharge planning, Individual treatment plans, Heparin therapy, Recreation activities
Touring HoursRehabilitation Services 7 days per week, 7AM-7PM

Dining & Nutrition

Food DescriptionRestaurant-Style Dining with a café offering always available menu options.

Contact Mountain View Center

Inspection History

In Vermont, the Department of Disabilities, Aging and Independent Living is the authority responsible for inspecting facilities and investigating complaints to protect resident well-being.

Since 2022 · 4 years of data 35 deficiencies

Inspection Scorecard Info This scorecard compares key inspection, citation, and complaint metrics at this facility against the Vermont state average. Metrics rated ≥15% worse than average are highlighted in red; those ≥15% better are highlighted in green.

Since 2022 vs. Vermont state average
Overall vs. VT average 0 Worse No metrics in this bucket. 2 Better Metrics better than Vermont average:
• Total deficiencies (15% below)
• Deficiencies per year (15% below)
Latest Inspection September 9, 2025 Complaint Investigation

Deficiencies Info Deficiencies are formal regulatory issues recorded during state inspections.

This Facility VT Average vs. VT Avg
Total deficiencies Info Formal regulatory issues recorded by inspectors across all inspection types. 35 41 This facility has 15% fewer total deficiencies than a typical Vermont nursing home (35 vs. VT avg 41).↓ 15% better
Deficiencies per year Info Average deficiencies per year since 2022. 8.8 10.3 This facility has 15% fewer deficiencies per year than a typical Vermont nursing home (8.8 vs. VT avg 10.3).↓ 15% better

Inspection Reports Summary Info An editor-reviewed summary of the themes and findings across this facility's recent inspection reports.

  • September 9, 2025 complaint investigation substantiated failure to provide two-person assistance, causing a resident fall with fractured hip and hospitalization.
  • April 11, 2024 routine survey found 13 deficiencies including dignity and respect, staffing shortages, medication errors, wound care, and unsafe food storage.
  • June 4, 2025 complaint investigation substantiated verbal abuse by a Licensed Nursing Assistant against a resident, confirmed by facility and Administrator.

Health Inspection History

Inspections since 2022
Total health inspections 7

Vermont average 6.5


Last Health inspection on Sep 2025

Total health citations
32 Rank #6 / 12Health citations — State benchmarkedThis home is ranked 6th out of 12 homes in Vermont. Shows this facility's total health deficiency citations benchmarked to the Vermont State average, with a ranking across all 12 VT facilities. Lower citation counts earn a better rank.Ranking totals vary by category as each rank only includes facilities that report data for that metric. Homes missing that data point aren't included in the ranking.Click the rank badge to see the full State ranking.Click here to see the full State ranking.

Vermont average 28.9

Citations per inspection
4.57 Rank #6 / 12Citations per inspection — State benchmarkedThis home is ranked 6th out of 12 homes in Vermont. Shows average deficiency citations per CMS inspection for this facility versus the Vermont mean across 12 facilities with citation data. Lower is better.Ranking totals vary by category as each rank only includes facilities that report data for that metric. Homes missing that data point aren't included in the ranking.Click the rank badge to see the full State ranking.Click here to see the full State ranking.

Vermont average 4.31


Health citations are formal notices following inspections when they fail to comply with safety and care standards.

26 of 32 citations resulted from standard inspections; 4 of 32 resulted from complaint investigations; and 2 of 32 came from combined inspections (standard and complaint).

Breakdown of citation severity (last 4 years)
Critical health citations
0
100% better than Vermont average

Vermont average: 0.7


Serious health citations
2
5% worse than Vermont average

Vermont average: 1.9

0 critical citations Vermont average: 0.7

2 serious citations Vermont average: 1.9

28 moderate citations Vermont average: 24.6

2 minor citations Vermont average: 1.5
Citations history (last 4 years)
Quality of Care serious citation Sep 09, 2025
Corrected

Abuse/Neglect moderate citation Jun 04, 2025
Corrected

Abuse/Neglect moderate citation Apr 11, 2024
Corrected

Nursing Services moderate citation Apr 11, 2024
Corrected

Staffing Data

Reporting period: October 1 – December 31, 2025 (Q4 2025). Source: CMS Payroll-Based Journal report.

Total staff 228
Employees 158
Contractors 70
Staff to resident ratio 1.68 : 1
0% compared with Vermont average
Vermont average ratio: 1.68 : 1 Vermont average ratio: 1.68 : 1See full Vermont ranking
Avg staff/day 68
Average shift 8.3 hours
0% compared with Vermont average
Vermont average: 8.2 hours Vermont average shift: 8.2 hoursSee full Vermont ranking
Total staff hours (quarter) 51,675

Nursing staff breakdown

Q4 2025 · Oct 1 – Dec 31 More info This data comes from the CMS Payroll-Based Journal report covering October 1 – December 31, 2025.
Registered Nurse

Manages medical care and health needs.

RN Staff Info All 23 RN Staff are full-time employees. No contractors work on this role. 23
Average shift length Info Average shift length. Calculated as total hours divided by days worked and average staff per day. 8.6 hours
Licensed Practical Nurse

Assists with medical care and medications.

LPN Staff Info 46 total: 22 full-time employees and 24 contractors. 46
Average shift length Info Average shift length. Calculated as total hours divided by days worked and average staff per day. 8.9 hours
Certified Nursing Assistant

Helps with daily care and mobility.

CNA Staff Info 97 total: 56 full-time employees and 41 contractors. 97
Average shift length Info Average shift length. Calculated as total hours divided by days worked and average staff per day. 8.4 hours

Contractor staffing

Q4 2025 · Oct 1 – Dec 31 More info This data comes from the CMS Payroll-Based Journal report covering October 1 – December 31, 2025.

Total hours from contractors

18.4%

9,495 contractor hours this quarter

Certified Nursing Assistant: 41 Licensed Practical Nurse: 24 Occupational Therapy Aide: 2 Medical Director: 1 Occupational Therapy Assistant: 1 Respiratory Therapy Technician: 1

Staff by category

Q4 2025 · Oct 1 – Dec 31 More info This data comes from the CMS Payroll-Based Journal report covering October 1 – December 31, 2025.
Certified Nursing Assistant 56 41 97 22,257 92 100% 8.4
Licensed Practical Nurse 22 24 46 11,396 92 100% 8.9
Registered Nurse 23 0 23 6,624 92 100% 8.6
Clinical Nurse Specialist 9 0 9 2,115 64 70% 7.9
Other Dietary Services Staff 12 0 12 1,854 91 99% 6.8
Respiratory Therapy Technician 5 1 6 1,053 72 78% 7.6
Physical Therapy Assistant 5 0 5 962 70 76% 7.4
Mental Health Service Worker 2 0 2 888 64 70% 8
RN Director of Nursing 2 0 2 599 61 66% 7.7
Speech Language Pathologist 2 0 2 544 70 76% 7.7
Medication Aide/Technician 3 0 3 536 53 58% 7.9
Qualified Social Worker 2 0 2 491 65 71% 7.4
Administrator 1 0 1 480 60 65% 8
Other Social Services Staff 1 0 1 467 61 66% 7.7
Nurse Practitioner 4 0 4 452 55 60% 8.1
Physical Therapy Aide 2 0 2 421 54 59% 7.8
Occupational Therapy Aide 0 2 2 274 36 39% 6.4
Nurse Aide in Training 7 0 7 128 13 14% 5.8
Occupational Therapy Assistant 0 1 1 96 61 66% 1.6
Medical Director 0 1 1 40 15 16% 2.7
97 Certified Nursing Assistant
% of Days 100%
46 Licensed Practical Nurse
% of Days 100%
23 Registered Nurse
% of Days 100%
9 Clinical Nurse Specialist
% of Days 70%
12 Other Dietary Services Staff
% of Days 99%
6 Respiratory Therapy Technician
% of Days 78%
5 Physical Therapy Assistant
% of Days 76%
2 Mental Health Service Worker
% of Days 70%
2 RN Director of Nursing
% of Days 66%
2 Speech Language Pathologist
% of Days 76%
3 Medication Aide/Technician
% of Days 58%
2 Qualified Social Worker
% of Days 71%
1 Administrator
% of Days 65%
1 Other Social Services Staff
% of Days 66%
4 Nurse Practitioner
% of Days 60%
2 Physical Therapy Aide
% of Days 59%
2 Occupational Therapy Aide
% of Days 39%
7 Nurse Aide in Training
% of Days 14%
1 Occupational Therapy Assistant
% of Days 66%
1 Medical Director
% of Days 16%

Penalties and fines

Includes penalties issued in 2025

Federal penalties imposed by CMS for regulatory violations, including civil money penalties (fines) and denials of payment for new Medicare/Medicaid admissions.

Source: CMS Penalties Database (Data as of Jan 2026)

Total fines amount $25K Rank #3 / 12Federal fines — State benchmarkedThis home is ranked 3rd out of 12 homes in Vermont. Shows this facility's cumulative CMS federal fine dollars versus the Vermont average among facilities with fines, and where it ranks among 12 facilities in the pool. Lower total dollars mean a better rank.Ranking totals vary by category as each rank only includes facilities that report data for that metric. Homes missing that data point aren't included in the ranking.Click the rank badge to see the full State ranking.Click here to see the full State ranking.
81% lower than Vermont average

Vermont average: $128K

Number of fines 2
13% more fines than Vermont average

Vermont average: 1.8

Payment Denials Info Serious action where Medicare and/or Medicaid temporarily stops payments for new residents until issues are fixed. 0
100% fewer payment denials than Vermont average

Vermont average: 0.5

Fines amount comparison
This facility $25K
Vermont average $128K
Penalty History

Penalties are imposed by CMS for violations of federal nursing home regulations.

1 penalty in the past 3 years

Sep 9, 2025 · $15K

Civil Money Penalty Info Fines imposed for noncompliance, which can be assessed per day or per instance of violation. Sep 9, 2025
$15K

Last updated: Jan 2026

Quality of care over time

These measures show how residents usually do over time at this home, based on health outcomes and preventive care.

High-risk clinical events score Info A composite score based on pressure ulcers, falls with injury, weight loss, walking ability decline, and activities of daily living decline. 6.0
48% better than Vermont average

Vermont average: 11.6

Functional decline score Info A composite score based on activities of daily living decline, walking ability decline, and incontinence. 11.5
49% better than Vermont average

Vermont average: 22.7

Long-stay resident measures
Significantly above average Vermont avg: 2.5 Info CMS star rating based on long-stay quality measure performance. 5 stars = significantly above average, 1 star = significantly below average.
Need for Help with Daily Activities Increased Info Percent of long-stay residents whose need for help with daily activities has increased 9.1%
55% better than Vermont average

Vermont average: 20.4%

Walking Ability Worsened Info Percent of long-stay residents whose ability to move independently worsened 14.4%
28% better than Vermont average

Vermont average: 20.1%

Low Risk Residents with Bowel/Bladder Incontinence Info Percent of low risk long-stay residents who lose control of their bowels or bladder 10.9%
60% better than Vermont average

Vermont average: 27.6%

Falls with Major Injury Info Percent of long-stay residents experiencing one or more falls with major injury 2.6%
56% better than Vermont average

Vermont average: 5.8%

High Risk Residents with Pressure Ulcers Info Percent of long-stay high risk residents with pressure ulcers 1.5%
76% better than Vermont average

Vermont average: 6.4%

Urinary Tract Infection Info Percent of long-stay residents with a urinary tract infection 0.5%
82% better than Vermont average

Vermont average: 2.5%

Lost Too Much Weight Info Percent of long-stay residents who lose too much weight 2.6%
53% better than Vermont average

Vermont average: 5.5%

Depressive Symptoms Info Percent of long-stay residents who have depressive symptoms 23.5%
133% worse than Vermont average

Vermont average: 10.0%

Antipsychotic Use Info Percent of long-stay residents who received an antipsychotic medication 18.1%
7% better than Vermont average

Vermont average: 19.4%

Pneumococcal Vaccine Info Percent of long-stay residents assessed and appropriately given the pneumococcal vaccine 100.0%
5% better than Vermont average

Vermont average: 95.6%

Influenza Vaccine Info Percent of long-stay residents assessed and appropriately given the seasonal influenza vaccine 99.2%
In line with Vermont average

Vermont average: 97.6%

Hospitalizations per 1,000 days Info Number of hospitalizations per 1,000 long-stay resident days. 1.41
In line with Vermont average

Vermont average: 1.44

ED visits per 1,000 days Info Number of outpatient emergency department visits per 1,000 long-stay resident days. 1.91
23% better than Vermont average

Vermont average: 2.48

Short-stay resident measures
Significantly above average Vermont avg: 3.0 Info CMS star rating based on short-stay quality measure performance. 5 stars = much above average, 1 star = much below average.
Pneumococcal Vaccine Info Percent of short-stay residents assessed and appropriately given the pneumococcal vaccine 99.3%
15% better than Vermont average

Vermont average: 86.3%

Antipsychotic medication increase Info Percent of short-stay residents who newly received an antipsychotic medication 0.2%
86% better than Vermont average

Vermont average: 1.7%

Influenza Vaccine Info Percent of short-stay residents assessed and appropriately given the seasonal influenza vaccine 87.9%
11% better than Vermont average

Vermont average: 78.9%

Re-hospitalized after SNF stay Info Percentage of short-stay residents who were re-hospitalized after their nursing home admission. 25.4%
18% worse than Vermont average

Vermont average: 21.5%

Emergency department visits Info Percentage of short-stay residents who had an outpatient emergency department visit. 15.6%
11% better than Vermont average

Vermont average: 17.6%

Falls with major injury Info Percentage of SNF residents who experience falls with major injury during their stay. 0.8%
In line with Vermont average

Vermont average: 0.8%

Ability to care for self at discharge Info Percentage of residents at or above expected ability to care for themselves at discharge. 72.2%
34% better than Vermont average

Vermont average: 53.7%

Successful return to home or community Info Rate of successful return to home or community from a skilled nursing facility. 62.3%
23% better than Vermont average

Vermont average: 50.6%

Breakdown by payment type

Medicare

68% of new residents, usually for short-term rehab.

Typical stay 30 days

Private pay

26% of new residents, often for short stays.

Typical stay 2 - 3 months

Medicaid

5% of new residents, often for long-term daily care.

Typical stay 6 - 7 years

Facility Characteristics

Source: CMS Long-Term Care Facility Characteristics (Data as of Jan 2026)

Total residents 136
Medicare
18
13.2% of residents
Medicaid
104
76.5% of residents
Private pay or other
14
10.3% of residents
Programs & Services
Residents Group

Residents meet regularly to discuss policies, care quality, and activities

Family Member Group

Family members meet regularly to discuss policies, care quality, and activities

Nurse Aide Training

State-approved Nurse Aide Training and Competency Evaluation Program on-site

Active Family Council

Organized group of family members that meets regularly to discuss facility policies, resident care, and activities.

Active Resident Council

Organized group of residents that meets regularly to discuss facility policies, quality of life, and activities.

Finances and operations

Based on CMS SNF Cost Report for fiscal year ending in 12/2023.

Privately-owned community
Operated by a single business entity.
Net patient revenue Info Net patient revenue — what the home actually collects for resident care, after contractual allowances, bad debt and discounts are subtracted from its gross charges (CMS cost report, Worksheet G-3). It covers resident care only; money the home earns from other sources is shown separately as "Other income."
$17.0M
Net patient income Info Net patient income: net patient revenue minus the home's total operating expenses. A positive figure means it earns more from resident care than it spends to deliver it; a negative figure means the opposite. It excludes non-operating "other income."
-$2.6M
Privately-owned community Operated by a single business entity.
Net patient revenue Info Net patient revenue — what the home actually collects for resident care, after contractual allowances, bad debt and discounts are subtracted from its gross charges (CMS cost report, Worksheet G-3). It covers resident care only; money the home earns from other sources is shown separately as "Other income."
$17.0M Rank #2 / 11Revenue — State benchmarkedThis home is ranked 2nd out of 11 homes in Vermont. Shows this facility's annual revenue compared to the Vermont average. Higher revenue generally means more resources for staffing and capital — read alongside Payroll %.Ranking totals vary by category as each rank only includes facilities that report data for that metric. Homes missing that data point aren't included in the ranking.Click the rank badge to see the full State ranking.Click here to see the full State ranking.
Net patient income Info Net patient income: net patient revenue minus the home's total operating expenses. A positive figure means it earns more from resident care than it spends to deliver it; a negative figure means the opposite. It excludes non-operating "other income."
-$2.6M
Other income Info Money the home earns outside of resident care — such as investments, grants, rentals and other non-operating sources (CMS cost report, Worksheet G-3). It is tracked separately from net patient revenue: it is not part of that figure, and it is not included in net patient income.
$10.2K
Payroll costs Info Staff salaries plus wage-related costs — benefits such as payroll taxes, health insurance and retirement — from the home's own accounting records (CMS cost report, Worksheet A). Contract or agency labor is counted separately, under other operating costs. Rank #4 / 11Payroll — State benchmarkedThis home is ranked 4th out of 11 homes in Vermont. Shows total annual staff payroll benchmarked to the Vermont average. Higher payroll investment relative to peers often signals better staffing and less reliance on cheaper contract labor.Ranking totals vary by category as each rank only includes facilities that report data for that metric. Homes missing that data point aren't included in the ranking.Click the rank badge to see the full State ranking.Click here to see the full State ranking.
$9.0M 53.1% of net patient revenue Info Payroll as a share of revenue: staff salaries and wage-related benefits divided by net patient revenue. A higher figure means more of each revenue dollar goes to staff pay. Rank #7 / 11Payroll % — State benchmarkedThis home is ranked 7th out of 11 homes in Vermont. Shows payroll as a percentage of revenue versus the Vermont average. Below 25% may signal understaffing or heavy agency use — read with Staffing ratings.Ranking totals vary by category as each rank only includes facilities that report data for that metric. Homes missing that data point aren't included in the ranking.Click the rank badge to see the full State ranking.Click here to see the full State ranking.
Other operating costs Info Everything it costs to run the home apart from payroll — food, utilities, supplies, maintenance, contract labor and administration. Calculated as total operating expense minus payroll (staff salaries and wage-related benefits).
$10.6M
Total costs Info The home's total operating expense for the year — all the costs of running it, salaries included (CMS cost report, Worksheet G-3).
$19.6M

Who this home usually serves

TYPE OF STAY

Mostly short-term rehab stays

Most residents typically stay for a few weeks or months before returning home or moving on.

Most new residents arrive under Medicare (68% of admissions), and a typical Medicare stay runs around 30 days.

Admissions
315 total

Coverage residents most often arrive under.

Medicare 68%
Private pay 26%
Medicaid 5%
Discharges
314 total

Coverage residents most often leave under.

Medicare 52%
Private pay 23%
Medicaid 25%

Managed by Teresa Isabelle

Administrator

3 years of experience

Teresa Isabelle is the Administrator of Mountain View Center. She completed three years as an Administrator in Training before assuming her current role. Teresa holds a Bachelor of Science in Business Administration from Castleton University and a Master’s in Healthcare Administration from Champlain College. Licensed as a Nursing Home Administrator, she is dedicated to providing compassionate care and fostering a family atmosphere among residents and staff.

Places of interest near Mountain View Center

Address 1.8 miles from city center Info Estimated distance in miles from Rutland's city center to Mountain View Center's address, calculated via Google Maps. — 0.14 miles to nearest hospital (Rutland hospital)

Calculate Travel Distance to Mountain View Center

Add your location

Address

Compare Nursing Home around Rutland

The information below is reported by the Vermont Department of Disabilities, Aging and Independent Living.

4 facilities compared · CMS & VT Dept. of Health data

The Pines at Rutland Center for Nursing and Rehabilitation
NH
HC
PC
RC
Rutland (Allen Street)
125
Facility 125
VT AVG 109
Rank #7 / 13
91.3%
Facility 91.3%
VT AVG 81%
Rank #5 / 12
+13%
3.29
Facility 3.29
VT AVG 4.27
Rank #10 / 12
+54% -23%
$8.5k
Facility $8.5k
VT AVG $151.3k
Rank #2 / 12
23
Facility 23
VT AVG 28.9
Rank #5 / 12
4.6
Facility 4.6
VT AVG 4.3
Rank #6 / 12
1 111 -
36
Facility 36
VT AVG 44
Rank #37 / 70
Diane Sullivan
$18.4M
Facility $18.4M
VT AVG $12.1M
Rank #4 / 11
$8.5M
Facility $8.5M
VT AVG $4.4M
Rank #3 / 11
46.2%
Facility 46.2%
VT AVG 38%
Rank #6 / 11
475018
Rutland Center for Living and Rehabilitation
NH
RC
Rutland (Rutland City)
103
Facility 103
VT AVG 109
Rank #9 / 13
93.7%
Facility 93.7%
VT AVG 81%
Rank #3 / 12
+16%
3.64
Facility 3.64
VT AVG 4.27
Rank #8 / 12
-7% -15%
$32.7k
Facility $32.7k
VT AVG $151.3k
Rank #5 / 12
11
Facility 11
VT AVG 28.9
Rank #2 / 12
2.2
Facility 2.2
VT AVG 4.3
Rank #2 / 12
2 91 -
86
Facility 86
VT AVG 44
Rank #6 / 70
David Lamando
$11.9M
Facility $11.9M
VT AVG $12.1M
Rank #8 / 11
$5.9M
Facility $5.9M
VT AVG $4.4M
Rank #10 / 11
49.7%
Facility 49.7%
VT AVG 38%
Rank #9 / 11
475039
Mountain View Center
NH
HC
PC
RC
Rutland (Haywood Avenue)
158
Facility 158
VT AVG 109
Rank #2 / 13
22.8%
Facility 22.8%
VT AVG 81%
Rank #12 / 12
-72%
3.34
Facility 3.34
VT AVG 4.27
Rank #10 / 12
-14% -22%
$9.6k
Facility $9.6k
VT AVG $151.3k
Rank #3 / 12
32
Facility 32
VT AVG 28.9
Rank #6 / 12
4.6
Facility 4.6
VT AVG 4.3
Rank #6 / 12
2 36 -
24
Facility 24
VT AVG 44
Rank #50 / 70
Genesis Vt Holdings LLC
$17.0M
Facility $17.0M
VT AVG $12.1M
Rank #2 / 11
$9.0M
Facility $9.0M
VT AVG $4.4M
Rank #4 / 11
53.1%
Facility 53.1%
VT AVG 38%
Rank #7 / 11
475012
Menig Nursing Home
NH
Randolph Center
30
Facility 30
VT AVG 109
Rank #12 / 13
94.0%
Facility 94.0%
VT AVG 81%
Rank #2 / 12
+16%
5.19
Facility 5.19
VT AVG 4.27
Rank #2 / 12
+87% +21%
$76.5k
Facility $76.5k
VT AVG $151.3k
Rank #6 / 12
20
Facility 20
VT AVG 28.9
Rank #3 / 12
6.7
Facility 6.7
VT AVG 4.3
Rank #10 / 12
- 30 -
8
Facility 8
VT AVG 44
Rank #64 / 70
Gifford Health Care Inc - - - 475058

Financial Assistance for
Nursing Home in Vermont

Mountain View Center is located in Rutland, Vermont.
Here are the financial assistance programs available to residents in Vermont.

Get Financial aid guidance

Choices for Care

VT Medicaid CFC

Age 65+ or disabled
General Vermont resident, Medicaid-eligible, nursing home-level care need.
Income Limits (2025) ~$2,829/month 300% FBR, individual
Asset Limits $2,000 (individual), $3,000 (couple).
VT

Small state; rural access emphasis.

Benefits
Personal care (5-7 hours/day) Respite (240 hours/year) Adult day care (~$65/day) Assisted living options

Vermont Assistive Community Care Services (ACCS)

VT ACCS

Age 65+
General Vermont resident, in approved residential setting.
Income Limits ~$1,732/month individual, varies
Asset Limits $2,000 individual
VT

Facility-based; limited funding.

Benefits
Personal care (2-4 hours/day in facility) Respite (varies) Basic support services

Older Americans Act (OAA) Services

Vermont OAA Services

Age 60+
General VT resident; no income/asset limits.
Income Limits (2025) None; donations encouraged.
Asset Limits Not assessed.
VT

5 AAAs (Age Well, CVCOA, NEKCOA, Senior Solutions, SVCOA); rural focus.

Benefits
Meals (~$5-$7/meal) Transportation Homemaker services (~4 hours/week) Respite (~5 days/year) Legal aid

Medicare Savings Program (MSP)

Vermont Medicare Savings Program

Age 65+ or disabled
General VT resident, Medicare Part A/B.
Income Limits (2025) ~$2,510/month (QMB), ~$3,380/month (SLMB), ~$3,598/month (QI)—individual.
Asset Limits $9,430 (individual), $14,130 (couple).
VT

Includes Extra Help for Part D; no waitlist.

Benefits
Covers Part B premiums ($174.70/month) Deductibles ($240/year) Copays (~20%)

Fuel Assistance Program

Vermont Seasonal Fuel Assistance

Age 60+ prioritized
General VT resident, low-income household.
Income Limits (2025) ~$3,970/month 185% FPL
Asset Limits Not assessed.
VT

Covers oil, gas, wood; emergency aid available.

Benefits
Heating aid ($300-$1,000/season) Crisis aid ($500 max)

Family Caregiver Support Program (FCSP)

Vermont Family Caregiver Support Program

Age
General Caregivers of 60+ needing care or 55+ caregivers of others; VT resident; 2+ ADLs.
Income Limits (2025) No strict cap; prioritizes low-income ~$24,980/year
Asset Limits Not assessed.
VT

Includes grandparent caregivers; serves ~1,000 annually.

Benefits
Respite (4-6 hours/week or 5 days/year) Adult day care ($60/day) Training Supplies (~$500/year)

VA Aid and Attendance (A&A) and Housebound Benefits

Vermont VA Aid and Attendance/Housebound

Age 65+ or disabled veteran/spouse
General VT resident, wartime service, ADL help (A&A) or homebound.
Income Limits (2025) Net income < ~$1,984/month (veteran with dependent, A&A); pension offsets income.
Asset Limits ~$155,356 net worth
VT

High rural veteran use; supports care costs.

Benefits
Cash (~$1,433-$2,642/month veteran, ~$951-$1,318 spouse) for care costs

Property Tax Adjustment Assistance

Vermont Property Tax Credit

Age 65+ (or all ages)
General VT resident, homeowner/renter, income-based.
Income Limits (2025) ~$47,000/year (household); caps credit at ~$128,000.
Asset Limits Not assessed.
VT

Credits up to $8,000; serves ~20,000 households.

Benefits
Tax credit (~$500-$2,500 avg., up to $8,000 max) reduces property tax

Commodity Supplemental Food Program (CSFP)

Vermont CSFP

Age 60+
General VT resident, low-income.
Income Limits (2025) ~$1,632/month 130% FPL
Asset Limits Not assessed.
VT

Serves ~5,000 seniors via 50+ drop sites.

Benefits
Monthly food box (~$50 value) with shelf-stable goods (e.g., cereal, canned goods)

Attendant Services Program (ASP)

Vermont Attendant Services Program

Age 65+ (or disabled 18+)
General VT resident, severe/permanent disability, 2+ ADL needs.
Income Limits (2025) Medicaid-eligible (~$2,829/month) or near-eligible for General Fund.
Asset Limits $2,000 (individual) for Medicaid; varies for General Fund.
VT

Participants hire/manage caregivers; serves ~500 annually.

Benefits
Personal care (4-6 hours/day) Respite (~5 days/year) Limited supplies

Frequently Asked Questions about Mountain View Center

What neighborhood is Mountain View Center in?

Mountain View Center is in the Haywood Avenue neighborhood of Rutland.

Is Mountain View Center in a walkable area?

Mountain View Center has a walk score of 24. Car-dependent. Most errands require a car, with limited nearby walkable options.

What is the occupancy rate at Mountain View Center?

Mountain View Center's occupancy is 84.5%.

Are there photos of Mountain View Center?

Yes — there are 9 photos of Mountain View Center in the photo gallery on this page.

What is the phone number of Mountain View Center?

(802) 775-0007 will put you in contact with the team at Mountain View Center.

What county is Mountain View Center located in?

Mountain View Center is in Rutland County.

Is Mountain View Center Medicare or Medicaid certified?

Yes — Mountain View Center is a CMS-certified provider of Medicare and Medicaid.

Guides for Better Senior Living

Care Cost Calculator: See Prices in Your Area

Nursing Home Data Explorer

Don’t Wait Too Long: 7 Red Flag Signs Your Parent Needs Assisted Living Now

The True Cost of Assisted Living in 2025 – And How Families Are Paying For It

Understanding Senior Living Costs: Pricing Models, Discounts & Financial Assistance