Mirabella at ASU
Nursing Home, Assisted Living & Memory Care · Tempe, AZ
CMS overall rating Info CMS (the Centers for Medicare & Medicaid Services) is the federal agency that rates nursing home quality. Its Overall Rating runs from 1 to 5 stars, combining health inspections, staffing, and quality measures, with inspections weighted most heavily.

Mirabella at ASU

Nursing Home, Assisted Living & Memory Care · Tempe, AZ
CMS overall rating Info CMS (the Centers for Medicare & Medicaid Services) is the federal agency that rates nursing home quality. Its Overall Rating runs from 1 to 5 stars, combining health inspections, staffing, and quality measures, with inspections weighted most heavily.
Calculator: See prices in your area
Mirabella at ASU accepts Medicare and private pay.

Overview of Mirabella at Asu

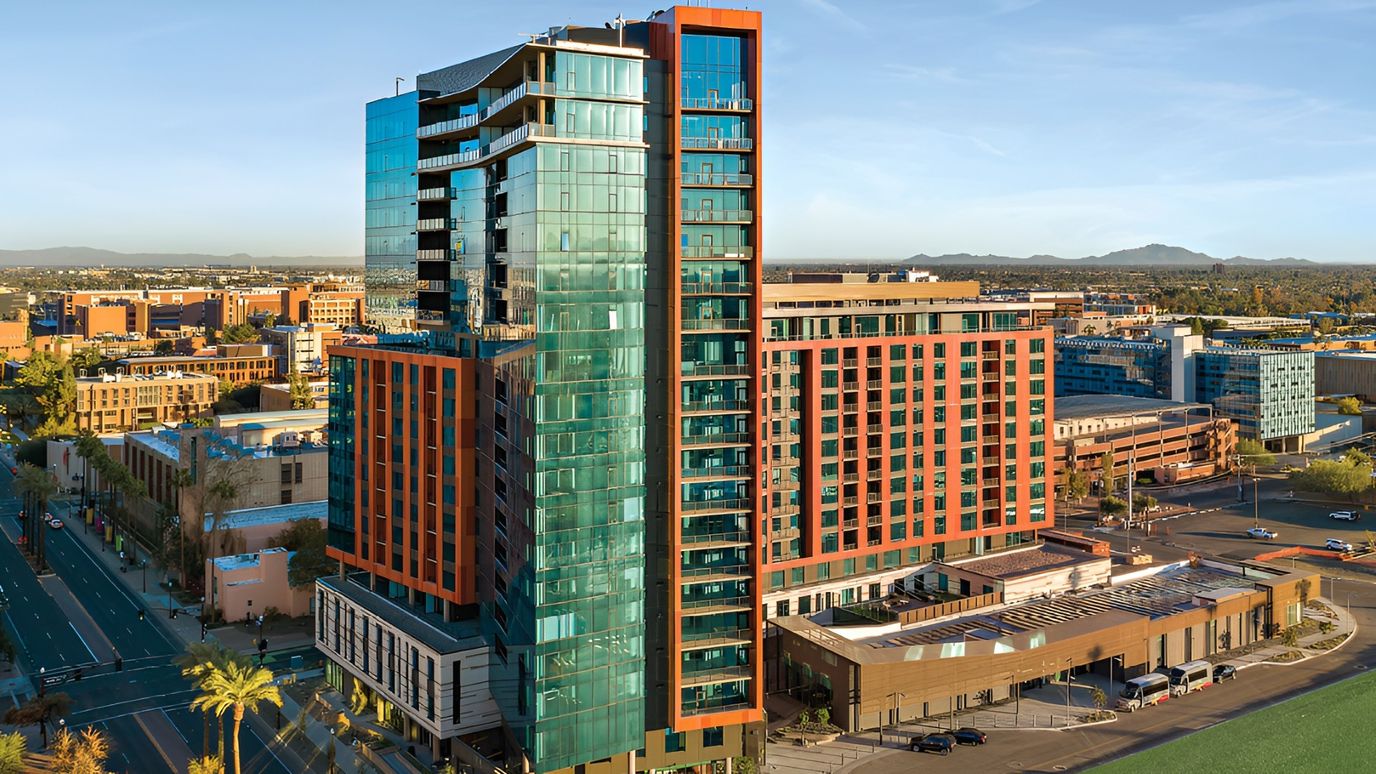
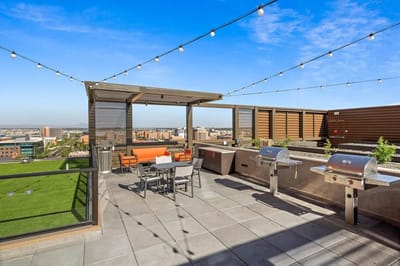
Mirabella at Asu is an exceptional community located in the thriving neighborhood of Tempe, AZ, offering independent living. The community also strives to keep residents’ peace of mind with a continuum of care services, including assisted living, memory care, and skilled nursing. Residents’ comfort and safety are prioritized with specially designed and spacious one- and two-bedroom floor plans.

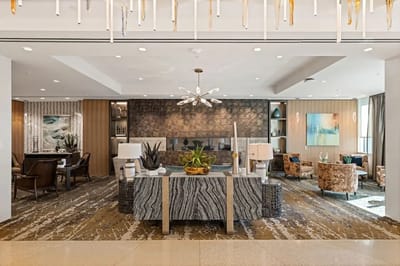
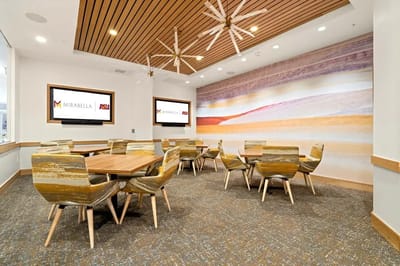
Promoting an active and convenient lifestyle, a thoughtfully curated calendar of fun recreational activities and enriching programs is conducted. Delightful and nutritious meals are also served to satisfy residents’ dietary needs and preferences. The community features state-of-the-art amenities, including a fitness center, an aquatic center, an art studio, a woodworking shop, and a garden terrace, creating the ideal setting for a blissful retirement.

Quality ratings

Measured by Centers for Medicare & Medicaid Services (CMS)

Overall rating Info The Overall CMS Rating combines results from health inspections, staffing levels and quality measures. Health inspections carry the most weight. Staffing and quality scores can increase or decrease the final rating based on performance compared to state and national standards.
▼ 9.5% Below AZ avg. ▼ 9.5% Below AZ avg.AZ average: 3.3Click the badge to see the full State ranking.Click here to see the full State ranking.
Health Inspection Info Based on the results of the facility's three most recent standard inspections and any complaint investigations. CMS reviews the number, scope, and severity of deficiencies, with more recent findings weighted more heavily.
▲ 8.3% Above AZ avg. ▲ 8.3% Above AZ avg.AZ average: 2.8Click the badge to see the full State ranking.Click here to see the full State ranking.
Staffing Info Measures average nursing staff hours per resident per day, including Registered Nurses (RNs) and total nursing staff. Ratings are adjusted based on the level of care residents require and are compared to state and national benchmarks.
▲ 31.7% Above AZ avg. ▲ 31.7% Above AZ avg.AZ average: 3.0Click the badge to see the full State ranking.Click here to see the full State ranking.
Quality Measures Info Based on clinical and physical health indicators reported to CMS, such as hospital readmissions, falls, pressure ulcers, and improvements in mobility. These measures reflect how well residents' health needs are being managed.
▼ 11.3% Below AZ avg. ▼ 11.3% Below AZ avg.AZ average: 4.5Click the badge to see the full State ranking.Click here to see the full State ranking.

Staffing hours breakdown

Info Daily nursing hours per resident by staff type, reported to CMS. Higher is generally better — compare this facility to state and national averages to see where staffing stands.

Hours per resident per day — compared to Arizona state averages

Total nursing care / resident Info This home is ranked 2nd out of 71 homes in Arizona for nurse hours. Total adjusted nursing hours per resident per day, combining RN, LPN, and aide time. CMS adjusts this for case-mix so facilities can be fairly compared.
6h 18m per day
Rank #2 / 71Nurse hours — State benchmarkedThis home is ranked 2nd out of 71 homes in Arizona. Shows adjusted nurse hours per resident per day benchmarked to the Arizona average, with a ranking across 71 Arizona facilities. More hours mean more direct care. The national average is about 3.5 hrs; below 3.0 is a red flag.Rankings are based only on facilities in Arizona that report data for that category. Facilities without available data are excluded from the ranking.Click the rank badge to see the full State ranking.Click here to see the full State ranking.
This facility Arizona avg (4h 4m per day)
vs Arizona avg
+55%

0 of 6 metrics below state avg

Standout metric Physical Therapist is +213% above state avg
Staff typeHours / Day / Residentvs state avg
Registered Nurse (RN) Info RNs hold the highest nursing license and can assess residents, interpret test results, and direct care plans. More RN hours per day often signals stronger clinical oversight and faster response to health changes. 1h 59m per day ▲ 178% State avg: 43m per day · National avg: 41m per day
LPN / LVN Info Licensed Practical Nurses (LPNs) or Licensed Vocational Nurses (LVNs) deliver routine hands-on care — medication administration, wound dressing, and monitoring vital signs. They work under RN supervision and make up a large share of daily bedside care. 1h 2m per day ■ Avg State avg: 1h 2m per day · National avg: 52m per day
Nurse Aide Info Certified Nurse Aides (CNAs) provide the most direct day-to-day assistance: bathing, dressing, feeding, and mobility. Nurse aide hours are typically the largest staffing category and directly affect residents' quality of life. 3h 42m per day ▲ 56% State avg: 2h 22m per day · National avg: 2h 20m per day
Weekend Total Nursing Info Combined nursing hours (RN + LPN + Nurse Aide) per resident per day on weekends. Staffing often drops on weekends — this figure reveals whether the facility maintains adequate coverage outside of weekday hours. 6h 24m per day ▲ 77% State avg: 3h 37m per day · National avg: 3h 26m per day
Physical Therapist Info Hours per resident per day provided by licensed Physical Therapists (PTs) or PT Assistants. PT services help residents recover mobility after injury or illness and are especially important for post-acute (short-stay) rehabilitation. 19m per day ▲ 213% State avg: 6m per day · National avg: 4m per day
Weekend RN Info Registered nurse hours specifically on weekends. Facilities sometimes reduce RN presence on Saturdays and Sundays — a low weekend RN figure compared to weekday hours can indicate reduced clinical oversight when most administrative staff are absent. 1h 22m per day ▲ 165% State avg: 31m per day · National avg: 28m per day

Capacity and availability

Avg. Length of Stay
21 days
Bed community size
47-bed community
A moderately sized community that may balance personal attention with shared amenities and social activities.
Years in operation
4 years in operation
An established community with some operational experience and growing routines.
Walk Score
Walk Score: 91 / 100
Walker's paradise. Daily errands do not require a car, with many shops and services nearby.

About this community

Occupancy

Occupancy rate
54%
Rank #60 / 76Occupancy rate — State benchmarkedThis home is ranked 60th out of 76 homes in Arizona. Shows this facility's occupancy rate versus the Arizona average, with its Statewide rank out of 76. Higher occupancy signals strong local demand and financial stability.Rankings are based only on facilities in Arizona that report data for that category. Facilities without available data are excluded from the ranking.Click the rank badge to see the full State ranking.Click here to see the full State ranking.
Lower than the Arizona average: 72.7%
Occupied beds
25 / 47
Average occupied beds in Arizona homes 84 beds

License Details

Facility TypeAssisted Living Center
StatusActive
IssuanceJuly 14, 2021
ExpirationJuly 13, 2026 Expires in 15 days
License NumberAL11869C
QualificationHealth Care

Ownership & Operating Entity

Mirabella at ASU is administered by Scarlett Huang.

OwnerMIRABELLA AT ASU, INC.

Therapy & Rehabilitation

1 service
Rehabilitation Services

Additional Services

1 service
Memory Support

Contact Mirabella at ASU

Inspection History

In Arizona, the Department of Health Services, Bureau of Long Term Care Licensing performs regular onsite inspections and investigates complaints for all licensed residential and nursing facilities.

Since 2021 · 5 years of data 6 deficiencies 5 complaints 6 inspections
Inspection Score Info A composite 0–100 score combining this facility's inspections, deficiencies, complaints, and enforcement actions relative to the Arizona state average. The score below shows how many points this facility sits above or below the typical Arizona nursing home score (the benchmark); higher is better.

5 points above the Arizona average for nursing homes (82/100)

Rank #5 / 53 in Arizona Inspection Score — State benchmarked This home is ranked 5th out of 53 homes in Arizona. Shows this facility's inspection score compared to the Arizona average among 53 comparable communities in the ranking pool. Rankings are based only on facilities in Arizona that report data for that category. Facilities without available data are excluded from the ranking. Inspection score: 87 out of 100. Letter grade B+. 5 points above the Arizona average for nursing homes (82/100)

Inspection Scorecard Info This scorecard compares key inspection, deficiency, and complaint metrics at this facility against the Arizona state average. Metrics rated ≥15% worse than average are highlighted in red; those ≥15% better are highlighted in green.

Since 2021 vs. Arizona state average
Overall vs. AZ average 2 Worse Metrics worse than Arizona average:
• Enforcement actions (11% above)
• Total inspections (20% above)
5 Better Metrics better than Arizona average:
• Total deficiencies (33% below)
• Deficiencies per year (33% below)
• Deficiencies per inspection (44% below)
• Total complaints (17% below)
• Complaints per year (17% below)
Latest Inspection September 26, 2024 Complaint 2 deficiencies

Deficiencies Info Deficiencies are formal regulatory issues recorded during state inspections.

This FacilityAZ Averagevs. AZ Avg
Total deficiencies Info Formal regulatory issues recorded by inspectors across all inspection types. 69 This facility has 33% fewer total deficiencies than a typical Arizona nursing home (6 vs. AZ avg 9).↓ 33% better Rank #357 / 500 Total deficiencies — State benchmarked This home is ranked 357th out of 500 homes in Arizona. Shows this facility's deficiencies compared to the Arizona average among 500 comparable communities in the ranking pool. Rankings are based only on facilities in Arizona that report data for that category. Facilities without available data are excluded from the ranking.
Deficiencies per year Info Average deficiencies per year since 2021. 1.21.8 This facility has 33% fewer deficiencies per year than a typical Arizona nursing home (1.2 vs. AZ avg 1.8).↓ 33% better
Deficiencies per inspection Info Average deficiencies per inspection. 11.8 This facility has 44% fewer deficiencies per inspection than a typical Arizona nursing home (1 vs. AZ avg 1.8).↓ 44% better Rank #283 / 500 Deficiencies per inspection — State benchmarked This home is ranked 283rd out of 500 homes in Arizona. Shows this facility's deficiencies per inspection compared to the Arizona average among 500 comparable communities in the ranking pool. Rankings are based only on facilities in Arizona that report data for that category. Facilities without available data are excluded from the ranking.
Enforcement actions Info Formal penalties or interventions imposed by Arizona regulators — directed plans of correction, civil monetary penalties, denial of payment, or appointment of temporary management. 10.9 This facility has 11% more enforcement actions than a typical Arizona nursing home (1 vs. AZ avg 0.9).↑ 11% worse

Inspections Info State inspections evaluate whether the facility meets health and safety standards.

This FacilityAZ Averagevs. AZ Avg
Total inspections Info Combined count of all routine and focused inspections. Excludes complaint investigations. 65 This facility has 20% more total inspections than a typical Arizona nursing home (6 vs. AZ avg 5).↑ 20% worse

Complaints & Investigations Info Complaints are formal concerns filed by residents, families, or staff. Investigations are on-site follow-ups.

This FacilityAZ Averagevs. AZ Avg
Total complaints Info Formal expressions of concern made by residents, families, or staff. 56 This facility has 17% fewer total complaints than a typical Arizona nursing home (5 vs. AZ avg 6).↓ 17% better Rank #384 / 500 Total complaints — State benchmarked This home is ranked 384th out of 500 homes in Arizona. Shows this facility's complaint-related visits compared to the Arizona average among 500 comparable communities in the ranking pool. Rankings are based only on facilities in Arizona that report data for that category. Facilities without available data are excluded from the ranking.
Complaints per year Info Average complaints per year since 2021. 11.2 This facility has 17% fewer complaints per year than a typical Arizona nursing home (1 vs. AZ avg 1.2).↓ 17% better

Inspection Reports Summary Info An editor-reviewed summary of the themes and findings across this facility's recent inspection reports.

  • November 14, 2025 complaint investigation found failure to prevent elopement of a moderate-risk resident due to inadequate supervision and faulty exit door alarms.
  • November 29, 2023 complaint investigation cited failure to timely report and investigate abuse allegations involving three residents, with missing documentation of reports to required agencies.
  • August 31, 2023 off-site amendment inspection found no deficiencies, and the facility paid a $1,500 fine from prior enforcement actions in full.

Health Inspection History

Inspections since 2021
Total health inspections 3

Arizona average 6.3


Last Health inspection on Nov 2023

Total health citations
5 Rank #4 / 75Health citations — State benchmarkedThis home is ranked 4th out of 75 homes in Arizona. Shows this facility's total health deficiency citations benchmarked to the Arizona State average, with a ranking across all 75 AZ facilities. Lower citation counts earn a better rank.Rankings are based only on facilities in Arizona that report data for that category. Facilities without available data are excluded from the ranking.Click the rank badge to see the full State ranking.Click here to see the full State ranking.

Arizona average 23.2

Citations per inspection
1.67 Rank #2 / 75Citations per inspection — State benchmarkedThis home is ranked 2nd out of 75 homes in Arizona. Shows average deficiency citations per CMS inspection for this facility versus the Arizona mean across 75 facilities with citation data. Lower is better.Rankings are based only on facilities in Arizona that report data for that category. Facilities without available data are excluded from the ranking.Click the rank badge to see the full State ranking.Click here to see the full State ranking.

Arizona average 3.82


Health citations are formal notices following inspections when they fail to comply with safety and care standards.

4 of 5 citations resulted from standard inspections; and 1 of 5 came from combined inspections (standard and complaint).

Breakdown of citation severity (last 5 years)
Critical health citations
0
100% better than Arizona average

Arizona average: 0.1


Serious health citations
0
100% better than Arizona average

Arizona average: 0.6

0 critical citations Arizona average: 0.1

0 serious citations Arizona average: 0.6

5 moderate citations Arizona average: 22.3

0 minor citations Arizona average: 0.2
Citations history (last 5 years)
Abuse/Neglect moderate citation Nov 29, 2023
Corrected

Quality of Care moderate citation Oct 13, 2022
Corrected

Resident Rights moderate citation Oct 13, 2022
Corrected

Resident Rights moderate citation Oct 13, 2022
Corrected

Staffing Data

Reporting period: October 1 – December 31, 2025 (Q4 2025). Source: CMS Payroll-Based Journal report.

Total staff 102
Employees 37
Contractors 65
Staff to resident ratio 11.33 : 1
529% more staff per resident than Arizona average
Arizona average ratio: 1.80 : 1 Arizona average ratio: 1.80 : 1See full Arizona ranking
Avg staff/day 19
Average shift 8 hours
6% worse than Arizona average
Arizona average: 8.5 hours Arizona average shift: 8.5 hoursSee full Arizona ranking
Total staff hours (quarter) 13,913

Nursing staff breakdown

Q4 2025 · Oct 1 – Dec 31 More info This data comes from the CMS Payroll-Based Journal report covering October 1 – December 31, 2025.
Registered Nurse

Manages medical care and health needs.

RN Staff Info 16 total: 8 full-time employees and 8 contractors. 16
Average shift length Info Average shift length. Calculated as total hours divided by days worked and average staff per day. 9.9 hours
Licensed Practical Nurse

Assists with medical care and medications.

LPN Staff Info 13 total: 5 full-time employees and 8 contractors. 13
Average shift length Info Average shift length. Calculated as total hours divided by days worked and average staff per day. 10.7 hours
Certified Nursing Assistant

Helps with daily care and mobility.

CNA Staff Info 33 total: 17 full-time employees and 16 contractors. 33
Average shift length Info Average shift length. Calculated as total hours divided by days worked and average staff per day. 9.4 hours

Contractor staffing

Q4 2025 · Oct 1 – Dec 31 More info This data comes from the CMS Payroll-Based Journal report covering October 1 – December 31, 2025.

Total hours from contractors

36.8%

5,114 contractor hours this quarter

Certified Nursing Assistant: 16 Licensed Practical Nurse: 8 Registered Nurse: 8 Physical Therapy Assistant: 7 Respiratory Therapy Technician: 7 Speech Language Pathologist: 5 Physical Therapy Aide: 5 Qualified Social Worker: 4 Occupational Therapy Assistant: 1 Medical Director: 1 Clinical Nurse Specialist: 1 Occupational Therapy Aide: 1 Medication Aide/Technician: 1

Staff by category

Q4 2025 · Oct 1 – Dec 31 More info This data comes from the CMS Payroll-Based Journal report covering October 1 – December 31, 2025.
Certified Nursing Assistant1716335,96292100%9.4
Registered Nurse88162,27992100%9.9
Licensed Practical Nurse58131,6829199%10.7
Respiratory Therapy Technician0775066773%6.2
Clinical Nurse Specialist3144995661%7.4
Dental Services Staff1014595964%7.8
Other Dietary Services Staff1014565358%8.6
Speech Language Pathologist0554527076%4.6
Nurse Practitioner1014435964%7.5
Administrator1014285762%7.5
Qualified Social Worker0442575863%4.4
Physical Therapy Aide0551855155%3
Physical Therapy Assistant0771805459%2.9
Occupational Therapy Aide011502628%1.9
Medical Director011322527%1.3
Occupational Therapy Assistant011313942%0.8
Medication Aide/Technician0111211%11.8
33 Certified Nursing Assistant
% of Days 100%
16 Registered Nurse
% of Days 100%
13 Licensed Practical Nurse
% of Days 99%
7 Respiratory Therapy Technician
% of Days 73%
4 Clinical Nurse Specialist
% of Days 61%
1 Dental Services Staff
% of Days 64%
1 Other Dietary Services Staff
% of Days 58%
5 Speech Language Pathologist
% of Days 76%
1 Nurse Practitioner
% of Days 64%
1 Administrator
% of Days 62%
4 Qualified Social Worker
% of Days 63%
5 Physical Therapy Aide
% of Days 55%
7 Physical Therapy Assistant
% of Days 59%
1 Occupational Therapy Aide
% of Days 28%
1 Medical Director
% of Days 27%
1 Occupational Therapy Assistant
% of Days 42%
1 Medication Aide/Technician
% of Days 1%

Penalties and fines

Federal penalties imposed by CMS for regulatory violations, including civil money penalties (fines) and denials of payment for new Medicare/Medicaid admissions.

Source: CMS Penalties Database

No penalties in the past 3 years

No civil money penalties or payment denials were reported in the last 3 years.

Quality of care over time

These measures show how residents usually do over time at this home, based on health outcomes and preventive care.

Short-stay resident measures
Significantly above average Info CMS star rating based on short-stay quality measure performance. 5 stars = much above average, 1 star = much below average.
Pneumococcal Vaccine Info Percent of short-stay residents assessed and appropriately given the pneumococcal vaccine 88.2%
In line with Arizona average

Arizona average: 91.5%

Antipsychotic medication increase Info Percent of short-stay residents who newly received an antipsychotic medication 0.0%
100% better than Arizona average

Arizona average: 1.0%

Influenza Vaccine Info Percent of short-stay residents assessed and appropriately given the seasonal influenza vaccine 65.3%
25% worse than Arizona average

Arizona average: 87.3%

Re-hospitalized after SNF stay Info Percentage of short-stay residents who were re-hospitalized after their nursing home admission. 25.6%
In line with Arizona average

Arizona average: 24.6%

Emergency department visits Info Percentage of short-stay residents who had an outpatient emergency department visit. 11.0%
In line with Arizona average

Arizona average: 10.7%

Falls with major injury Info Percentage of SNF residents who experience falls with major injury during their stay. 4.2%
447% worse than Arizona average

Arizona average: 0.8%

Ability to care for self at discharge Info Percentage of residents at or above expected ability to care for themselves at discharge. 64.3%
20% better than Arizona average

Arizona average: 53.7%

Successful return to home or community Info Rate of successful return to home or community from a skilled nursing facility. 63.4%
25% better than Arizona average

Arizona average: 50.6%

Breakdown by payment type

Medicare

57% of new residents, usually for short-term rehab.

Typical stay 20 days

Private pay

43% of new residents, often for short stays.

Typical stay 3 - 4 months

Facility Characteristics

Source: CMS Long-Term Care Facility Characteristics (Data as of Jan 2026)

Total residents 9
Medicare
7
77.8% of residents
Private pay or other
2
22.2% of residents
Programs & Services
Residents Group

Residents meet regularly to discuss policies, care quality, and activities

CCRC

Part of a Continuing Care Retirement Community offering multiple care levels

Active Resident Council

Organized group of residents that meets regularly to discuss facility policies, quality of life, and activities.

Finances and operations

Based on CMS SNF Cost Report for fiscal year ending in 09/2023.

Nonprofit
Nonprofit Corporation
Net patient revenue Info Net patient revenue — what the home actually collects for resident care, after contractual allowances, bad debt and discounts are subtracted from its gross charges (CMS cost report, Worksheet G-3). It covers resident care only; money the home earns from other sources is shown separately as "Other income."
$2.7M
Net patient income Info Net patient income: net patient revenue minus the home's total operating expenses. A positive figure means it earns more from resident care than it spends to deliver it; a negative figure means the opposite. It excludes non-operating "other income."
-$38.5M
Nonprofit Nonprofit Corporation
Net patient revenue Info Net patient revenue — what the home actually collects for resident care, after contractual allowances, bad debt and discounts are subtracted from its gross charges (CMS cost report, Worksheet G-3). It covers resident care only; money the home earns from other sources is shown separately as "Other income."
$2.7M Rank #73 / 79Revenue — State benchmarkedThis home is ranked 73rd out of 79 homes in Arizona. Shows this facility's annual revenue compared to the Arizona average. Higher revenue generally means more resources for staffing and capital — read alongside Payroll %.Rankings are based only on facilities in Arizona that report data for that category. Facilities without available data are excluded from the ranking.Click the rank badge to see the full State ranking.Click here to see the full State ranking.
Net patient income Info Net patient income: net patient revenue minus the home's total operating expenses. A positive figure means it earns more from resident care than it spends to deliver it; a negative figure means the opposite. It excludes non-operating "other income."
-$38.5M
Other income Info Money the home earns outside of resident care — such as investments, grants, rentals and other non-operating sources (CMS cost report, Worksheet G-3). It is tracked separately from net patient revenue: it is not part of that figure, and it is not included in net patient income.
$3.6M
Payroll costs Info Staff salaries plus wage-related costs — benefits such as payroll taxes, health insurance and retirement — from the home's own accounting records (CMS cost report, Worksheet A). Contract or agency labor is counted separately, under other operating costs. Rank #17 / 79Payroll — State benchmarkedThis home is ranked 17th out of 79 homes in Arizona. Shows total annual staff payroll benchmarked to the Arizona average. Higher payroll investment relative to peers often signals better staffing and less reliance on cheaper contract labor.Rankings are based only on facilities in Arizona that report data for that category. Facilities without available data are excluded from the ranking.Click the rank badge to see the full State ranking.Click here to see the full State ranking.
$9.8M 367.8% of net patient revenue Info Payroll as a share of revenue: staff salaries and wage-related benefits divided by net patient revenue. A higher figure means more of each revenue dollar goes to staff pay. Rank #1 / 79Payroll % — State benchmarkedThis home is ranked 1st out of 79 homes in Arizona. Shows payroll as a percentage of revenue versus the Arizona average. Well-run Arizona facilities typically land around 58–71% — the top third Statewide. Below 25% may signal understaffing or heavy agency use — read with Staffing ratings.Rankings are based only on facilities in Arizona that report data for that category. Facilities without available data are excluded from the ranking.Click the rank badge to see the full State ranking.Click here to see the full State ranking.
Other operating costs Info Everything it costs to run the home apart from payroll — food, utilities, supplies, maintenance, contract labor and administration. Calculated as total operating expense minus payroll (staff salaries and wage-related benefits).
$31.4M
Total costs Info The home's total operating expense for the year — all the costs of running it, salaries included (CMS cost report, Worksheet G-3).
$41.1M

What does this home offer?

Housing options icon

Housing Options: 1 Bed / 2 Bed

Building type icon
Building type icon

Building Type: High-rise

Transportation services icon

Transportation Services

Housekeeping icon
Housekeeping icon

Housekeeping Services

Social and recreational activities icon

Social and Recreational Activities

Exercise program icon

Exercise Programs

Parking Available icon

Parking Available

Who this home usually serves

TYPE OF STAY

Mostly short-term rehab stays

Most residents typically stay for a few weeks or months before returning home or moving on.

Most new residents arrive under Medicare (57% of admissions), and a typical Medicare stay runs around 20 days.

Admissions
184 total

Coverage residents most often arrive under.

Medicare 57%
Private pay 43%
Discharges
186 total

Coverage residents most often leave under.

Medicare 57%
Private pay 43%

Managed by Tom Dorough

Executive Director

Places of interest near Mirabella at ASU

Address 0.4 miles from city center Info Estimated distance in miles from Tempe's city center to Mirabella at ASU's address, calculated via Google Maps.

Calculate Travel Distance to Mirabella at ASU

Add your location

Address

Compare Nursing Homes around Tempe

The information below is reported by the Arizona Department of Health Services, Bureau of Long Term Care Licensing.

3 facilities compared · CMS & AZ Dept. of Health data

Tempe Post Acute
NH
Tempe (Kiwanis Park)74
68.9%
Facility 68.9%
AZ AVG 72.7%
Rank #42 / 76
-5%
4.43
Facility 4.43
AZ AVG 4.06
Rank #18 / 71
-19%+9%
$0
Facility $0
AZ AVG $31.7k
Rank #1 / 75
73
Facility 73
AZ AVG 82
Rank #24 / 53
9
Facility 9
AZ AVG 23.2
Rank #10 / 75
2.3
Facility 2.3
AZ AVG 3.8
Rank #13 / 75
-51- 65 Amador Ortega
$9.5M
Facility $9.5M
AZ AVG $14.7M
Rank #61 / 79
$5.4M
Facility $5.4M
AZ AVG $6.4M
Rank #60 / 79
56.4%
Facility 56.4%
AZ AVG 48.1%
Rank #31 / 79
35106
Mirabella at ASU
NH
AL
MC
Tempe (East University Drive)47
53.9%
Facility 53.9%
AZ AVG 72.7%
Rank #60 / 76
-26%
6.30
Facility 6.30
AZ AVG 4.06
Rank #2 / 71
+57%+55%
$0
Facility $0
AZ AVG $31.7k
Rank #1 / 75
87
Facility 87
AZ AVG 82
Rank #5 / 53
5
Facility 5
AZ AVG 23.2
Rank #4 / 75
1.7
Facility 1.7
AZ AVG 3.8
Rank #2 / 75
-18- 91 -
$2.7M
Facility $2.7M
AZ AVG $14.7M
Rank #73 / 79
$9.8M
Facility $9.8M
AZ AVG $6.4M
Rank #17 / 79
367.8%
Facility 367.8%
AZ AVG 48.1%
Rank #1 / 79
35300
Friendship Village Tempe
NH
AL
IL
MC
Tempe (East Southern Avenue)128
93.9%
Facility 93.9%
AZ AVG 72.7%
Rank #10 / 76
+29%
5.36
Facility 5.36
AZ AVG 4.06
Rank #7 / 71
+192%+32%
$0
Facility $0
AZ AVG $31.7k
Rank #1 / 75
70
Facility 70
AZ AVG 82
Rank #35 / 53
26
Facility 26
AZ AVG 23.2
Rank #43 / 75
4.3
Facility 4.3
AZ AVG 3.8
Rank #47 / 75
-53A+ 28 Tempe Life Care Village Inc
$66.1M
Facility $66.1M
AZ AVG $14.7M
Rank #1 / 79
$28.8M
Facility $28.8M
AZ AVG $6.4M
Rank #1 / 79
43.6%
Facility 43.6%
AZ AVG 48.1%
Rank #61 / 79
35074

Financial Assistance for
Nursing Home in Arizona

Mirabella at ASU is located in Tempe, Arizona.
Here are the financial assistance programs available to residents in Arizona.

Get Financial aid guidance

Arizona Long Term Care System

ALTCS

Age 65+ or disabled
General Arizona resident, Medicaid-eligible, nursing home-level care need.
Income Limits (2025) ~$2,829/month 300% FBR, individual
Asset Limits $2,000 (individual), $3,000 (couple).
AZ

Covers tribal members; rural outreach.

Benefits
In-home care (6-8 hours/day) Assisted living Nursing home care Medical services Transportation (10 trips/month)

Non-Medical Home and Community Based Services

AZ DES Non-Medical HCBS

Age 60+
General Arizona resident, at risk of institutionalization.
Income Limits ~$2,000/month individual, varies
Asset Limits $10,000 individual
AZ

Limited funding; waitlists common.

Benefits
Homemaker services (3-5 hours/week) Respite care (up to 10 days/year) Adult day care (~$60/day)

Weatherization Assistance Program (WAP)

AZ WAP

Age 60+ priority
General Arizona resident, own/rent home, low-income.
Income Limits (2025) ~$2,510/month 200% of poverty level, individual
Asset Limits Not applicable; income-focused.
AZ

High demand in rural desert areas; limited annual funds.

Benefits
Insulation Weather stripping HVAC repairs (avg. $500-$1,000/year savings)

Section 202 Supportive Housing for the Elderly

AZ Section 202

Age 62+
General Arizona resident, very low income, able to live independently with support.
Income Limits (2025) ~$1,645/month 50% of area median income, individual, varies by county
Asset Limits $10,000 individual, excludes home if owned
AZ

Limited units; high demand in metro areas like Phoenix.

Benefits
Subsidized rent (30% of income, e.g., $300-$500/month) On-site services (housekeeping, transportation, ~$200/month value)

Arizona CARES Program

AZ CARES

Age
General Caregivers of Arizona residents 60+ needing help with 3+ daily activities; no caregiver age limit.
Income Limits No strict limit; cost-sharing above ~$2,500/month threshold.
Asset Limits Not applicable; need-based.
AZ

Focus on rural access; complements ALTCS respite.

Benefits
Respite care (up to 10 days/year) Counseling (4-6 sessions/year) Training (2-3 workshops/year) Supplies (~$200/year)

AZ DES Non-Medical Home and Community Based Services (HCBS)

AZ DES Non-Medical HCBS

Age 60+ or disabled
General Arizona resident, need assistance with daily activities, not eligible for Medicaid/ALTCS.
Income Limits Above Medicaid threshold but low-income ~$1,500-$2,500/month, varies by region
Asset Limits Not specified; income-driven eligibility.
AZ

Targets those ineligible for ALTCS; prioritizes rural and tribal areas.

Benefits
Homemaker services (3-5 hours/week) Personal care (limited hours) Respite care (up to 10 days/year) Transportation (~5 trips/month)

Frequently Asked Questions about Mirabella at ASU

What neighborhood is Mirabella at ASU in?

Mirabella at ASU is in the East University Drive neighborhood of Tempe.

Is Mirabella at ASU in a walkable area?

Mirabella at ASU has a walk score of 91. Walker's paradise. Daily errands do not require a car, with many shops and services nearby.

What is the license number of Mirabella at ASU?

According to AZ state health department records, Mirabella at ASU's license number is AL11869C.

When does Mirabella at ASU's license expire?

According to AZ state health department records, Mirabella at ASU's license expires on July 13, 2026.

What is the occupancy rate at Mirabella at ASU?

Mirabella at ASU's occupancy is 54%.

Does Mirabella at ASU operate as a for-profit or non-profit?

Mirabella at ASU is registered as a non-profit in AZ.

Who is the administrator of Mirabella at ASU?

Scarlett Huang is the administrator of Mirabella at ASU.

Guides for Better Senior Living

Care Cost Calculator: See Prices in Your Area

Nursing Home Data Explorer

Don’t Wait Too Long: 7 Red Flag Signs Your Parent Needs Assisted Living Now

The True Cost of Assisted Living in 2025 – And How Families Are Paying For It

Understanding Senior Living Costs: Pricing Models, Discounts & Financial Assistance