Mission at Richfield Nursing and Rehabilitation
Nursing Home, Assisted Living, Memory Care & Skilled Nursing · Richfield, UT
CMS overall rating Info CMS (the Centers for Medicare & Medicaid Services) is the federal agency that rates nursing home quality. Its Overall Rating runs from 1 to 5 stars, combining health inspections, staffing, and quality measures, with inspections weighted most heavily.

Mission at Richfield Nursing and Rehabilitation

Nursing Home, Assisted Living, Memory Care & Skilled Nursing · Richfield, UT
CMS overall rating Info CMS (the Centers for Medicare & Medicaid Services) is the federal agency that rates nursing home quality. Its Overall Rating runs from 1 to 5 stars, combining health inspections, staffing, and quality measures, with inspections weighted most heavily.
Calculator: See prices in your area
Mission at Richfield Nursing and Rehabilitation accepts Medicare, Medicaid, and private pay.

Overview of Mission at Richfield Nursing and Rehabilitation

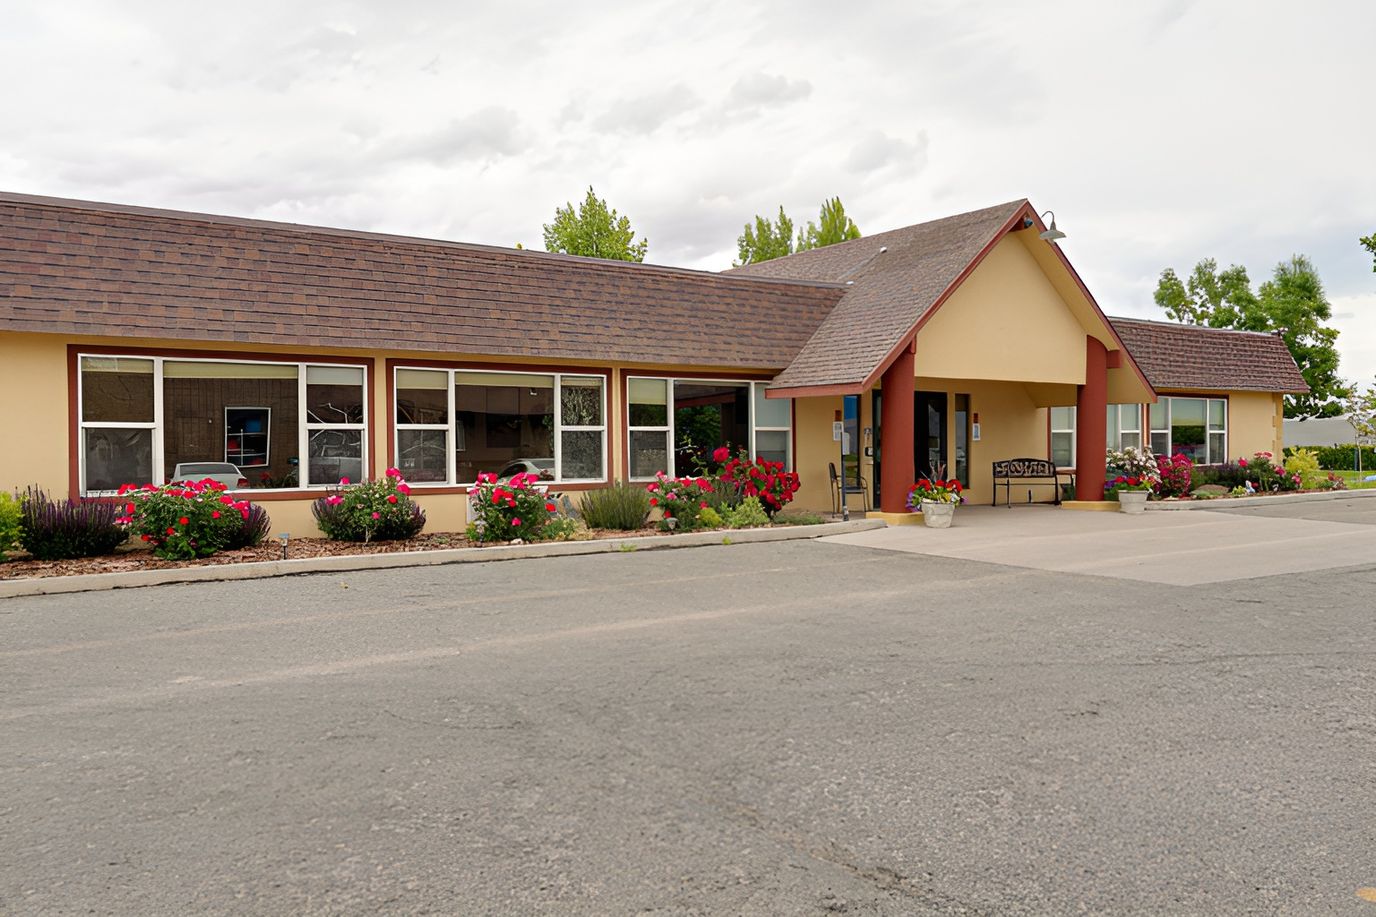
Mission at Richfield Nursing and Rehabilitation is a nursing home in North Richfield, UT, offering memory care, skilled nursing, and short-term rehabilitation. With its intimate and home-like setting, the community ensures older adults are treated well during their stay. Exceptional services, including made-to-order dining options, daily housekeeping, laundry, and transportation to medical appointments, are also provided to ease challenges in residents’ daily living. Alongside a wide range of specialized care options, the community also works closely with residents to create individualized care plans.

With a recreational therapist, therapeutic activities and light physical exercises are provided to help residents stay active and gain meaningful experiences. Cozy rooms and thoughtfully furnished amenities ensure residents can recover and rest without worries. Intermountain Health Sevier Valley Hospital and Utah Valley Regional Medical Center are also located nearby, providing easy access to healthcare. As one of the trusted options for senior living in Utah, this nursing home strives to help older adults live to their potential.

Quality ratings

Measured by Centers for Medicare & Medicaid Services (CMS)

Overall rating Info The Overall CMS Rating combines results from health inspections, staffing levels and quality measures. Health inspections carry the most weight. Staffing and quality scores can increase or decrease the final rating based on performance compared to state and national standards.
▲ 19.4% Above UT avg. ▲ 19.4% Above UT avg.UT average: 3.4Click the badge to see the full State ranking.Click here to see the full State ranking.
Health Inspection Info Based on the results of the facility's three most recent standard inspections and any complaint investigations. CMS reviews the number, scope, and severity of deficiencies, with more recent findings weighted more heavily.
▲ 43.7% Above UT avg. ▲ 43.7% Above UT avg.UT average: 2.8Click the badge to see the full State ranking.Click here to see the full State ranking.
Staffing Info Measures average nursing staff hours per resident per day, including Registered Nurses (RNs) and total nursing staff. Ratings are adjusted based on the level of care residents require and are compared to state and national benchmarks.
▼ 67.6% Below UT avg. ▼ 67.6% Below UT avg.UT average: 3.1Click the badge to see the full State ranking.Click here to see the full State ranking.
Quality Measures Info Based on clinical and physical health indicators reported to CMS, such as hospital readmissions, falls, pressure ulcers, and improvements in mobility. These measures reflect how well residents' health needs are being managed.
▲ 14.9% Above UT avg. ▲ 14.9% Above UT avg.UT average: 4.4Click the badge to see the full State ranking.Click here to see the full State ranking.

Staffing hours breakdown

Info Daily nursing hours per resident by staff type, reported to CMS. Higher is generally better — compare this facility to state and national averages to see where staffing stands.

Hours per resident per day — compared to Utah state averages

Total nursing care / resident Info This home is ranked 67th out of 80 homes in Utah for nurse hours. Total adjusted nursing hours per resident per day, combining RN, LPN, and aide time. CMS adjusts this for case-mix so facilities can be fairly compared.
3h 0m per day
Rank #67 / 80Nurse hours — State benchmarkedThis home is ranked 67th out of 80 homes in Utah. Shows adjusted nurse hours per resident per day benchmarked to the Utah average, with a ranking across 80 Utah facilities. More hours mean more direct care. The national average is about 3.5 hrs; below 3.0 is a red flag.Rankings are based only on facilities in Utah that report data for that category. Facilities without available data are excluded from the ranking.Click the rank badge to see the full State ranking.Click here to see the full State ranking.
This facility Utah avg (3h 43m per day)
vs Utah avg
-19%

6 of 6 metrics below state avg

Staff typeHours / Day / Residentvs state avg
Registered Nurse (RN) Info RNs hold the highest nursing license and can assess residents, interpret test results, and direct care plans. More RN hours per day often signals stronger clinical oversight and faster response to health changes. 59m per day ▼ 18% State avg: 1h 11m per day · National avg: 41m per day
LPN / LVN Info Licensed Practical Nurses (LPNs) or Licensed Vocational Nurses (LVNs) deliver routine hands-on care — medication administration, wound dressing, and monitoring vital signs. They work under RN supervision and make up a large share of daily bedside care. 29m per day ▼ 4% State avg: 30m per day · National avg: 52m per day
Nurse Aide Info Certified Nurse Aides (CNAs) provide the most direct day-to-day assistance: bathing, dressing, feeding, and mobility. Nurse aide hours are typically the largest staffing category and directly affect residents' quality of life. 1h 54m per day ▼ 19% State avg: 2h 22m per day · National avg: 2h 21m per day
Weekend Total Nursing Info Combined nursing hours (RN + LPN + Nurse Aide) per resident per day on weekends. Staffing often drops on weekends — this figure reveals whether the facility maintains adequate coverage outside of weekday hours. 3h 0m per day ▼ 15% State avg: 3h 31m per day · National avg: 3h 26m per day
Physical Therapist Info Hours per resident per day provided by licensed Physical Therapists (PTs) or PT Assistants. PT services help residents recover mobility after injury or illness and are especially important for post-acute (short-stay) rehabilitation. 1m per day ▼ 82% State avg: 7m per day · National avg: 4m per day
Weekend RN Info Registered nurse hours specifically on weekends. Facilities sometimes reduce RN presence on Saturdays and Sundays — a low weekend RN figure compared to weekday hours can indicate reduced clinical oversight when most administrative staff are absent. 46m per day ▼ 9% State avg: 50m per day · National avg: 29m per day

Capacity and availability

Smaller home

May offer a more intimate, personalized care environment.

Total beds 98

This home usually has availability

Lower occupancy than the Utah average: 70.1%
Occupancy rate
35.9% Rank #78 / 86Occupancy rate — State benchmarkedThis home is ranked 78th out of 86 homes in Utah. Shows this facility's occupancy rate versus the Utah average, with its Statewide rank out of 86. Higher occupancy signals strong local demand and financial stability.Rankings are based only on facilities in Utah that report data for that category. Facilities without available data are excluded from the ranking.Click the rank badge to see the full State ranking.Click here to see the full State ranking.
Avg. Length of Stay Info Average number of days residents stay at this facility, based on CMS cost report data. Shorter stays often reflect post-acute or rehab care; longer stays reflect long-term care.
115 days
Walk Score
Walk Score: 26 / 100 Rank #213 / 280Walk Score — State benchmarkedThis home is ranked 213th out of 280 homes in Utah. Shows how walkable this facility's neighborhood is compared to the average Walk Score across Utah facilities. Higher scores benefit residents, families, and staff.Rankings are based only on facilities in Utah that report data for that category. Facilities without available data are excluded from the ranking.Click the rank badge to see the full State ranking.Click here to see the full State ranking.
Somewhat walkable. A few nearby services may be reachable on foot, but most trips require transportation.

About this community

Awards

Best of State in Skilled Nursing Home, 2012, 2013, 2015, 2017, 2019, 2020, 2021

Therapy & Rehabilitation

1 service
Rehabilitation Services

Staffing & Medical

1 service
24-Hour Staffing

Additional Policies & Features

Admission CriteriaMust be ambulatory or mobile, capable of taking life saving action in an emergency, and have stable health.
HousekeepingYes
Linen ServiceYes

Amenities & Lifestyle

Housekeeping
Laundry
Private Dining
Specific ProgramsMeadow Peak Rehabilitation, Meadow Peak Assisted Living, Mission at Alpine Rehabilitation Center, Mission at Community Assisted Living, Mission at Castle Rock Rehabilitation Center, Mission at Community Rehabilitation Center, Mission at The Villa Assisted Living, Mission at West Jordan Care Center, Mission at Nephi Nursing & Rehabilitation, Mission at Richfield Nursing & Rehabilitation, Meaningful Activities

Contact Mission at Richfield Nursing and Rehabilitation

Penalties and fines

Federal penalties imposed by CMS for regulatory violations, including civil money penalties (fines) and denials of payment for new Medicare/Medicaid admissions.

Source: CMS Penalties Database

No penalties in the past 3 years

No civil money penalties or payment denials were reported in the last 3 years.

Quality of care over time

These measures show how residents usually do over time at this home, based on health outcomes and preventive care.

Long-stay resident measures
Significantly above average Info CMS star rating based on long-stay quality measure performance. 5 stars = significantly above average, 1 star = significantly below average.
Hospitalizations per 1,000 days Info Number of hospitalizations per 1,000 long-stay resident days. 0.72
39% better than Utah average

Utah average: 1.19

ED visits per 1,000 days Info Number of outpatient emergency department visits per 1,000 long-stay resident days. 2.25
50% worse than Utah average

Utah average: 1.50

Short-stay resident measures
Successful return to home or community Info Rate of successful return to home or community from a skilled nursing facility. 55.0%
9% better than Utah average

Utah average: 50.6%

Breakdown by payment type

Medicare

22% of new residents, usually for short-term rehab.

Typical stay 1 - 2 months

Private pay

53% of new residents, often for short stays.

Typical stay 1 - 2 months

Medicaid

24% of new residents, often for long-term daily care.

Typical stay 11 - 12 months

Finances and operations

Based on CMS SNF Cost Report for fiscal year ending in 06/2024.

For-profit
Corporation
Net patient revenue Info Net patient revenue — what the home actually collects for resident care, after contractual allowances, bad debt and discounts are subtracted from its gross charges (CMS cost report, Worksheet G-3). It covers resident care only; money the home earns from other sources is shown separately as "Other income."
$4.4M
Net patient income Info Net patient income: net patient revenue minus the home's total operating expenses. A positive figure means it earns more from resident care than it spends to deliver it; a negative figure means the opposite. It excludes non-operating "other income."
-$513.9K
For-profit Corporation
Net patient revenue Info Net patient revenue — what the home actually collects for resident care, after contractual allowances, bad debt and discounts are subtracted from its gross charges (CMS cost report, Worksheet G-3). It covers resident care only; money the home earns from other sources is shown separately as "Other income."
$4.4M Rank #73 / 77Revenue — State benchmarkedThis home is ranked 73rd out of 77 homes in Utah. Shows this facility's annual revenue compared to the Utah average. Higher revenue generally means more resources for staffing and capital — read alongside Payroll %.Rankings are based only on facilities in Utah that report data for that category. Facilities without available data are excluded from the ranking.Click the rank badge to see the full State ranking.Click here to see the full State ranking.
Net patient income Info Net patient income: net patient revenue minus the home's total operating expenses. A positive figure means it earns more from resident care than it spends to deliver it; a negative figure means the opposite. It excludes non-operating "other income."
-$513.9K
Other income Info Money the home earns outside of resident care — such as investments, grants, rentals and other non-operating sources (CMS cost report, Worksheet G-3). It is tracked separately from net patient revenue: it is not part of that figure, and it is not included in net patient income.
$61.3K
Payroll costs Info Staff salaries plus wage-related costs — benefits such as payroll taxes, health insurance and retirement — from the home's own accounting records (CMS cost report, Worksheet A). Contract or agency labor is counted separately, under other operating costs. Rank #66 / 77Payroll — State benchmarkedThis home is ranked 66th out of 77 homes in Utah. Shows total annual staff payroll benchmarked to the Utah average. Higher payroll investment relative to peers often signals better staffing and less reliance on cheaper contract labor.Rankings are based only on facilities in Utah that report data for that category. Facilities without available data are excluded from the ranking.Click the rank badge to see the full State ranking.Click here to see the full State ranking.
$2.1M 48.7% of net patient revenue Info Payroll as a share of revenue: staff salaries and wage-related benefits divided by net patient revenue. A higher figure means more of each revenue dollar goes to staff pay. Rank #32 / 77Payroll % — State benchmarkedThis home is ranked 32nd out of 77 homes in Utah. Shows payroll as a percentage of revenue versus the Utah average. Well-run Utah facilities typically land around 52–58% — the top third Statewide. Below 25% may signal understaffing or heavy agency use — read with Staffing ratings.Rankings are based only on facilities in Utah that report data for that category. Facilities without available data are excluded from the ranking.Click the rank badge to see the full State ranking.Click here to see the full State ranking.
Other operating costs Info Everything it costs to run the home apart from payroll — food, utilities, supplies, maintenance, contract labor and administration. Calculated as total operating expense minus payroll (staff salaries and wage-related benefits).
$2.8M
Total costs Info The home's total operating expense for the year — all the costs of running it, salaries included (CMS cost report, Worksheet G-3).
$4.9M

What does this home offer?

Housing options icon

Housing Options: Private Rooms

Building type icon
Building type icon

Building Type: Single-story

Housekeeping icon
Housekeeping icon

Housekeeping Services

Social and recreational activities icon

Social and Recreational Activities

On-site medical care and health services icon

On-site Medical Care and Health Services

Rehabilitative support icon

Rehabilitative Support

Beauty services icon

Beauty Services

Who this home usually serves

TYPE OF STAY

Mix of rehab and long-term care

This home supports both short-term rehab and long-term care, with residents staying for a wide range of durations.

Most new residents arrive under private pay (53% of admissions), and a typical private pay stay runs around 1 - 2 months.

Admissions
107 total

Coverage residents most often arrive under.

Medicare 22%
Private pay 53%
Medicaid 24%
Discharges
112 total

Coverage residents most often leave under.

Medicare 15%
Private pay 52%
Medicaid 33%

Places of interest near Mission at Richfield Nursing and Rehabilitation

Address 0.8 miles from city center Info Estimated distance in miles from Richfield's city center to Mission at Richfield Nursing and Rehabilitation's address, calculated via Google Maps.

Calculate Travel Distance to Mission at Richfield Nursing and Rehabilitation

Add your location

Address

Compare Nursing Homes around Richfield

The information below is reported by the Utah Department of Health and Human Services, Health Facility Licensing.

2 facilities compared · CMS & UT Dept. of Health data

Sandstone Richfield
NH
MC
SNF
Richfield
98
Facility 98
UT AVG 84
Rank #73 / 196
35.9%
Facility 35.9%
UT AVG 70.1%
Rank #78 / 86
-49%
3.01
Facility 3.01
UT AVG 3.72
Rank #67 / 80
-30%-19%
$8.1k
Facility $8.1k
UT AVG $52.4k
Rank #39 / 80
17
Facility 17
UT AVG 27.7
Rank #25 / 79
5.7
Facility 5.7
UT AVG 7.6
Rank #29 / 79
234-
26
Facility 26
UT AVG 47
Rank #213 / 280
Richfield Nursing & Rehab LLC
$4.4MFiscal year ending 06/2024
Facility $4.4MFiscal year ending 06/2024
UT AVG $10.3M
Rank #73 / 77
$2.1MFiscal year ending 06/2024
Facility $2.1MFiscal year ending 06/2024
UT AVG $3.8M
Rank #66 / 77
48.7%Fiscal year ending 06/2024
Facility 48.7%Fiscal year ending 06/2024
UT AVG 38%
Rank #32 / 77
465059
Mission at Community Rehab Centerfield
NH
AL
MC
SNF
Centerfield (400 South)
46
Facility 46
UT AVG 84
Rank #148 / 196
68.8%
Facility 68.8%
UT AVG 70.1%
Rank #39 / 86
-2%
3.31
Facility 3.31
UT AVG 3.72
Rank #50 / 80
-11%-11%
$6.4k
Facility $6.4k
UT AVG $52.4k
Rank #34 / 80
20
Facility 20
UT AVG 27.7
Rank #32 / 79
6.7
Facility 6.7
UT AVG 7.6
Rank #40 / 79
-38-
1
Facility 1
UT AVG 47
Rank #270 / 280
Care Transitions Inc
$4.7MFiscal year ending 06/2024
Facility $4.7MFiscal year ending 06/2024
UT AVG $10.3M
Rank #67 / 77
$0.0kFiscal year ending 06/2024
Facility $0.0kFiscal year ending 06/2024
UT AVG $3.8M
Rank #75 / 77
0%Fiscal year ending 06/2024
Facility 0%Fiscal year ending 06/2024
UT AVG 38%
Rank #71 / 77
465175

Financial Assistance for
Nursing Home in Utah

Mission at Richfield Nursing and Rehabilitation is located in Richfield, Utah.
Here are the financial assistance programs available to residents in Utah.

Get Financial aid guidance

Aging Waiver

UT Medicaid Aging Waiver

Age 65+
General Utah resident, Medicaid-eligible, nursing home-level care need.
Income Limits (2025) ~$2,829/month 300% FBR, individual
Asset Limits $2,000 (individual), $3,000 (couple).
UT

Rural challenges; waitlists possible.

Benefits
Personal care (5-7 hours/day) Respite (240 hours/year) Adult day care ($65/day) Home modifications ($1,500 avg.)

Utah Alternatives Program

UT Alternatives

Age 60+
General Utah resident, at risk of nursing home.
Income Limits ~$2,000/month individual, varies
Asset Limits $5,000 individual
UT

Limited funding; rural focus.

Benefits
In-home care (3-5 hours/week) Respite (up to 10 days/year) Transportation (~5 trips/month)

Older Americans Act (OAA) Services

Utah OAA Services

Age 60+
General UT resident; no income/asset limits.
Income Limits (2025) None; donations encouraged.
Asset Limits Not assessed.
UT

12 AAAs; includes Meals on Wheels; rural emphasis.

Benefits
Meals (~$5-$7/meal) Transportation Homemaker services (~4 hours/week) Respite (5 days/year) Legal aid

Medicare Savings Program (MSP)

Utah Medicare Savings Program

Age 65+ or disabled
General UT resident, Medicare Part A/B.
Income Limits (2025) ~$2,510/month (QMB), ~$3,380/month (SLMB), ~$3,598/month (QI)—individual.
Asset Limits $9,430 (individual), $14,130 (couple).
UT

Includes Extra Help for Part D; no waitlist.

Benefits
Covers Part B premiums ($174.70/month) Deductibles ($240/year) Copays (~20%)

Home Energy Assistance Target (HEAT) Program

Utah HEAT Program

Age 60+ prioritized
General UT resident, low-income household.
Income Limits (2025) ~$3,970/month 185% FPL
Asset Limits Not assessed.
UT

Covers gas, electric, propane; emergency aid available.

Benefits
Heating/cooling aid ($300-$1,000/season) Crisis aid ($500 max)

Utah Caregiver Support Program

Utah Family Caregiver Support Program (FCSP)

Age
General Caregivers of 60+ needing care or 55+ caregivers of others; UT resident; 2+ ADLs.
Income Limits (2025) No strict cap; prioritizes low-income ~$24,980/year
Asset Limits Not assessed.
UT

Includes grandparent caregivers; serves ~1,500 annually.

Benefits
Respite (4-6 hours/week or 5 days/year) Adult day care ($60/day) Training Supplies (~$500/year)

VA Aid and Attendance (A&A) and Housebound Benefits

Utah VA Aid and Attendance/Housebound

Age 65+ or disabled veteran/spouse
General UT resident, wartime service, ADL help (A&A) or homebound.
Income Limits (2025) Net income < ~$1,984/month (veteran with dependent, A&A); pension offsets income.
Asset Limits ~$155,356 net worth
UT

Supports rural veterans; high demand near VA centers.

Benefits
Cash (~$1,433-$2,642/month veteran, ~$951-$1,318 spouse) for care costs

Property Tax Abatement and Deferral Programs

Utah Circuit Breaker and Deferral Programs

Age 66+ (abatement) or 75+ (deferral)
General UT resident 10+ months/year, homeowner.
Income Limits (2025) ~$40,000/year (household, abatement); no limit for deferral.
Asset Limits Not assessed; home value < ~$500,000 typical.
UT

Abatement up to $1,200; deferral accrues interest (2.5%-5%).

Benefits
Tax relief (~$500-$1,200/year) or deferral (postpones payment)

Senior Farmers’ Market Nutrition Program (SFMNP)

Utah SFMNP

Age 60+
General UT resident, low-income.
Income Limits (2025) ~$2,322/month 185% FPL
Asset Limits Not assessed.
UT

Vouchers (~$50/season); serves ~5,000 via 12 AAAs.

Benefits
Vouchers (~$50/season) for produce at farmers’ markets

Frequently Asked Questions about Mission at Richfield Nursing and Rehabilitation

Is Mission at Richfield Nursing and Rehabilitation in a walkable area?

Mission at Richfield Nursing and Rehabilitation has a walk score of 26. Somewhat walkable. A few nearby services may be reachable on foot, but most trips require transportation.

What is the occupancy rate at Mission at Richfield Nursing and Rehabilitation?

Mission at Richfield Nursing and Rehabilitation's occupancy is 35.9%.

Does Mission at Richfield Nursing and Rehabilitation operate as a for-profit or non-profit?

Mission at Richfield Nursing and Rehabilitation is registered as a for-profit.

Are there photos of Mission at Richfield Nursing and Rehabilitation?

Yes — there are 41 photos of Mission at Richfield Nursing and Rehabilitation in the photo gallery on this page.

What is the address of Mission at Richfield Nursing and Rehabilitation?

Mission at Richfield Nursing and Rehabilitation is located at 163 E 1000 N, Richfield, UT 84701.

What is the phone number of Mission at Richfield Nursing and Rehabilitation?

(435) 896-8211 will put you in contact with the team at Mission at Richfield Nursing and Rehabilitation.

Is Mission at Richfield Nursing and Rehabilitation Medicare or Medicaid certified?

Mission at Richfield Nursing and Rehabilitation is not currently listed as a CMS-certified provider of Medicare or Medicaid.

Guides for Better Senior Living

Care Cost Calculator: See Prices in Your Area

Nursing Home Data Explorer

Don’t Wait Too Long: 7 Red Flag Signs Your Parent Needs Assisted Living Now

The True Cost of Assisted Living in 2025 – And How Families Are Paying For It

Understanding Senior Living Costs: Pricing Models, Discounts & Financial Assistance