Sandstone Richfield

Nursing Home · Sevier County, UT
CMS overall rating Info The Overall CMS Rating is scored from 1 to 5 stars and combines results from health inspections, staffing levels, and quality measures. Health inspections carry the most weight. Staffing and quality scores can increase or decrease the final rating based on performance compared to state and national standards.
Sandstone Richfield

Nursing Home in Sevier County

CMS overall rating Info The Overall CMS Rating is scored from 1 to 5 stars and combines results from health inspections, staffing levels, and quality measures. Health inspections carry the most weight. Staffing and quality scores can increase or decrease the final rating based on performance compared to state and national standards.
Calculator: See prices in your area
Sandstone Richfield accepts Medicare, Medicaid, and private pay.

Overview of Sandstone Richfield

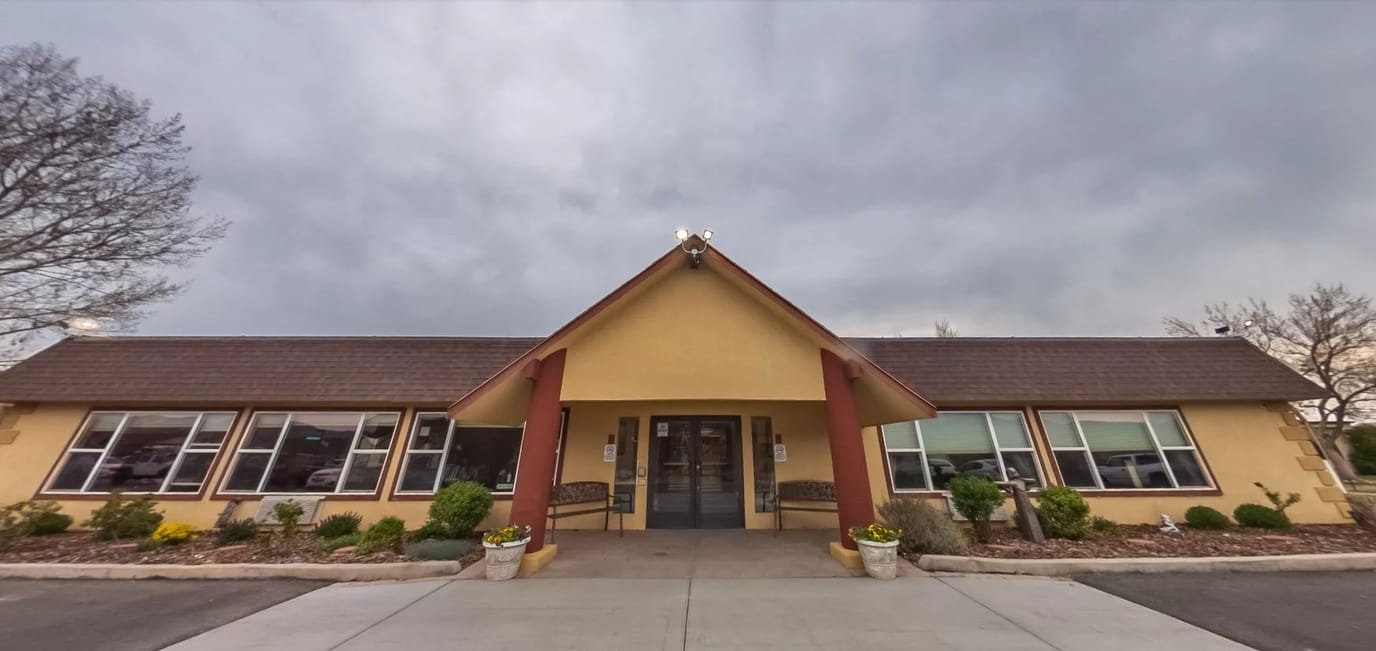
Sandstone Richfield, located in the calm city of Richfield, UT, is a skilled nursing and rehabilitation facility employing medical professional teams such as registered nurses, licensed therapists and doctors, and providing top quality care in the area. This nursing home stands out due to its unwavering commitment to individualized care, and approach that customizes services to meet the unique needs of each resident.
Widely recognized for their top-notch professionalism, Sandstone Richfield offers a comprehensive range of high-end services, including orthopedic rehab, comprehensive rehab, postoperative recovery, wound care, pain management, and more. Furthermore, their rich array of amenities and programs designed to enhance their residents overall well being, creates an environment where individuals can regain their health and thrive.

(435) 289-6101

Quality ratings

Measured by Centers for Medicare & Medicaid Services (CMS)

Overall rating Info The Overall CMS Rating combines results from health inspections, staffing levels and quality measures. Health inspections carry the most weight. Staffing and quality scores can increase or decrease the final rating based on performance compared to state and national standards.
▲ 19.4% Above UT avg.
Health Inspection Info Based on the results of the facility's three most recent standard inspections and any complaint investigations. CMS reviews the number, scope, and severity of deficiencies, with more recent findings weighted more heavily.
▲ 43.7% Above UT avg.
Staffing Info Measures average nursing staff hours per resident per day, including Registered Nurses (RNs) and total nursing staff. Ratings are adjusted based on the level of care residents require and are compared to state and national benchmarks.
▼ 67.6% Below UT avg.
Quality Measures Info Based on clinical and physical health indicators reported to CMS, such as hospital readmissions, falls, pressure ulcers, and improvements in mobility. These measures reflect how well residents' health needs are being managed.
▲ 14.9% Above UT avg.

Staffing hours breakdown

Info Daily nursing hours per resident by staff type, reported to CMS. Higher is generally better — compare this facility to state and national averages to see where staffing stands.

Hours per resident per day — compared to Utah state averages

Total nursing care / resident Info This home is ranked 48th out of 55 homes in Utah.

Total adjusted nursing hours per resident per day, combining RN, LPN, and aide time. CMS adjusts this for case-mix so facilities can be fairly compared.
3h 0m per day
Rank #48 / 55Nurse hours — state benchmarkedThis home is ranked 48th out of 55 homes in Utah.Shows adjusted nurse hours per resident per day benchmarked to the Utah average, with a ranking across 55 Utah SNFs. More hours mean more direct care. The national average is about 3.5 hrs; below 3.0 is a red flag.
This facility Utah avg (3h 43m per day)
vs Utah avg
-19%

5 of 6 metrics below state avg

Standout metric LPN / LVN is +7% above state avg
Staff typeHours / dayvs state avg
Registered Nurse (RN) Info RNs hold the highest nursing license and can assess residents, interpret test results, and direct care plans. More RN hours per day often signals stronger clinical oversight and faster response to health changes. 56m per day ▼ 21% State avg: 1h 11m per day · National avg: 41m per day
LPN / LVN Info Licensed Practical Nurses (LPNs) or Licensed Vocational Nurses (LVNs) deliver routine hands-on care — medication administration, wound dressing, and monitoring vital signs. They work under RN supervision and make up a large share of daily bedside care. 32m per day ▲ 7% State avg: 30m per day · National avg: 52m per day
Nurse Aide Info Certified Nurse Aides (CNAs) provide the most direct day-to-day assistance: bathing, dressing, feeding, and mobility. Nurse aide hours are typically the largest staffing category and directly affect residents' quality of life. 2h 15m per day ▼ 5% State avg: 2h 22m per day · National avg: 2h 21m per day
Total Nursing (Weekend) Info Combined nursing hours (RN + LPN + Nurse Aide) per resident per day on weekends. Staffing often drops on weekends — this figure reveals whether the facility maintains adequate coverage outside of weekday hours. 3h 8m per day ▼ 11% State avg: 3h 31m per day · National avg: 3h 26m per day
Physical Therapist Info Hours per resident per day provided by licensed Physical Therapists (PTs) or PT Assistants. PT services help residents recover mobility after injury or illness and are especially important for post-acute (short-stay) rehabilitation. 1m per day ▼ 86% State avg: 7m per day · National avg: 4m per day
RN (Weekend) Info Registered nurse hours specifically on weekends. Facilities sometimes reduce RN presence on Saturdays and Sundays — a low weekend RN figure compared to weekday hours can indicate reduced clinical oversight when most administrative staff are absent. 34m per day ▼ 32% State avg: 50m per day · National avg: 29m per day

Capacity and availability

This home usually has availability

Occupancy lower than 85% suggests more openings may be available.

Lower occupancy than the Utah average: 70.1%
Occupancy rate 35.9% Rank #49 / 53Occupancy rate — state benchmarkedThis home is ranked 49th out of 53 homes in Utah.Shows this facility's occupancy rate versus the Utah average, with its statewide rank out of 53. Higher occupancy signals strong local demand and financial stability.
Avg. Length of Stay 115 days
Occupancy rate
35.9% Rank #49 / 53Occupancy rate — state benchmarkedThis home is ranked 49th out of 53 homes in Utah.Shows this facility's occupancy rate versus the Utah average, with its statewide rank out of 53. Higher occupancy signals strong local demand and financial stability.
Avg. Length of Stay
115 days

Who this home usually serves

TYPE OF STAY

Mix of rehab and long-term care

This home supports both short-term rehab and long-term care, with residents staying for a wide range of durations.

Breakdown by payment type

Medicare

22% of new residents, usually for short-term rehab.

Typical stay 1 - 2 months

Private pay

53% of new residents, often for short stays.

Typical stay 1 - 2 months

Medicaid

24% of new residents, often for long-term daily care.

Typical stay 11 - 12 months

Finances and operations

Privately-owned community
Operated by a business corporation.
Home revenue
$4.5M
Operating loss
-$452.6K
Privately-owned community Operated by a business corporation.
Home revenue
$4.5M Rank #50 / 53Revenue — state benchmarkedThis home is ranked 50th out of 53 homes in Utah.Shows this facility's annual revenue compared to the Utah SNF average. Higher revenue generally means more resources for staffing and capital — read alongside Payroll %.
Operating loss
-$452.6K
Payroll costs Info The portion of the home's budget spent on staff, including nurses, caregivers, and other employees who support care and operations. Rank #48 / 53Payroll — state benchmarkedThis home is ranked 48th out of 53 homes in Utah.Shows total annual staff payroll benchmarked to the Utah average. Higher payroll investment relative to peers often signals better staffing and less reliance on cheaper contract labor.
$2.3M
51.1% of revenue Rank #25 / 52Payroll % — state benchmarkedThis home is ranked 25th out of 52 homes in Utah.Shows payroll as a percentage of revenue versus the Utah average. Well-run SNFs often land around 55–65%. Below 25% may signal understaffing or heavy agency use — read with Staffing ratings.
Other operating costs Info All remaining costs needed to run the home, such as food, utilities, building maintenance, supplies and administrative expenses.
$2.6M
Total costs $4.9M
Walk Score
Walk Score: 26 / 100 Rank #23 / 25Walk Score — state benchmarkedThis home is ranked 23rd out of 25 homes in Utah.Shows how walkable this facility's neighborhood is compared to the average Walk Score across Utah SNFs. Higher scores benefit residents, families, and staff.
Somewhat walkable. A few nearby services may be reachable on foot, but most trips require transportation.

Types of Care at Sandstone Richfield

Nursing Home

Contact Sandstone Richfield

Health Inspection History

Inspections
Total health inspections 3

Utah average 3.5


Last Health inspection on Feb 2024

Total health citations
17 Rank #18 / 54Health citations — state benchmarkedThis home is ranked 18th out of 54 homes in Utah.Shows this facility's total health deficiency citations benchmarked to the Utah state average, with a ranking across all 54 UT SNFs. Lower citation counts earn a better rank.

Utah average 27.7

Citations per inspection
5.67 Rank #23 / 54Citations per inspection — state benchmarkedThis home is ranked 23rd out of 54 homes in Utah.Shows average deficiency citations per CMS inspection for this facility versus the Utah mean across 54 SNFs with citation data. Lower is better.

Utah average 7.62


Health citations are formal notices following inspections when they fail to comply with safety and care standards.

16 of 17 citations resulted from standard inspections; and 1 of 17 came from combined inspections (standard and complaint).

Breakdown of citation severity (last 6 years)
Critical Health citations More info
0
100% better than Utah average

Utah average: 0.7


Serious Health citations More info 2
20% better than Utah average

Utah average: 2.5

0 critical citations More info Utah average: 0.7

2 serious citations More info Utah average: 2.5

15 moderate citations More info Utah average: 24.5

0 minor citations More info Utah average: 0.1
Citations history (last 6 years)
Abuse/Neglect moderate citation Info Issues related to protecting resident's from harm, including abuse, neglect, or mistreatment. Feb 07, 2024
Corrected

Infection Control moderate citation Info Issues related to preventing and controlling infections, including hygiene practices and safety protocols. Feb 07, 2024
Corrected

Quality of Care serious citation Info Issues related to how well residents receive appropriate treatment and support for their medical and daily care needs. Feb 07, 2024
Corrected

Resident Rights moderate citation Info Issues related to resident's rights, including dignity, privacy, and the ability to make decisions about their care. Jun 15, 2022
Corrected

Financial Assistance for
Nursing Home in Utah

Sandstone Richfield is located in Richfield, Utah.
Here are the financial assistance programs available to residents in Utah.

Get Financial aid guidance

Aging Waiver

UT Medicaid Aging Waiver

Age 65+
General Utah resident, Medicaid-eligible, nursing home-level care need.
Income Limits (2025) ~$2,829/month 300% FBR, individual
Asset Limits $2,000 (individual), $3,000 (couple).
UT

Rural challenges; waitlists possible.

Benefits
Personal care (5-7 hours/day) Respite (240 hours/year) Adult day care ($65/day) Home modifications ($1,500 avg.)

Utah Alternatives Program

UT Alternatives

Age 60+
General Utah resident, at risk of nursing home.
Income Limits ~$2,000/month individual, varies
Asset Limits $5,000 individual
UT

Limited funding; rural focus.

Benefits
In-home care (3-5 hours/week) Respite (up to 10 days/year) Transportation (~5 trips/month)

Older Americans Act (OAA) Services

Utah OAA Services

Age 60+
General UT resident; no income/asset limits.
Income Limits (2025) None; donations encouraged.
Asset Limits Not assessed.
UT

12 AAAs; includes Meals on Wheels; rural emphasis.

Benefits
Meals (~$5-$7/meal) Transportation Homemaker services (~4 hours/week) Respite (5 days/year) Legal aid

Medicare Savings Program (MSP)

Utah Medicare Savings Program

Age 65+ or disabled
General UT resident, Medicare Part A/B.
Income Limits (2025) ~$2,510/month (QMB), ~$3,380/month (SLMB), ~$3,598/month (QI)—individual.
Asset Limits $9,430 (individual), $14,130 (couple).
UT

Includes Extra Help for Part D; no waitlist.

Benefits
Covers Part B premiums ($174.70/month) Deductibles ($240/year) Copays (~20%)

Home Energy Assistance Target (HEAT) Program

Utah HEAT Program

Age 60+ prioritized
General UT resident, low-income household.
Income Limits (2025) ~$3,970/month 185% FPL
Asset Limits Not assessed.
UT

Covers gas, electric, propane; emergency aid available.

Benefits
Heating/cooling aid ($300-$1,000/season) Crisis aid ($500 max)

Utah Caregiver Support Program

Utah Family Caregiver Support Program (FCSP)

Age
General Caregivers of 60+ needing care or 55+ caregivers of others; UT resident; 2+ ADLs.
Income Limits (2025) No strict cap; prioritizes low-income ~$24,980/year
Asset Limits Not assessed.
UT

Includes grandparent caregivers; serves ~1,500 annually.

Benefits
Respite (4-6 hours/week or 5 days/year) Adult day care ($60/day) Training Supplies (~$500/year)

Senior Community Service Employment Program (SCSEP)

Utah SCSEP

Age 55+
General unemployed, low-income, UT resident.
Income Limits (2025) ~$1,983/month 125% FPL
Asset Limits Not specified.
UT

Priority for veterans, rural residents; AARP partnership.

Benefits
Paid training (~20 hours/week at ~$7.25/hour) Job placement

VA Aid and Attendance (A&A) and Housebound Benefits

Utah VA Aid and Attendance/Housebound

Age 65+ or disabled veteran/spouse
General UT resident, wartime service, ADL help (A&A) or homebound.
Income Limits (2025) Net income < ~$1,984/month (veteran with dependent, A&A); pension offsets income.
Asset Limits ~$155,356 net worth
UT

Supports rural veterans; high demand near VA centers.

Benefits
Cash (~$1,433-$2,642/month veteran, ~$951-$1,318 spouse) for care costs

Property Tax Abatement and Deferral Programs

Utah Circuit Breaker and Deferral Programs

Age 66+ (abatement) or 75+ (deferral)
General UT resident 10+ months/year, homeowner.
Income Limits (2025) ~$40,000/year (household, abatement); no limit for deferral.
Asset Limits Not assessed; home value < ~$500,000 typical.
UT

Abatement up to $1,200; deferral accrues interest (2.5%-5%).

Benefits
Tax relief (~$500-$1,200/year) or deferral (postpones payment)

Senior Farmers’ Market Nutrition Program (SFMNP)

Utah SFMNP

Age 60+
General UT resident, low-income.
Income Limits (2025) ~$2,322/month 185% FPL
Asset Limits Not assessed.
UT

Vouchers (~$50/season); serves ~5,000 via 12 AAAs.

Benefits
Vouchers (~$50/season) for produce at farmers’ markets

Places of interest near Sandstone Richfield

Address 42.9 miles from city center Info Estimated distance in miles from Richfield's city center to Sandstone Richfield's address, calculated via Google Maps. — 0.08 miles to nearest hospital (Richfield Clinic)

Calculate Travel Distance to Sandstone Richfield

Add your location

Address

Staffing Data (Q2 2025)

This data corresponds to Q2 2025 and is based on CMS Payroll-Based Journal.

Total staff 55
Employees 45
Contractors 10
Staff to resident ratio 1.67:1
21% worse than Utah average

Utah average ratio: 2.12:1

Avg staff/day 18
Average shift 8 hours
0% compared with Utah average

Utah average: 7.9 hours

Total staff hours (quarter) 13,146
Nursing staff breakdown
Registered Nurse

Manages medical care and health needs.

Total count 7
Average shift length Info Average shift length. Calculated as total hours divided by days worked and average staff per day. 9.9 hours

No contractors work on this role.

Licensed Practical Nurse

Assists with medical care and medications.

Total count 4
Average shift length Info Average shift length. Calculated as total hours divided by days worked and average staff per day. 7.9 hours

No contractors work on this role.

Certified Nursing Assistant

Helps with daily care and mobility.

Total count 28
Average shift length Info Average shift length. Calculated as total hours divided by days worked and average staff per day. 8.9 hours

No contractors work on this role.

Contractor staffing

Total hours from contractors

4.6%

602 contractor hours this quarter

Speech Language Pathologist: 4 Qualified Social Worker: 2 Respiratory Therapy Technician: 2 Physical Therapy Assistant: 1 Physical Therapy Aide: 1
Staff by category
Certified Nursing Assistant280286,82391100%8.9
Registered Nurse7071,6458695%9.9
Licensed Practical Nurse4041,6339099%7.9
Other Dietary Services Staff2026727178%6.3
Administrator1015126470%8
Nurse Practitioner1014966268%8
Speech Language Pathologist0444706673%7
RN Director of Nursing1014565763%8
Dental Services Staff1013085560%5.6
Physical Therapy Assistant011694246%1.6
Qualified Social Worker022333437%1
Respiratory Therapy Technician022212426%0.9
Physical Therapy Aide011944%2.2
28 Certified Nursing Assistant
% of Days 100%
7 Registered Nurse
% of Days 95%
4 Licensed Practical Nurse
% of Days 99%
2 Other Dietary Services Staff
% of Days 78%
1 Administrator
% of Days 70%
1 Nurse Practitioner
% of Days 68%
4 Speech Language Pathologist
% of Days 73%
1 RN Director of Nursing
% of Days 63%
1 Dental Services Staff
% of Days 60%
1 Physical Therapy Assistant
% of Days 46%
2 Qualified Social Worker
% of Days 37%
2 Respiratory Therapy Technician
% of Days 26%
1 Physical Therapy Aide
% of Days 4%

Facility Characteristics

Source: CMS Long-Term Care Facility Characteristics (Data as of Jan 2026)

Total residents 33
Medicare
2
6.1% of residents
Medicaid
24
72.7% of residents
Private pay or other
7
21.2% of residents
Programs & Services
Residents Group

Residents meet regularly to discuss policies, care quality, and activities

Active Resident Council

Organized group of residents that meets regularly to discuss facility policies, quality of life, and activities.

Quality of care over time

These measures show how residents usually do over time at this home, based on health outcomes and preventive care.

High-risk clinical events score Info A composite score based on pressure ulcers, falls with injury, weight loss, walking ability decline, and activities of daily living decline. 5.9
37% better than Utah average

Utah average: 9.3

Functional decline score Info A composite score based on activities of daily living decline, walking ability decline, and incontinence. 7.6
62% better than Utah average

Utah average: 20.1

Long-stay resident measures
Significantly above average Utah avg: 4.0 Info CMS star rating based on long-stay quality measure performance. 5 stars = significantly above average, 1 star = significantly below average.
Need for Help with Daily Activities Increased Info Percent of long-stay residents whose need for help with daily activities has increased 3.3%
79% better than Utah average

Utah average: 15.7%

Walking Ability Worsened Info Percent of long-stay residents whose ability to move independently worsened 12.7%
40% better than Utah average

Utah average: 21.3%

Low Risk Residents with Bowel/Bladder Incontinence Info Percent of low risk long-stay residents who lose control of their bowels or bladder 6.6%
71% better than Utah average

Utah average: 23.1%

Falls with Major Injury Info Percent of long-stay residents experiencing one or more falls with major injury 11.3%
331% worse than Utah average

Utah average: 2.6%

High Risk Residents with Pressure Ulcers Info Percent of long-stay high risk residents with pressure ulcers 0.0%
100% better than Utah average

Utah average: 4.2%

Urinary Tract Infection Info Percent of long-stay residents with a urinary tract infection 1.8%
15% better than Utah average

Utah average: 2.1%

Lost Too Much Weight Info Percent of long-stay residents who lose too much weight 2.2%
47% better than Utah average

Utah average: 4.1%

Depressive Symptoms Info Percent of long-stay residents who have depressive symptoms 17.3%
5% worse than Utah average

Utah average: 16.5%

Antipsychotic Use Info Percent of long-stay residents who received an antipsychotic medication 9.0%
33% better than Utah average

Utah average: 13.5%

Pneumococcal Vaccine Info Percent of long-stay residents assessed and appropriately given the pneumococcal vaccine 100.0%
In line with Utah average

Utah average: 97.1%

Influenza Vaccine Info Percent of long-stay residents assessed and appropriately given the seasonal influenza vaccine 100.0%
In line with Utah average

Utah average: 98.0%

Hospitalizations per 1,000 days Info Number of hospitalizations per 1,000 long-stay resident days. 0.72
39% better than Utah average

Utah average: 1.19

ED visits per 1,000 days Info Number of outpatient emergency department visits per 1,000 long-stay resident days. 2.25
50% worse than Utah average

Utah average: 1.50

Short-stay resident measures
Pneumococcal Vaccine Info Percent of short-stay residents assessed and appropriately given the pneumococcal vaccine 100.0%
8% better than Utah average

Utah average: 92.9%

Antipsychotic medication increase Info Percent of short-stay residents who newly received an antipsychotic medication 0.0%
100% better than Utah average

Utah average: 1.1%

Influenza Vaccine Info Percent of short-stay residents assessed and appropriately given the seasonal influenza vaccine 100.0%
10% better than Utah average

Utah average: 91.0%

Successful return to home or community Info Rate of successful return to home or community from a skilled nursing facility. 55.0%
9% better than Utah average

Utah average: 50.6%

Penalties and fines

Federal penalties imposed by CMS for regulatory violations, including civil money penalties (fines) and denials of payment for new Medicare/Medicaid admissions.

Source: CMS Penalties Database (Data as of Jan 2026)

Total fines amount $8K
85% lower than Utah average

Utah average: $53K

Number of fines 1
48% fewer fines than Utah average

Utah average: 1.9

Payment Denials Info Serious action where Medicare and/or Medicaid temporarily stops payments for new residents until issues are fixed. 0
100% fewer payment denials than Utah average

Utah average: 0.3

Fines amount comparison
This facility $8K
Utah average $53K
Penalty History

Penalties are imposed by CMS for violations of federal nursing home regulations.

1 penalty in the past 3 years

Feb 7, 2024 · $8K

Civil Money Penalty Info Fines imposed for noncompliance, which can be assessed per day or per instance of violation. Feb 7, 2024
$8K

Last updated: Jan 2026

Guides for Better Senior Living

Care Cost Calculator: See Prices in Your Area

Nursing Home Data Explorer

Don’t Wait Too Long: 7 Red Flag Signs Your Parent Needs Assisted Living Now

The True Cost of Assisted Living in 2025 – And How Families Are Paying For It

Understanding Senior Living Costs: Pricing Models, Discounts & Financial Assistance

Frequently Asked Questions about Sandstone Richfield

Is Sandstone Richfield in a walkable area?

Sandstone Richfield has a walk score of 26. Somewhat walkable. A few nearby services may be reachable on foot, but most trips require transportation.

What is the phone number of Sandstone Richfield?

(435) 289-6101 will put you in contact with the team at Sandstone Richfield.

Is Sandstone Richfield Medicare or Medicaid certified?

Yes — Sandstone Richfield is a CMS-certified provider of Medicare and Medicaid.

Explore Open Rooms
1 Contact details
2 What type of senior care service are you looking for?
3 What budget do you have in mind for senior care?
4 How soon do you need to find care?
5 Additional details

Thank you for your interest!

Our team will be in touch shortly to help with next steps.