


Total staff
108
Employees
86
Contractors
22
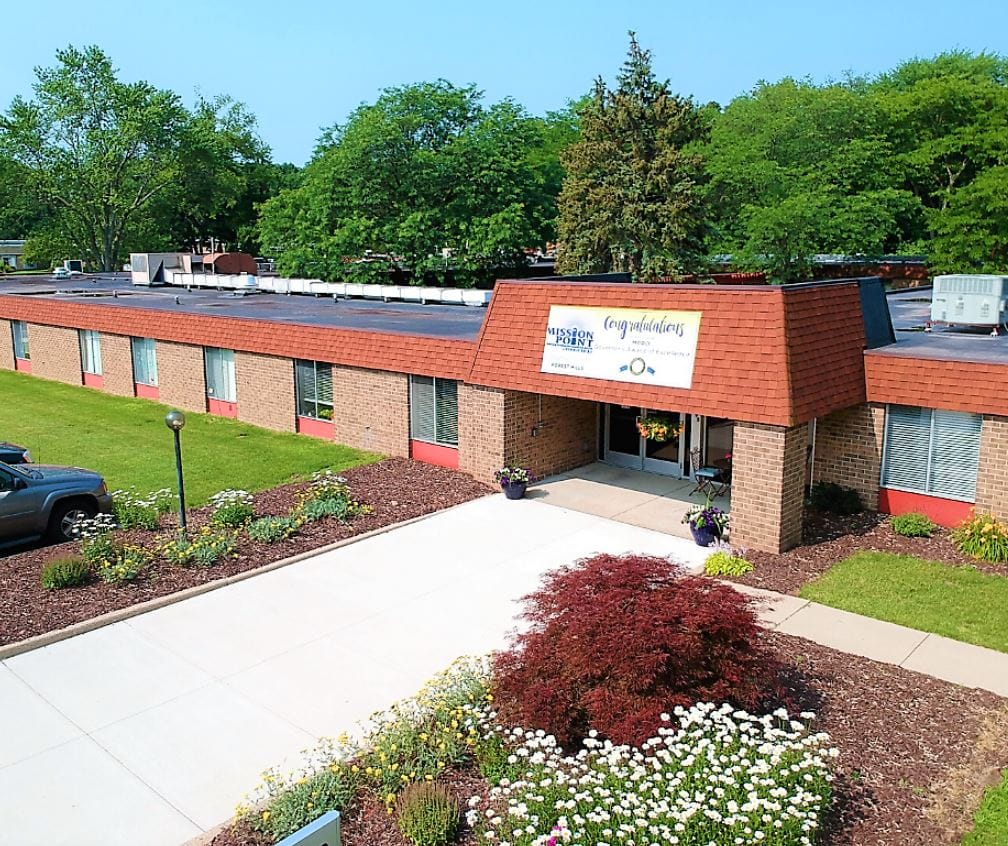
Mission Point Healthcare Services provides top of the line care that goes beyond the ordinary. Their facility boasts 58 beds. Whether one might need complex wound care therapy, short-term rehab, hospice care, long-term care, pain management, or post-operative recovery, their team of competent healthcare professionals can help seniors in all stages of recovery. Their registered dietitian, therapists, licensed practical nurses, and registered nurses work together to ensure that their residents receive personalized care that meets their varying and ever-changing needs.
They understand that being away from home can be difficult, so they’ve made sure to include a few extra amenities to make seniors’ stay more comfortable. Their internet cafe and laundry services are available to keep you connected and maintain your daily routine. They also offer private rooms with cable TV, so anyone can relax and unwind in their own space. Mission Point Healthcare Services believes that seniors deserve focus on your recovery and well-being, all while experiencing the safety and comfort of home.
| Staff type | Hours / Day / Resident | vs state avg |
|---|---|---|
|
Registered Nurse (RN)
| 39m per day | ▼ 14% State avg: 46m per day · National avg: 41m per day |
|
LPN / LVN
| 50m per day | ▼ 5% State avg: 53m per day · National avg: 52m per day |
|
Nurse Aide
| 2h 25m per day | ■ Avg State avg: 2h 23m per day · National avg: 2h 21m per day |
|
Weekend Total Nursing
| 3h 17m per day | ▼ 7% State avg: 3h 31m per day · National avg: 3h 26m per day |
|
Physical Therapist
| 1m per day | ▼ 78% State avg: 4m per day · National avg: 4m per day |
|
Weekend RN
| 22m per day | ▼ 23% State avg: 29m per day · National avg: 29m per day |
Reporting period: October 1 – December 31, 2025 (Q4 2025). Source: CMS Payroll-Based Journal report.
Manages medical care and health needs.
Assists with medical care and medications.
Helps with daily care and mobility.
Total hours from contractors
1,494 contractor hours this quarter
| Certified Nursing Assistant | 49 | 0 | 49 | 12,343 | 92 | 100% | 8.1 |
| Licensed Practical Nurse | 17 | 0 | 17 | 3,260 | 92 | 100% | 9.3 |
| Registered Nurse | 4 | 0 | 4 | 1,940 | 92 | 100% | 9.5 |
| RN Director of Nursing | 2 | 0 | 2 | 1,020 | 64 | 70% | 8.1 |
| Clinical Nurse Specialist | 6 | 2 | 8 | 891 | 63 | 68% | 7.7 |
| Speech Language Pathologist | 0 | 2 | 2 | 737 | 62 | 67% | 7.4 |
| Other Dietary Services Staff | 3 | 0 | 3 | 534 | 70 | 76% | 7.6 |
| Nurse Practitioner | 1 | 0 | 1 | 518 | 64 | 70% | 8.1 |
| Dental Services Staff | 1 | 0 | 1 | 496 | 62 | 67% | 8 |
| Administrator | 1 | 0 | 1 | 488 | 61 | 66% | 8 |
| Dietitian | 1 | 0 | 1 | 464 | 58 | 63% | 8 |
| Physical Therapy Aide | 0 | 2 | 2 | 288 | 48 | 52% | 6 |
| Occupational Therapy Aide | 1 | 1 | 2 | 224 | 28 | 30% | 8 |
| Physical Therapy Assistant | 0 | 5 | 5 | 203 | 41 | 45% | 4.7 |
| Qualified Social Worker | 0 | 4 | 4 | 87 | 37 | 40% | 2.4 |
| Respiratory Therapy Technician | 0 | 4 | 4 | 74 | 35 | 38% | 2.1 |
| Medical Director | 0 | 1 | 1 | 35 | 18 | 20% | 1.9 |
| Occupational Therapy Assistant | 0 | 1 | 1 | 25 | 27 | 29% | 0.9 |
Includes penalties issued in 2024
Federal penalties imposed by CMS for regulatory violations, including civil money penalties (fines) and denials of payment for new Medicare/Medicaid admissions.
Source: CMS Penalties Database (Data as of Jan 2026)
Michigan average: $76K
Michigan average: 2.0
Michigan average: 0.8
Penalties are imposed by CMS for violations of federal nursing home regulations.
2 penalties in the past 3 years
Multiple penalties were reported in the last 3 years.
Last updated: Jan 2026
These measures show how residents usually do over time at this home, based on health outcomes and preventive care.
Michigan average: 8.4
Michigan average: 16.3
Michigan average: 12.5%
Michigan average: 15.3%
Michigan average: 21.0%
Michigan average: 3.2%
Michigan average: 5.7%
Michigan average: 1.7%
Michigan average: 5.7%
Michigan average: 3.9%
Michigan average: 15.0%
Michigan average: 94.9%
Michigan average: 95.0%
Michigan average: 82.5%
Michigan average: 1.4%
Michigan average: 79.5%
Michigan average: 24.2%
Michigan average: 11.5%
Michigan average: 0.8%
Michigan average: 50.6%
Quality measures are calculated from Minimum Data Set (MDS) assessments. For most measures, lower percentages indicate better care quality.
11% of new residents, usually for short-term rehab.
79% of new residents, often for short stays.
10% of new residents, often for long-term daily care.
Source: CMS Long-Term Care Facility Characteristics (Data as of Jan 2026)
Residents meet regularly to discuss policies, care quality, and activities
Organized group of residents that meets regularly to discuss facility policies, quality of life, and activities.
Data sourced from CMS Long-Term Care Facility Characteristics quarterly report. Payer mix reflects the current resident census by primary payment source.
Historical financial and operational data for Mission Point of Nursing & Physical Rehabilitation Center Forest Hills from 2011–2023, based on CMS SNF Cost Reports.
Key figures below are for fiscal year ending in 12/2023.
Based on CMS SNF Cost Report for fiscal year ending in 12/2023.
Residents typically stay for brief periods, with frequent admissions and discharges throughout the year.
Most new residents arrive under private pay (79% of admissions), and a typical private pay stay runs around 1 - 2 months.
Coverage residents most often arrive under.
Coverage residents most often leave under.
![]() 6.2 miles from city center
6.2 miles from city center
![]() Estimated distance in miles from Grand Rapids's city center to Mission Point of Nursing & Physical Rehabilitation Center Forest Hills's address, calculated via Google Maps.
Estimated distance in miles from Grand Rapids's city center to Mission Point of Nursing & Physical Rehabilitation Center Forest Hills's address, calculated via Google Maps.
Add your location
The information below is reported by the Michigan Department of Licensing and Regulatory Affairs (LARA).
| Medilodge of Wyoming | NH PC SNF | Wyoming (Gezon Park) | 80
Facility
80
MI AVG
74
Rank
#177 / 431 |
95.0%
Facility
95.0%
MI AVG
73.9
Rank
#17 / 126 | +29% | 3.83
Facility
3.83
MI AVG
4.30
Rank
#94 / 140 | +50% | -11% | $0
Facility
$0
MI AVG
$87.6k
Rank
#1 / 143 | 12
Facility
12
MI AVG
33.5
Rank
#19 / 142 | 3.0
Facility
3.0
MI AVG
5.2
Rank
#16 / 142 | - | 76 | - |
41
Facility
41
MI AVG
39
Rank
#311 / 703 | - | $9.4MFiscal year ending 12/2023
Facility
$9.4MFiscal year ending 12/2023
MI AVG
$15.8M
Rank
#101 / 141 | $4.7MFiscal year ending 12/2023
Facility
$4.7MFiscal year ending 12/2023
MI AVG
$5.6M
Rank
#114 / 141 | 50.6%Fiscal year ending 12/2023
Facility
50.6%Fiscal year ending 12/2023
MI AVG
39%
Rank
#96 / 141 | 235630 | ||||
| St. Ann’s Home | NH AL HOS MC | Grand Rapids (Westside Connection) | 95
Facility
95
MI AVG
74
Rank
#145 / 431 |
24.2%
Facility
24.2%
MI AVG
73.9
Rank
#121 / 126 | -67% | 5.07
Facility
5.07
MI AVG
4.30
Rank
#20 / 140 | -10% | +18% | $0
Facility
$0
MI AVG
$87.6k
Rank
#1 / 143 | 15
Facility
15
MI AVG
33.5
Rank
#24 / 142 | 5.0
Facility
5.0
MI AVG
5.2
Rank
#71 / 142 | - | 23 | A+ |
25
Facility
25
MI AVG
39
Rank
#480 / 703 | Carmelite Sisters Of The Divine Heart Of Jesus | $8.7MFiscal year ending 12/2023
Facility
$8.7MFiscal year ending 12/2023
MI AVG
$15.8M
Rank
#117 / 141 | $6.9MFiscal year ending 12/2023
Facility
$6.9MFiscal year ending 12/2023
MI AVG
$5.6M
Rank
#70 / 141 | 78.7%Fiscal year ending 12/2023
Facility
78.7%Fiscal year ending 12/2023
MI AVG
39%
Rank
#13 / 141 | 235643 | ||||
| Covenant Living of the Great Lakes | NH AL MC RC SNF | Grand Rapids (Westside Connection) | 102
Facility
102
MI AVG
74
Rank
#117 / 431 |
28.4%
Facility
28.4%
MI AVG
73.9
Rank
#120 / 126 | -62% | 3.49
Facility
3.49
MI AVG
4.30
Rank
#125 / 140 | +51% | -19% | $0
Facility
$0
MI AVG
$87.6k
Rank
#1 / 143 | 31
Facility
31
MI AVG
33.5
Rank
#76 / 142 | 10.3
Facility
10.3
MI AVG
5.2
Rank
#140 / 142 | - | 29 | A+ |
35
Facility
35
MI AVG
39
Rank
#371 / 703 | Covenant Living Of The Great Lakes | $4.8MFiscal year ending 09/2023
Facility
$4.8MFiscal year ending 09/2023
MI AVG
$15.8M
Rank
#138 / 141 | $2.3MFiscal year ending 09/2023
Facility
$2.3MFiscal year ending 09/2023
MI AVG
$5.6M
Rank
#134 / 141 | 46.9%Fiscal year ending 09/2023
Facility
46.9%Fiscal year ending 09/2023
MI AVG
39%
Rank
#26 / 141 | 235614 | ||||
| Holland Home Raybrook Campus | NH AL IL MC SNF | Grand Rapids (Ridgemoor) | 236
Facility
236
MI AVG
74
Rank
#3 / 431 |
22.5%
Facility
22.5%
MI AVG
73.9
Rank
#123 / 126 | -70% | 5.02
Facility
5.02
MI AVG
4.30
Rank
#24 / 140 | -16% | +17% | $0
Facility
$0
MI AVG
$87.6k
Rank
#1 / 143 | 21
Facility
21
MI AVG
33.5
Rank
#47 / 142 | 5.3
Facility
5.3
MI AVG
5.2
Rank
#80 / 142 | 1 | 53 | - |
41
Facility
41
MI AVG
39
Rank
#311 / 703 | Christian Living Services | $24.0MFiscal year ending 12/2023
Facility
$24.0MFiscal year ending 12/2023
MI AVG
$15.8M
Rank
#23 / 141 | $14.2MFiscal year ending 12/2023
Facility
$14.2MFiscal year ending 12/2023
MI AVG
$5.6M
Rank
#13 / 141 | 59.1%Fiscal year ending 12/2023
Facility
59.1%Fiscal year ending 12/2023
MI AVG
39%
Rank
#35 / 141 | 235440 | ||||
| Mission Point of Nursing & Physical Rehabilitation Center Forest Hills | NH AL HOS | Grand Rapids (Eastmont) | 58
Facility
58
MI AVG
74
Rank
#247 / 431 |
95.5%
Facility
95.5%
MI AVG
73.9
Rank
#13 / 126 | +29% | 4.16
Facility
4.16
MI AVG
4.30
Rank
#55 / 140 | -64% | -3% | $55.2k
Facility
$55.2k
MI AVG
$87.6k
Rank
#113 / 143 | 50
Facility
50
MI AVG
33.5
Rank
#113 / 142 | 10.0
Facility
10.0
MI AVG
5.2
Rank
#138 / 142 | 4 | 55 | - |
43
Facility
43
MI AVG
39
Rank
#289 / 703 | Andrew Bilbao | $6.1MFiscal year ending 12/2023
Facility
$6.1MFiscal year ending 12/2023
MI AVG
$15.8M
Rank
#119 / 141 | $4.1MFiscal year ending 12/2023
Facility
$4.1MFiscal year ending 12/2023
MI AVG
$5.6M
Rank
#121 / 141 | 67.9%Fiscal year ending 12/2023
Facility
67.9%Fiscal year ending 12/2023
MI AVG
39%
Rank
#83 / 141 | 235366 |
Mission Point of Nursing & Physical Rehabilitation Center Forest Hills is located in Grand Rapids, Michigan.
Here are the financial assistance programs available to residents in Michigan.
Mission Point of Nursing & Physical Rehabilitation Center Forest Hills is in the Eastmont neighborhood.
Mission Point of Nursing & Physical Rehabilitation Center Forest Hills has a walk score of 43. Somewhat walkable. A few nearby services may be reachable on foot, but most trips require transportation.
Mission Point of Nursing & Physical Rehabilitation Center Forest Hills's occupancy is 94.6%.
Mission Point of Nursing & Physical Rehabilitation Center Forest Hills is registered as a for-profit.
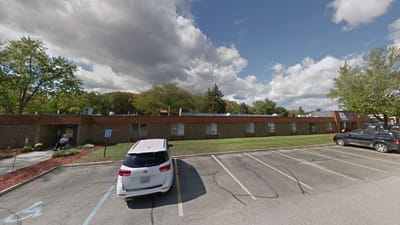
Yes — there are 2 photos of Mission Point of Nursing & Physical Rehabilitation Center Forest Hills in the photo gallery on this page.
Mission Point of Nursing & Physical Rehabilitation Center Forest Hills is located at 1095 Medical Park Dr Se, Grand Rapids, MI 49546.
(313) 372-4065 will put you in contact with the team at Mission Point of Nursing & Physical Rehabilitation Center Forest Hills.
Care Cost Calculator: See Prices in Your Area
Nursing Home Data Explorer
Don’t Wait Too Long: 7 Red Flag Signs Your Parent Needs Assisted Living Now
The True Cost of Assisted Living in 2025 – And How Families Are Paying For It
Understanding Senior Living Costs: Pricing Models, Discounts & Financial Assistance


