


Total staff
70
Employees
59
Contractors
11
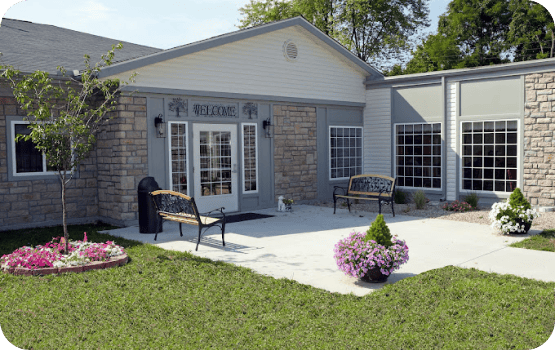
Serving older adults in Sidney, Ohio, Momentous Health at Sidney is a skilled nursing community with 51 beds located on Buckeye Avenue. Owned by Gary Mitrisin, it specializes in short-term rehabilitation and recovery following surgery, illness, or injury, with residents staying an average of 52 days. The community accepts Medicare, Medicaid, and private pay, and is situated in a somewhat walkable neighborhood.
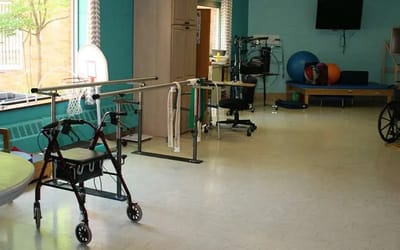
Clinical care includes an on-site physician, rehabilitation and respite services, and approximately three hours of daily nursing care provided by registered nurses, licensed practical nurses, and certified nursing assistants.
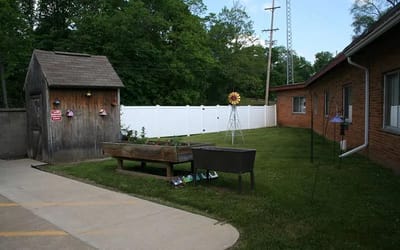
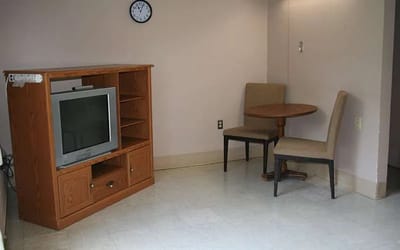
To support overall well-being, older adults can participate in gardening, art programs, and community celebrations. A beauty salon, outdoor recreation areas, comfortable gathering spaces, and nutritious shared meals further encourage an active and engaging daily routine.
| Staff type | Hours / Day / Resident | vs state avg |
|---|---|---|
|
Registered Nurse (RN)
| 27m per day | ▼ 28% State avg: 38m per day · National avg: 41m per day |
|
LPN / LVN
| 1h 0m per day | ▲ 4% State avg: 58m per day · National avg: 52m per day |
|
Nurse Aide
| 1h 58m per day | ▼ 8% State avg: 2h 8m per day · National avg: 2h 21m per day |
|
Weekend Total Nursing
| 3h 8m per day | ▼ 4% State avg: 3h 17m per day · National avg: 3h 26m per day |
|
Physical Therapist
| 1m per day | ▼ 81% State avg: 3m per day · National avg: 4m per day |
|
Weekend RN
| 22m per day | ▼ 12% State avg: 25m per day · National avg: 29m per day |
Reporting period: October 1 – December 31, 2025 (Q4 2025). Source: CMS Payroll-Based Journal report.
Manages medical care and health needs.
Assists with medical care and medications.
Helps with daily care and mobility.
Total hours from contractors
898 contractor hours this quarter
| Certified Nursing Assistant | 27 | 0 | 27 | 7,258 | 92 | 100% | 8.9 |
| Licensed Practical Nurse | 14 | 0 | 14 | 3,266 | 92 | 100% | 8.8 |
| Registered Nurse | 6 | 0 | 6 | 1,243 | 78 | 85% | 8.6 |
| Other Dietary Services Staff | 6 | 0 | 6 | 549 | 88 | 96% | 5 |
| Administrator | 1 | 0 | 1 | 512 | 64 | 70% | 8 |
| Nurse Practitioner | 1 | 0 | 1 | 448 | 56 | 61% | 8 |
| RN Director of Nursing | 1 | 0 | 1 | 447 | 63 | 68% | 7.1 |
| Dietitian | 2 | 0 | 2 | 415 | 58 | 63% | 6.8 |
| Speech Language Pathologist | 0 | 1 | 1 | 411 | 64 | 70% | 6.4 |
| Physical Therapy Aide | 0 | 2 | 2 | 367 | 61 | 66% | 6 |
| Qualified Social Worker | 0 | 3 | 3 | 46 | 42 | 46% | 1.1 |
| Physical Therapy Assistant | 0 | 2 | 2 | 40 | 29 | 32% | 1.2 |
| Respiratory Therapy Technician | 0 | 3 | 3 | 35 | 29 | 32% | 1.2 |
| Nurse Aide in Training | 1 | 0 | 1 | 7 | 2 | 2% | 3.7 |
Federal penalties imposed by CMS for regulatory violations, including civil money penalties (fines) and denials of payment for new Medicare/Medicaid admissions.
Source: CMS Penalties Database
No penalties in the past 3 years
No civil money penalties or payment denials were reported in the last 3 years.
These measures show how residents usually do over time at this home, based on health outcomes and preventive care.
Ohio average: 5.8
Ohio average: 12.7
Ohio average: 6.8%
Ohio average: 8.9%
Ohio average: 22.0%
Ohio average: 3.4%
Ohio average: 3.9%
Ohio average: 0.5%
Ohio average: 6.2%
Ohio average: 24.0%
Ohio average: 8.4%
Ohio average: 92.4%
Ohio average: 94.5%
Ohio average: 1.77
Ohio average: 1.83
Ohio average: 78.0%
Ohio average: 1.3%
Ohio average: 75.6%
Quality measures are calculated from Minimum Data Set (MDS) assessments. For most measures, lower percentages indicate better care quality.
8% of new residents, usually for short-term rehab.
57% of new residents, often for short stays.
35% of new residents, often for long-term daily care.
Source: CMS Long-Term Care Facility Characteristics (Data as of Jan 2026)
Residents meet regularly to discuss policies, care quality, and activities
Organized group of residents that meets regularly to discuss facility policies, quality of life, and activities.
Data sourced from CMS Long-Term Care Facility Characteristics quarterly report. Payer mix reflects the current resident census by primary payment source.
Historical financial and operational data for Momentous Health at Sidney from 2011–2023, based on CMS SNF Cost Reports.
Key figures below are for fiscal year ending in 12/2023.
Based on CMS SNF Cost Report for fiscal year ending in 12/2023.
This home supports both short-term rehab and long-term care, with residents staying for a wide range of durations.
Most new residents arrive under private pay (57% of admissions), and a typical private pay stay runs around 22 days.
Coverage residents most often arrive under.
Coverage residents most often leave under.
![]() 0.8 miles from city center
0.8 miles from city center
![]() Estimated distance in miles from Sidney's city center to Momentous Health at Sidney's address, calculated via Google Maps.
Estimated distance in miles from Sidney's city center to Momentous Health at Sidney's address, calculated via Google Maps.
Add your location
The information below is reported by the Ohio Department of Health, Bureau of Survey and Certification.
| Brookdale Westlake Village | NH AL IL MC SNF | Westlake | 60
Facility
60
OH AVG
75
Rank
#177 / 309 |
96.7%
Facility
96.7%
OH AVG
81.7
Rank
#4 / 138 | +18% | 4.38
Facility
4.38
OH AVG
3.54
Rank
#25 / 199 | +18% | +24% | $0
Facility
$0
OH AVG
$74.0k
Rank
#1 / 200 | 5
Facility
5
OH AVG
30.9
Rank
#10 / 199 | 1.3
Facility
1.3
OH AVG
4.6
Rank
#2 / 199 | - | 58 | A+ |
25
Facility
25
OH AVG
40
Rank
#500 / 704 | Labeed Diab | $20.1MFiscal year ending 12/2023
Facility
$20.1MFiscal year ending 12/2023
OH AVG
$10.1M
Rank
#74 / 199 | $10.2MFiscal year ending 12/2023
Facility
$10.2MFiscal year ending 12/2023
OH AVG
$3.9M
Rank
#14 / 199 | 50.8%Fiscal year ending 12/2023
Facility
50.8%Fiscal year ending 12/2023
OH AVG
40.2%
Rank
#6 / 199 | 366373 | ||||
| The Knolls of Oxford | NH AL IL MC SNF | Oxford | 50
Facility
50
OH AVG
75
Rank
#214 / 309 |
92.8%
Facility
92.8%
OH AVG
81.7
Rank
#25 / 138 | +14% | 4.09
Facility
4.09
OH AVG
3.54
Rank
#42 / 199 | -31% | +15% | $0
Facility
$0
OH AVG
$74.0k
Rank
#1 / 200 | 4
Facility
4
OH AVG
30.9
Rank
#4 / 199 | 2.0
Facility
2.0
OH AVG
4.6
Rank
#11 / 199 | - | 46 | - |
0
Facility
0
OH AVG
40
Rank
#686 / 704 | Ronald Beymer | $6.2MFiscal year ending 12/2023
Facility
$6.2MFiscal year ending 12/2023
OH AVG
$10.1M
Rank
#157 / 199 | $4.3MFiscal year ending 12/2023
Facility
$4.3MFiscal year ending 12/2023
OH AVG
$3.9M
Rank
#130 / 199 | 69.5%Fiscal year ending 12/2023
Facility
69.5%Fiscal year ending 12/2023
OH AVG
40.2%
Rank
#22 / 199 | 366282 | ||||
| Elizabeth Scott Community | NH AL MC SNF | Maumee | 60
Facility
60
OH AVG
75
Rank
#177 / 309 |
86.7%
Facility
86.7%
OH AVG
81.7
Rank
#68 / 138 | +6% | 3.52
Facility
3.52
OH AVG
3.54
Rank
#95 / 199 | -64% | -1% | $0
Facility
$0
OH AVG
$74.0k
Rank
#1 / 200 | 9
Facility
9
OH AVG
30.9
Rank
#22 / 199 | 2.3
Facility
2.3
OH AVG
4.6
Rank
#17 / 199 | - | 52 | A+ |
0
Facility
0
OH AVG
40
Rank
#686 / 704 | Elizabeth Scott, Inc | $6.7MFiscal year ending 12/2023
Facility
$6.7MFiscal year ending 12/2023
OH AVG
$10.1M
Rank
#140 / 199 | $3.2MFiscal year ending 12/2023
Facility
$3.2MFiscal year ending 12/2023
OH AVG
$3.9M
Rank
#129 / 199 | 48%Fiscal year ending 12/2023
Facility
48%Fiscal year ending 12/2023
OH AVG
40.2%
Rank
#58 / 199 | 366184 | ||||
| Locust Ridge | NH MC RC SNF | Williamsburg | 61
Facility
61
OH AVG
75
Rank
#174 / 309 |
90.2%
Facility
90.2%
OH AVG
81.7
Rank
#42 / 138 | +10% | 4.46
Facility
4.46
OH AVG
3.54
Rank
#21 / 199 | +35% | +26% | $0
Facility
$0
OH AVG
$74.0k
Rank
#1 / 200 | 18
Facility
18
OH AVG
30.9
Rank
#51 / 199 | 4.5
Facility
4.5
OH AVG
4.6
Rank
#117 / 199 | - | 55 | A+ |
0
Facility
0
OH AVG
40
Rank
#686 / 704 | Gary Vannostrand | $5.9MFiscal year ending 12/2023
Facility
$5.9MFiscal year ending 12/2023
OH AVG
$10.1M
Rank
#168 / 199 | $2.7MFiscal year ending 12/2023
Facility
$2.7MFiscal year ending 12/2023
OH AVG
$3.9M
Rank
#161 / 199 | 45.2%Fiscal year ending 12/2023
Facility
45.2%Fiscal year ending 12/2023
OH AVG
40.2%
Rank
#40 / 199 | 365336 | ||||
| Momentous Health at Sidney | NH AL MC RC SNF | Sidney (Buckeye Terrace) | 51
Facility
51
OH AVG
75
Rank
#213 / 309 |
79.0%
Facility
79.0%
OH AVG
81.7
Rank
#98 / 138 | -3% | 3.00
Facility
3.00
OH AVG
3.54
Rank
#168 / 199 | -7% | -15% | $0
Facility
$0
OH AVG
$74.0k
Rank
#1 / 200 | 23
Facility
23
OH AVG
30.9
Rank
#82 / 199 | 3.8
Facility
3.8
OH AVG
4.6
Rank
#81 / 199 | - | 40 | - |
42
Facility
42
OH AVG
40
Rank
#348 / 704 | Gary Mitrisin | $4.4MFiscal year ending 12/2023
Facility
$4.4MFiscal year ending 12/2023
OH AVG
$10.1M
Rank
#165 / 199 | $2.6MFiscal year ending 12/2023
Facility
$2.6MFiscal year ending 12/2023
OH AVG
$3.9M
Rank
#191 / 199 | 59.3%Fiscal year ending 12/2023
Facility
59.3%Fiscal year ending 12/2023
OH AVG
40.2%
Rank
#184 / 199 | 366033 |
Momentous Health at Sidney is in the Buckeye Terrace neighborhood.
Momentous Health at Sidney has a walk score of 42. Somewhat walkable. A few nearby services may be reachable on foot, but most trips require transportation.
Momentous Health at Sidney's occupancy is 86.2%.
No, Momentous Health at Sidney has a no-pet policy.
Momentous Health at Sidney is registered as a for-profit.
Yes — there are 6 photos of Momentous Health at Sidney in the photo gallery on this page.
Momentous Health at Sidney is located at 510 Buckeye Ave, Sidney, OH 45365.
Care Cost Calculator: See Prices in Your Area
Nursing Home Data Explorer
Don’t Wait Too Long: 7 Red Flag Signs Your Parent Needs Assisted Living Now
The True Cost of Assisted Living in 2025 – And How Families Are Paying For It
Understanding Senior Living Costs: Pricing Models, Discounts & Financial Assistance


