Mulberry Creek Assisted Living
Nursing Home · Virginia, VA
CMS overall rating Info The Overall CMS Rating is scored from 1 to 5 stars and combines results from health inspections, staffing levels, and quality measures. Health inspections carry the most weight. Staffing and quality scores can increase or decrease the final rating based on performance compared to state and national standards.

Mulberry Creek Assisted Living

Nursing Home · Virginia, VA
CMS overall rating Info The Overall CMS Rating is scored from 1 to 5 stars and combines results from health inspections, staffing levels, and quality measures. Health inspections carry the most weight. Staffing and quality scores can increase or decrease the final rating based on performance compared to state and national standards.
Calculator: See prices in your area
Mulberry Creek Assisted Living accepts Medicare, Medicaid, and private pay.

Overview of Mulberry Creek Assisted Living

Mulberry Creek Assisted Living is located in Martinsville, Virginia. It offers assisted living services for those who need help with day-to-day activities. The facility provides a peaceful community with various amenities and activities to support residents' independence and quality of life.
(540) 309-5982

Quality ratings

Measured by Centers for Medicare & Medicaid Services (CMS)

Overall rating Info The Overall CMS Rating combines results from health inspections, staffing levels and quality measures. Health inspections carry the most weight. Staffing and quality scores can increase or decrease the final rating based on performance compared to state and national standards.
▲ 4.7% Above VA avg. ▲ 4.7% Above VA avg.Click the badge to see the full State ranking.Click here to see the full State ranking.
Health Inspection Info Based on the results of the facility's three most recent standard inspections and any complaint investigations. CMS reviews the number, scope, and severity of deficiencies, with more recent findings weighted more heavily.
▲ 19.4% Above VA avg. ▲ 19.4% Above VA avg.Click the badge to see the full State ranking.Click here to see the full State ranking.
Staffing Info Measures average nursing staff hours per resident per day, including Registered Nurses (RNs) and total nursing staff. Ratings are adjusted based on the level of care residents require and are compared to state and national benchmarks.
▼ 44.6% Below VA avg. ▼ 44.6% Below VA avg.Click the badge to see the full State ranking.Click here to see the full State ranking.
Quality Measures Info Based on clinical and physical health indicators reported to CMS, such as hospital readmissions, falls, pressure ulcers, and improvements in mobility. These measures reflect how well residents' health needs are being managed.
▼ 50.0% Below VA avg. ▼ 50.0% Below VA avg.Click the badge to see the full State ranking.Click here to see the full State ranking.

Staffing hours breakdown

Info Daily nursing hours per resident by staff type, reported to CMS. Higher is generally better — compare this facility to state and national averages to see where staffing stands.

Hours per resident per day — compared to Virginia state averages

Total nursing care / resident Info Total adjusted nursing hours per resident per day, combining RN, LPN, and aide time. CMS adjusts this for case-mix so facilities can be fairly compared.
3h 26m per day
This facility Virginia avg (4h 47m per day)
vs Virginia avg
-28%
Staff typeHours / Day / Residentvs state avg
Total Nursing (Weekend) Info Combined nursing hours (RN + LPN + Nurse Aide) per resident per day on weekends. Staffing often drops on weekends — this figure reveals whether the facility maintains adequate coverage outside of weekday hours. 3h 13m per day

Capacity and availability

This home usually has availability

Occupancy lower than 85% suggests more openings may be available.

Lower occupancy than the Virginia average: 85.7%
Occupancy rate 56.9%
Avg. Length of Stay 237 days
Occupancy rate
56.9%
Avg. Length of Stay
237 days

Who this home usually serves

TYPE OF STAY

Mostly short-term rehab stays

Most residents typically stay for a few weeks or months before returning home or moving on.

Breakdown by payment type

Medicare

35% of new residents, usually for short-term rehab.

Typical stay 1 - 2 months

Private pay

34% of new residents, often for short stays.

Typical stay 3 - 4 months

Medicaid

31% of new residents, often for long-term daily care.

Typical stay 1 - 2 years

Finances and operations

Voluntary non-profit community
Home revenue
$22.3M
Operating deficit
-$214.4K
Voluntary non-profit community
Home revenue
$22.3M
Operating deficit
-$214.4K
Payroll costs Info The portion of the home's budget spent on staff, including nurses, caregivers, and other employees who support care and operations.
$11.5M
51.5% of revenue
Other operating costs Info All remaining costs needed to run the home, such as food, utilities, building maintenance, supplies and administrative expenses.
$11.0M
Total costs $22.5M
Bed community size
60-bed community
A moderately sized community that may balance personal attention with shared amenities and social activities.
Walk Score
Walk Score: 60 / 100
Moderately walkable. Some errands can be accomplished on foot, with a mix of nearby amenities.

About this community

License Details

Facility TypeAssisted Living Facility
StatusActive
ExpirationMay 30, 2026

Ownership & Operating Entity

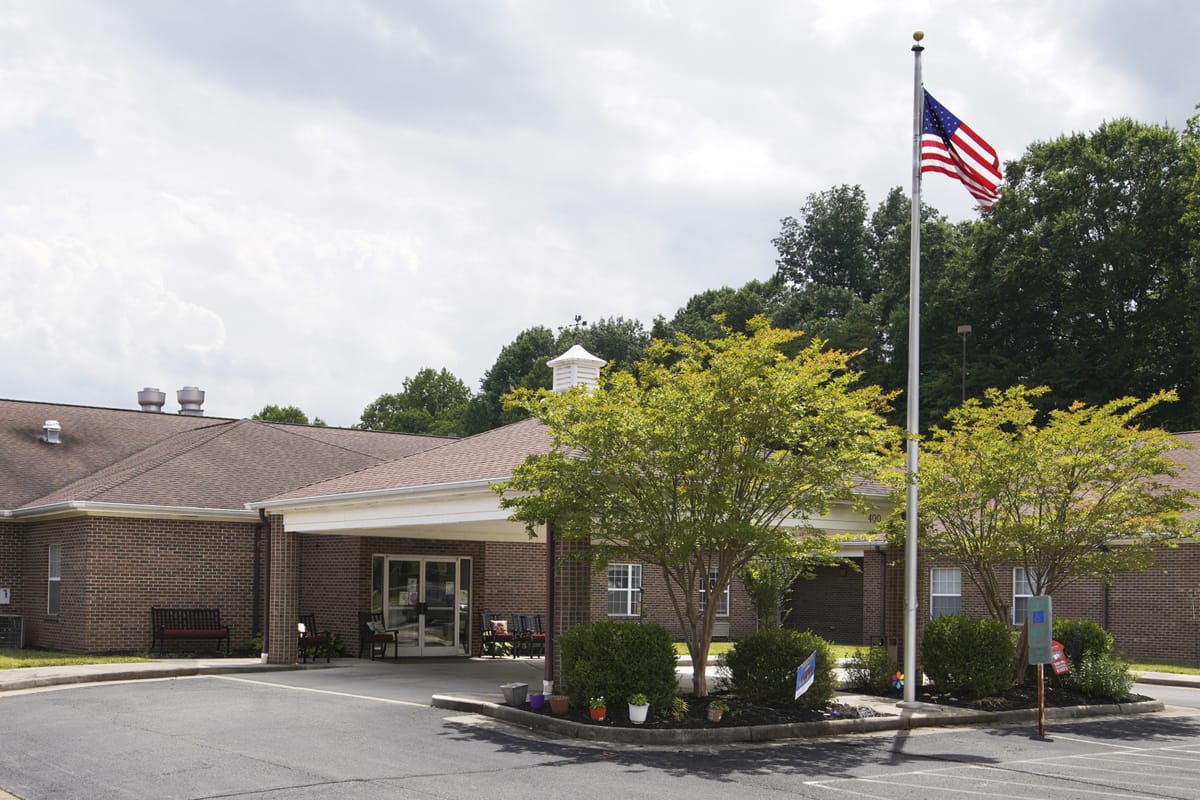
Mulberry Creek Assisted Living is administrated by Kailey Joyce.

Therapy & Rehabilitation

2 services
Rehabilitation Services
Respite Care

Amenities & Lifestyle

Transportation Services
Wifi
Beauty & Barbershop Services
Laundry & Housekeeping Services
Dietary & Nutritional Management
ActivitiesResidents enjoy a full complement of social and recreational activities designed to keep hands nimble, bodies moving, minds active and spirits up.
Operating HoursVisiting hours: 8:00 AM-8:00 PM

Dining & Nutrition

Food DescriptionThe Dietary team follows each resident’s care plan to provide nutritious meals, snacks, and refreshments.

Contact Mulberry Creek Assisted Living

Inspection History

In Virginia, the Department of Social Services (for assisted living facilities) and the Department of Health (for nursing homes) perform the inspections required to maintain state and federal licensing.

Since 2023 · 3 years of data 4 complaints 11 inspections

Inspection Scorecard Info This scorecard compares key inspection, citation, and complaint metrics at this facility against the Virginia state average. Metrics rated ≥15% worse than average are highlighted in red; those ≥15% better are highlighted in green.

Since 2023 vs. Virginia state average

Inspections Info State inspections evaluate whether the facility meets health and safety standards.

MetricThis FacilityVA Averagevs. VA Avg
Total inspections Info Combined count of all routine and focused inspections. Excludes complaint investigations. 1114 This facility has 21% fewer total inspections than a typical Virginia nursing home (11 vs. VA avg 14). Click this badge to view the full Virginia ranking.↓ 21% better
Inspections with violations Info Inspections that uncovered at least one regulatory violation. 59 This facility has 44% fewer inspections with violations than a typical Virginia nursing home (5 vs. VA avg 9). Click this badge to view the full Virginia ranking.↓ 44% better
Inspection violation rate Info Percentage of inspections that resulted in at least one violation. 45%64% This facility has 19 percentage points lower inspection violation rate than a typical Virginia nursing home (45% vs. VA avg 64%). Click this badge to view the full Virginia ranking.↓ 19% better

Complaints & Investigations Info Complaints are formal concerns filed by residents, families, or staff. Investigations are on-site follow-ups.

MetricThis FacilityVA Averagevs. VA Avg
Total complaints Info Formal expressions of concern made by residents, families, or staff. 47 This facility has 43% fewer total complaints than a typical Virginia nursing home (4 vs. VA avg 7). Click this badge to view the full Virginia ranking.↓ 43% better
Complaints per year Info Average complaints per year since 2023. 1.32.3 This facility has 43% fewer complaints per year than a typical Virginia nursing home (1.3 vs. VA avg 2.3). Click this badge to view the full Virginia ranking.↓ 43% better

Read the full inspection reports for this facility, including detailed findings and corrective actions.

Show Inspection Reports

Health Inspection History

Inspections Since 2020
Total health inspections 6

Virginia average 4.2


Last Health inspection on Nov 2024

Total health citations
14

Virginia average 38.4

Citations per inspection
2.33

Virginia average 8.93


Health citations are formal notices following inspections when they fail to comply with safety and care standards.

9 of 14 citations resulted from standard inspections; and 5 of 14 resulted from complaint investigations.

Breakdown of citation severity (last 6 years)
Critical Health citations
0
100% better than Virginia average

Virginia average: 0.4


Serious Health citations
0
100% better than Virginia average

Virginia average: 1

0 critical citations Virginia average: 0.4

0 serious citations Virginia average: 1

14 moderate citations Virginia average: 36.3

0 minor citations Virginia average: 0.8
Citations history (last 6 years)
Care Planning moderate citation Nov 15, 2024
Corrected

Quality of Care moderate citation Aug 21, 2024
Corrected

Pharmacy moderate citation May 09, 2024
Corrected

Care Planning moderate citation Apr 04, 2023
Corrected

Financial Assistance for
Nursing Home in Virginia

Mulberry Creek Assisted Living is located in MARTINSVILLE, Virginia.
Here are the financial assistance programs available to residents in Virginia.

Get Financial aid guidance

Commonwealth Coordinated Care Plus (CCC Plus)

VA Medicaid CCC Plus

Age 65+ or disabled
General Virginia resident, Medicaid-eligible, nursing home-level care need.
Income Limits (2025) ~$2,829/month 300% FBR, individual
Asset Limits $2,000 (individual), $3,000 (couple).
VA

Managed care model; high demand in urban areas.

Benefits
Personal care (5-7 hours/day) Respite (240 hours/year) Adult day care ($65/day) Home modifications ($1,500 avg.)

Virginia Respite Care Grant Program

VA Respite Grant

Age Caregiver of someone 60+
General Virginia resident.
Income Limits ~$2,500/month individual, varies
Asset Limits $40,000 individual
VA

Limited grants; rural/urban balance.

Benefits
In-home respite (up to 30 days/year) Adult day care (~$65/day) Facility respite (up to 5 days)

Adult Services Program

Virginia Adult Services (AS)

Age 60+ (or disabled 18+)
General VA resident, need significant care (2+ ADLs), not Medicaid-eligible.
Income Limits (2025) Varies by locality; typically < ~$2,510/month 200% FPL
Asset Limits Limited assets (excludes home, car); varies by DSS.
VA

Serves ~5,000 annually; focuses on low-income independence.

Benefits
Personal care (4-6 hours/week) Adult day care (~$60/day) Chore services Assessments Respite (~5 days/year)

Auxiliary Grant Program

Virginia Auxiliary Grant (AG)

Age 65+ (or disabled 18+)
General VA resident, living in approved ALF/foster care, SSI-eligible or low-income.
Income Limits (2025) ~$1,041/month (individual, SSI level + $20 disregard); higher with medical deductions.
Asset Limits $2,000 individual
VA

Serves 4,000; personal needs allowance ($90/month).

Benefits
Cash (~$1,400-$1,700/month in 2025, varies by region) for ALF/foster care costs; basic care included

Medicare Savings Program (MSP)

Virginia Medicare Savings Program

Age 65+ or disabled
General VA resident, Medicare Part A/B.
Income Limits (2025) ~$2,510/month (QMB), ~$3,380/month (SLMB), ~$3,598/month (QI)—individual.
Asset Limits $9,430 (individual), $14,130 (couple).
VA

Includes Extra Help for Part D; no waitlist.

Benefits
Covers Part B premiums ($174.70/month) Deductibles ($240/year) Copays (~20%)

Energy Assistance Program (EAP)

Virginia Energy Assistance Program

Age 60+ prioritized
General VA resident, low-income household.
Income Limits (2025) ~$3,970/month 185% FPL
Asset Limits Not assessed.
VA

Fuel, Crisis, Cooling components; serves ~100,000 households.

Benefits
Heating/cooling aid ($300-$1,000/season) Crisis aid ($500 max) Equipment repair (~$250)

VA Aid and Attendance (A&A) and Housebound Benefits

Virginia VA Aid and Attendance/Housebound

Age 65+ or disabled veteran/spouse
General VA resident, wartime service, ADL help (A&A) or homebound.
Income Limits (2025) Net income < ~$1,984/month (veteran with dependent, A&A); pension offsets income.
Asset Limits ~$155,356 net worth
VA

High veteran population; supports rural/urban needs.

Benefits
Cash (~$1,433-$2,642/month veteran, ~$951-$1,318 spouse) for care costs

Property Tax Relief for the Elderly and Disabled

Virginia Property Tax Relief

Age 65+ or disabled
General VA resident, homeowner, income/asset limits vary by locality.
Income Limits (2025) ~$50,000-$75,000/year household, e.g., Fairfax: $72,000; Richmond: $50,000
Asset Limits Varies e.g., Fairfax: $400,000 net worth; Richmond: $100,000
VA

Offered in 90% of localities; saves ~$500-$2,000/year.

Benefits
Tax exemption/deferral (~$500-$2,000/year depending on locality)

Senior Farmers’ Market Nutrition Program (SFMNP)

Virginia SFMNP

Age 60+
General VA resident, low-income.
Income Limits (2025) ~$2,322/month 185% FPL
Asset Limits Not assessed.
VA

Vouchers (~$50-$75/season); serves ~15,000 via AAAs.

Benefits
Vouchers (~$50-$75/season) for produce at farmers’ markets

Places of interest near Mulberry Creek Assisted Living

Address 0.0 miles from city center Info Estimated distance in miles from Martinsville's city center to Mulberry Creek Assisted Living's address, calculated via Google Maps.

Calculate Travel Distance to Mulberry Creek Assisted Living

Add your location

Address

Staffing Data

Reporting period: April 1 – June 30, 2025 (Q2 2025). Source: CMS Payroll-Based Journal report.

Total staff 275
Employees 263
Contractors 12
Staff to resident ratio 1.54:1
7% worse than Virginia average
Virginia average ratio: 1.67:1 Virginia average ratio: 1.67:1See full Virginia ranking
Avg staff/day 111
Average shift 8 hours
0% compared with Virginia average
Virginia average: 8 hours Virginia average shift: 8 hoursSee full Virginia ranking
Total staff hours (quarter) 80,932

Nursing staff breakdown

Q2 2025 · Apr 1 – Jun 30 More info This data comes from the CMS Payroll-Based Journal report covering April 1 – June 30, 2025.
Registered Nurse

Manages medical care and health needs.

Total count 11
Average shift length Info Average shift length. Calculated as total hours divided by days worked and average staff per day. 8.6 hours

No contractors work on this role.

Licensed Practical Nurse

Assists with medical care and medications.

Total count 47
Average shift length Info Average shift length. Calculated as total hours divided by days worked and average staff per day. 9.3 hours

This role is partially covered by contractors.

Certified Nursing Assistant

Helps with daily care and mobility.

Total count 142
Average shift length Info Average shift length. Calculated as total hours divided by days worked and average staff per day. 7.7 hours

No contractors work on this role.

Contractor staffing

Q2 2025 · Apr 1 – Jun 30 More info This data comes from the CMS Payroll-Based Journal report covering April 1 – June 30, 2025.

Total hours from contractors

1.4%

1,117 contractor hours this quarter

Occupational Therapy Assistant: 7 Licensed Practical Nurse: 1 Qualified Social Worker: 1 Medical Director: 1 Feeding Assistant: 1 Occupational Therapy Aide: 1

Staff by category

Q2 2025 · Apr 1 – Jun 30 More info This data comes from the CMS Payroll-Based Journal report covering April 1 – June 30, 2025.
Certified Nursing Assistant142014240,94091100%7.7
Licensed Practical Nurse4614718,05491100%9.3
Qualified Activities Professional210214,49091100%8.9
Registered Nurse110113,68191100%8.6
Clinical Nurse Specialist8082,6116875%7.9
Speech Language Pathologist6061,9707279%7.2
Other Dietary Services Staff6061,6047987%6.9
Physical Therapy Aide4049417380%7
Physical Therapy Assistant2029326774%7.5
Dental Services Staff4049206673%8.5
Respiratory Therapy Technician5058476976%7.4
Mental Health Service Worker2026456167%7.9
Qualified Social Worker2136005560%7.9
RN Director of Nursing1015776167%9.5
Administrator1015126470%8
Dietitian1014987178%7
Feeding Assistant0114556571%7
Nurse Practitioner1014245358%8
Occupational Therapy Aide0111192527%4.7
Occupational Therapy Assistant077755459%1.2
Medical Director011401921%2.1
142 Certified Nursing Assistant
% of Days 100%
47 Licensed Practical Nurse
% of Days 100%
21 Qualified Activities Professional
% of Days 100%
11 Registered Nurse
% of Days 100%
8 Clinical Nurse Specialist
% of Days 75%
6 Speech Language Pathologist
% of Days 79%
6 Other Dietary Services Staff
% of Days 87%
4 Physical Therapy Aide
% of Days 80%
2 Physical Therapy Assistant
% of Days 74%
4 Dental Services Staff
% of Days 73%
5 Respiratory Therapy Technician
% of Days 76%
2 Mental Health Service Worker
% of Days 67%
3 Qualified Social Worker
% of Days 60%
1 RN Director of Nursing
% of Days 67%
1 Administrator
% of Days 70%
1 Dietitian
% of Days 78%
1 Feeding Assistant
% of Days 71%
1 Nurse Practitioner
% of Days 58%
1 Occupational Therapy Aide
% of Days 27%
7 Occupational Therapy Assistant
% of Days 59%
1 Medical Director
% of Days 21%

Facility Characteristics

Source: CMS Long-Term Care Facility Characteristics (Data as of Jan 2026)

Total residents 178
Medicare
9
5.1% of residents
Medicaid
140
78.7% of residents
Private pay or other
29
16.3% of residents
Programs & Services
Residents Group

Residents meet regularly to discuss policies, care quality, and activities

Nurse Aide Training

State-approved Nurse Aide Training and Competency Evaluation Program on-site

Active Resident Council

Organized group of residents that meets regularly to discuss facility policies, quality of life, and activities.

Quality of care over time

These measures show how residents usually do over time at this home, based on health outcomes and preventive care.

High-risk clinical events score Info A composite score based on pressure ulcers, falls with injury, weight loss, walking ability decline, and activities of daily living decline. 13.7
35% worse than Virginia average

Virginia average: 10.1

Functional decline score Info A composite score based on activities of daily living decline, walking ability decline, and incontinence. 21.9
11% worse than Virginia average

Virginia average: 19.7

Long-stay resident measures
Need for Help with Daily Activities Increased Info Percent of long-stay residents whose need for help with daily activities has increased 22.3%
32% worse than Virginia average

Virginia average: 16.8%

Walking Ability Worsened Info Percent of long-stay residents whose ability to move independently worsened 22.3%
13% worse than Virginia average

Virginia average: 19.7%

Low Risk Residents with Bowel/Bladder Incontinence Info Percent of low risk long-stay residents who lose control of their bowels or bladder 21.1%
7% better than Virginia average

Virginia average: 22.6%

Falls with Major Injury Info Percent of long-stay residents experiencing one or more falls with major injury 5.8%
60% worse than Virginia average

Virginia average: 3.6%

High Risk Residents with Pressure Ulcers Info Percent of long-stay high risk residents with pressure ulcers 7.0%
30% worse than Virginia average

Virginia average: 5.4%

Urinary Tract Infection Info Percent of long-stay residents with a urinary tract infection 2.3%
48% worse than Virginia average

Virginia average: 1.5%

Lost Too Much Weight Info Percent of long-stay residents who lose too much weight 11.1%
90% worse than Virginia average

Virginia average: 5.9%

Depressive Symptoms Info Percent of long-stay residents who have depressive symptoms 1.9%
88% better than Virginia average

Virginia average: 14.9%

Antipsychotic Use Info Percent of long-stay residents who received an antipsychotic medication 19.3%
50% worse than Virginia average

Virginia average: 12.9%

Pneumococcal Vaccine Info Percent of long-stay residents assessed and appropriately given the pneumococcal vaccine 95.3%
In line with Virginia average

Virginia average: 91.3%

Influenza Vaccine Info Percent of long-stay residents assessed and appropriately given the seasonal influenza vaccine 98.4%
5% better than Virginia average

Virginia average: 94.0%

Short-stay resident measures
Pneumococcal Vaccine Info Percent of short-stay residents assessed and appropriately given the pneumococcal vaccine 81.6%
9% better than Virginia average

Virginia average: 74.9%

Antipsychotic medication increase Info Percent of short-stay residents who newly received an antipsychotic medication 1.6%
32% worse than Virginia average

Virginia average: 1.2%

Influenza Vaccine Info Percent of short-stay residents assessed and appropriately given the seasonal influenza vaccine 87.9%
19% better than Virginia average

Virginia average: 73.6%

Penalties and fines

Federal penalties imposed by CMS for regulatory violations, including civil money penalties (fines) and denials of payment for new Medicare/Medicaid admissions.

Source: CMS Penalties Database

No penalties in the past 3 years

No civil money penalties or payment denials were reported in the last 3 years.

Guides for Better Senior Living

Care Cost Calculator: See Prices in Your Area

Nursing Home Data Explorer

Don’t Wait Too Long: 7 Red Flag Signs Your Parent Needs Assisted Living Now

The True Cost of Assisted Living in 2025 – And How Families Are Paying For It

Understanding Senior Living Costs: Pricing Models, Discounts & Financial Assistance

Frequently Asked Questions about Mulberry Creek Assisted Living

Is Mulberry Creek Assisted Living in a walkable area?

Mulberry Creek Assisted Living has a walk score of 60. Moderately walkable. Some errands can be accomplished on foot, with a mix of nearby amenities.

When does Mulberry Creek Assisted Living's license expire?

According to VA state health department records, Mulberry Creek Assisted Living's license expires on May 30, 2026.

Who is the administrator of Mulberry Creek Assisted Living?

Kailey Joyce is the administrator of Mulberry Creek Assisted Living.

How many beds does Mulberry Creek Assisted Living have?

Mulberry Creek Assisted Living has 60 beds.

Has Mulberry Creek Assisted Living had any recent deficiencies or citations?

Mulberry Creek Assisted Living has had 11 recently reported deficiencies.

Are there photos of Mulberry Creek Assisted Living?

Yes — there are 10 photos of Mulberry Creek Assisted Living in the photo gallery on this page.

What is the address of Mulberry Creek Assisted Living?

Mulberry Creek Assisted Living is located at 400 Blue Ridge Street.

Explore Open Rooms
1 Contact details
2 What type of senior care service are you looking for?
3 What budget do you have in mind for senior care?
4 How soon do you need to find care?
5 Additional details

Thank you for your interest!

Our team will be in touch shortly to help with next steps.