Myrtle Beach Manor
Nursing Home, Assisted Living, Memory Care, Respite Care & Skilled Nursing · South Carolina, SC
CMS overall rating Info The Overall CMS Rating is scored from 1 to 5 stars and combines results from health inspections, staffing levels, and quality measures. Health inspections carry the most weight. Staffing and quality scores can increase or decrease the final rating based on performance compared to state and national standards.

Myrtle Beach Manor

Nursing Home, Assisted Living, Memory Care, Respite Care & Skilled Nursing · South Carolina, SC
CMS overall rating Info The Overall CMS Rating is scored from 1 to 5 stars and combines results from health inspections, staffing levels, and quality measures. Health inspections carry the most weight. Staffing and quality scores can increase or decrease the final rating based on performance compared to state and national standards.
Calculator: See prices in your area
Myrtle Beach Manor accepts Medicare and private pay.

Overview of Myrtle Beach Manor

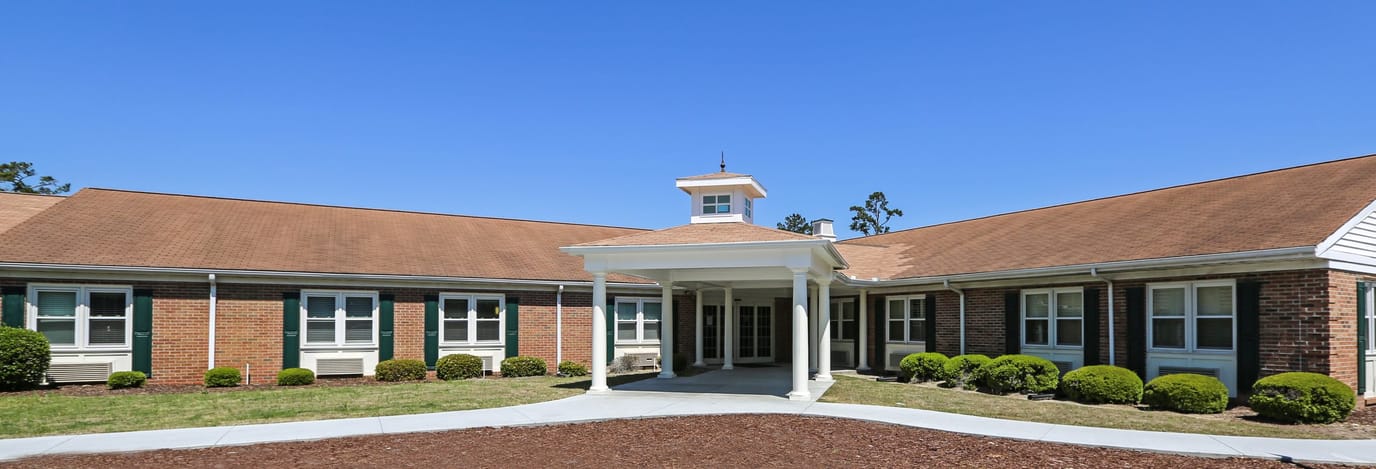
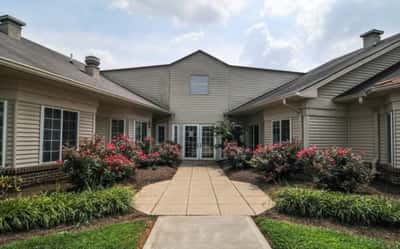
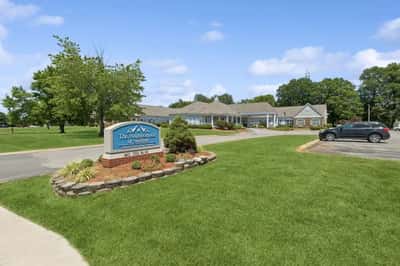
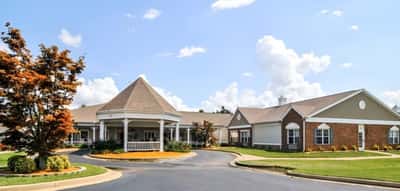
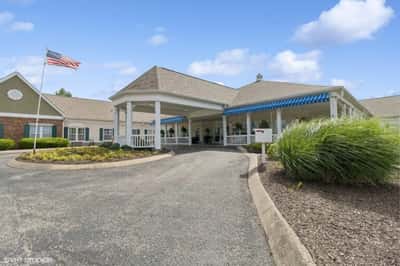
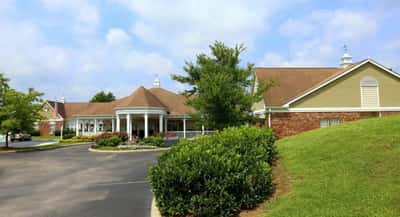
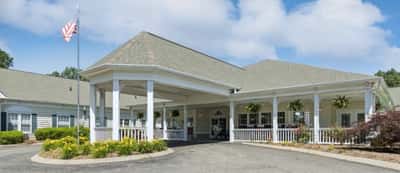
Located in Myrtle Beach on North Kings Highway, Myrtle Beach Manor operates 111 beds serving short-stay Medicare and private-pay residents with an average stay of 23 days. The facility provides assisted living, skilled nursing, memory care with a dedicated Alzheimer’s unit, and respite care services. Administrator Elizabeth Schmeizl manages day-to-day operations.

The facility holds a 1-star CMS overall rating, 65.9% below the state average, driven by health inspection performance 63.6% below peers.

A July 2025 inspection documented one critical pharmacy violation and two serious deficiencies, triggering a $23,000 penalty from CMS. Across six inspections since 2021, the facility accumulated 17 citations, with serious-level deficiencies running 567% above South Carolina’s average. Primary deficiency areas are resident rights (4), pharmacy services (4), and quality of life and care (3).

Payment suspensions were imposed in April 2024 for 27 days; additional penalties of $9,000 and $4,000 were assessed that same month and in December 2023 respectively.

Registered nurse availability is genuinely strong at 76% above state average with weekend RN coverage 138% above peers.

Despite robust staffing hours, clinical outcomes diverge sharply by length of stay. Long-stay residents experience falls with major injury at 9.8%, or 229% worse than state average, and urinary tract infections at 4.1%, 147% above state norm. Short-stay rehabilitation outcomes diverge positively: 63.1% of patients successfully return to home or community, 25% above state average, with 62.6% maintaining or improving self-care ability at discharge.

Occupancy has declined to 44%, well below the 82.1% state average. The facility reported a $1.2 million operating deficit in 2023, reflecting a pattern of financial losses stretching more than a decade.

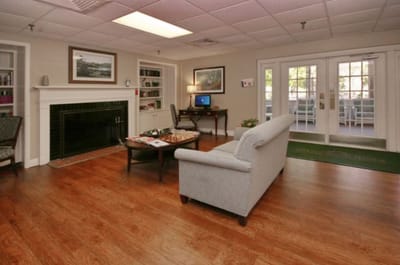
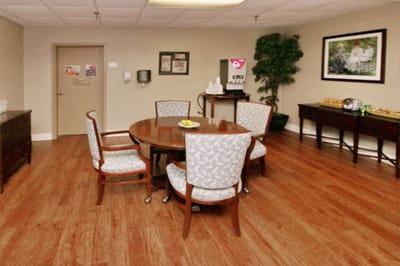
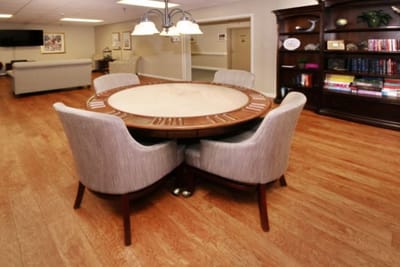
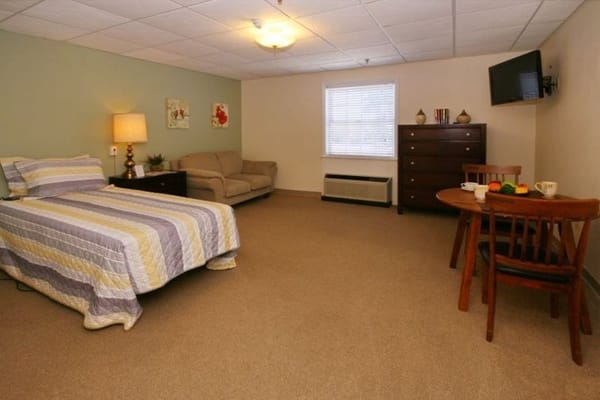
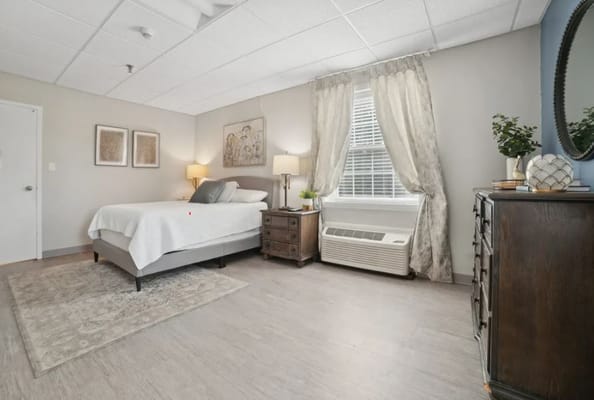
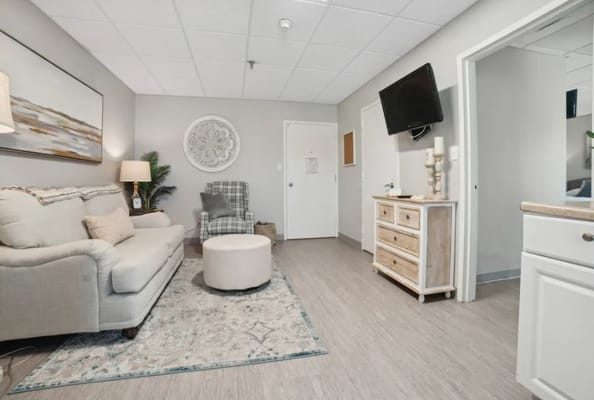
Recent renovations include a salon, arts and crafts studio, bistro, activity rooms, and multiple dining venues.

The community is oriented toward short-term Medicare rehabilitation and private-pay residents; the recent critical compliance findings and chronic financial instability warrant thorough evaluation before placement decisions.

(843) 429-8465

Quality ratings

Measured by Centers for Medicare & Medicaid Services (CMS)

Overall rating Info The Overall CMS Rating combines results from health inspections, staffing levels and quality measures. Health inspections carry the most weight. Staffing and quality scores can increase or decrease the final rating based on performance compared to state and national standards.
▼ 65.9% Below SC avg. ▼ 65.9% Below SC avg.Click the badge to see the full State ranking.Click here to see the full State ranking.
Health Inspection Info Based on the results of the facility's three most recent standard inspections and any complaint investigations. CMS reviews the number, scope, and severity of deficiencies, with more recent findings weighted more heavily.
▼ 63.6% Below SC avg. ▼ 63.6% Below SC avg.Click the badge to see the full State ranking.Click here to see the full State ranking.
Staffing Info Measures average nursing staff hours per resident per day, including Registered Nurses (RNs) and total nursing staff. Ratings are adjusted based on the level of care residents require and are compared to state and national benchmarks.
At SC avg. At SC avg.Click the badge to see the full State ranking.Click here to see the full State ranking.
Quality Measures Info Based on clinical and physical health indicators reported to CMS, such as hospital readmissions, falls, pressure ulcers, and improvements in mobility. These measures reflect how well residents' health needs are being managed.
▼ 14.0% Below SC avg. ▼ 14.0% Below SC avg.Click the badge to see the full State ranking.Click here to see the full State ranking.

Staffing hours breakdown

Info Daily nursing hours per resident by staff type, reported to CMS. Higher is generally better — compare this facility to state and national averages to see where staffing stands.

Hours per resident per day — compared to South Carolina state averages

Total nursing care / resident Info This home is ranked 31st out of 112 homes in South Carolina. Total adjusted nursing hours per resident per day, combining RN, LPN, and aide time. CMS adjusts this for case-mix so facilities can be fairly compared.
4h 20m per day
Rank #31 / 112Nurse hours — State benchmarkedThis home is ranked 31st out of 112 homes in South Carolina. Shows adjusted nurse hours per resident per day benchmarked to the South Carolina average, with a ranking across 112 South Carolina SNFs. More hours mean more direct care. The national average is about 3.5 hrs; below 3.0 is a red flag.Click the rank badge to see the full State ranking.Click here to see the full State ranking.
This facility South Carolina avg (4h 5m per day)
vs South Carolina avg
+6%

2 of 6 metrics below state avg

Standout metric Weekend RN is +138% above state avg
Staff typeHours / Day / Residentvs state avg
Registered Nurse (RN) Info RNs hold the highest nursing license and can assess residents, interpret test results, and direct care plans. More RN hours per day often signals stronger clinical oversight and faster response to health changes. 1h 7m per day ▲ 76% State avg: 38m per day · National avg: 41m per day
LPN / LVN Info Licensed Practical Nurses (LPNs) or Licensed Vocational Nurses (LVNs) deliver routine hands-on care — medication administration, wound dressing, and monitoring vital signs. They work under RN supervision and make up a large share of daily bedside care. 57m per day ▼ 7% State avg: 1h 1m per day · National avg: 52m per day
Nurse Aide Info Certified Nurse Aides (CNAs) provide the most direct day-to-day assistance: bathing, dressing, feeding, and mobility. Nurse aide hours are typically the largest staffing category and directly affect residents' quality of life. 2h 33m per day ▲ 15% State avg: 2h 13m per day · National avg: 2h 20m per day
Weekend Total Nursing Info Combined nursing hours (RN + LPN + Nurse Aide) per resident per day on weekends. Staffing often drops on weekends — this figure reveals whether the facility maintains adequate coverage outside of weekday hours. 3h 42m per day ▲ 10% State avg: 3h 21m per day · National avg: 3h 26m per day
Physical Therapist Info Hours per resident per day provided by licensed Physical Therapists (PTs) or PT Assistants. PT services help residents recover mobility after injury or illness and are especially important for post-acute (short-stay) rehabilitation. 4m per day ▼ 20% State avg: 5m per day · National avg: 4m per day
Weekend RN Info Registered nurse hours specifically on weekends. Facilities sometimes reduce RN presence on Saturdays and Sundays — a low weekend RN figure compared to weekday hours can indicate reduced clinical oversight when most administrative staff are absent. 57m per day ▲ 138% State avg: 24m per day · National avg: 28m per day

Types of Care at Myrtle Beach Manor

Assisted Living Memory Care Respite Care Skilled Nursing

Capacity and availability

Avg. Length of Stay
23 days
Bed community size
111-bed community Rank #88 / 309Bed count — State benchmarkedThis home is ranked 88th out of 309 homes in South Carolina. Shows this facility's certified or reported bed count compared to other South Carolina SNFs. Larger communities may offer more amenities, programs, and on-site services for residents and families.Click the rank badge to see the full State ranking.Click here to see the full State ranking.
A larger shared setting that may offer more common spaces and organized community services.
Walk Score
Walk Score: 41 / 100 Rank #81 / 232Walk Score — State benchmarkedThis home is ranked 81st out of 232 homes in South Carolina. Shows how walkable this facility's neighborhood is compared to the average Walk Score across South Carolina SNFs. Higher scores benefit residents, families, and staff.Click the rank badge to see the full State ranking.Click here to see the full State ranking.
Somewhat walkable. A few nearby services may be reachable on foot, but most trips require transportation.

About this community

Occupancy

Occupancy rate
44%
Rank #112 / 121Occupancy rate — State benchmarkedThis home is ranked 112th out of 121 homes in South Carolina. Shows this facility's occupancy rate versus the South Carolina average, with its Statewide rank out of 121. Higher occupancy signals strong local demand and financial stability.Click the rank badge to see the full State ranking.Click here to see the full State ranking.
Lower than the South Carolina average: 82.1%
Occupied beds
49 / 111
Average occupied beds in South Carolina homes 90 beds

License Details

Facility TypeHl- Community Residential Care Facility
ExpirationJanuary 31, 2026
CountyHorry
License NumberCRC-2123
Business TypeLimited Liability
CMS Certification Number425070

Ownership & Operating Entity

Myrtle Beach Manor is legally operated by Snh Sc Tenant Llc, and administrated by Elizabeth Schmeizl.

Ownership TypeLimited Liability

Memory & Specialized Care

2 services
Offers Alzheimer's Care
Dedicated Alzheimer's Unit

Contact Information

Contact Myrtle Beach Manor

Health Inspection History

Inspections since 2021
Total health inspections 6

South Carolina average 3.9


Last Health inspection on Jul 2025

Total health citations
17 Rank #84 / 113Health citations — State benchmarkedThis home is ranked 84th out of 113 homes in South Carolina. Shows this facility's total health deficiency citations benchmarked to the South Carolina State average, with a ranking across all 113 SC SNFs. Lower citation counts earn a better rank.Click the rank badge to see the full State ranking.Click here to see the full State ranking.

South Carolina average 13.7

Citations per inspection
2.83 Rank #42 / 113Citations per inspection — State benchmarkedThis home is ranked 42nd out of 113 homes in South Carolina. Shows average deficiency citations per CMS inspection for this facility versus the South Carolina mean across 113 SNFs with citation data. Lower is better.Click the rank badge to see the full State ranking.Click here to see the full State ranking.

South Carolina average 3.44


Health citations are formal notices following inspections when they fail to comply with safety and care standards.

13 of 17 citations resulted from standard inspections; and 4 of 17 resulted from complaint investigations.

Breakdown of citation severity (last 5 years)
Critical health citations
1
In line with South Carolina average

South Carolina average: 1


Serious health citations
2
567% worse than South Carolina average

South Carolina average: 0.3

1 critical citation South Carolina average: 1

2 serious citations South Carolina average: 0.3

14 moderate citations South Carolina average: 12.3

0 minor citations South Carolina average: 0.1
Citations history (last 5 years)
Pharmacy critical citation Jul 30, 2025

Nutrition moderate citation Aug 29, 2024
Corrected

Resident Rights moderate citation Aug 29, 2024
Corrected

Resident Rights moderate citation Aug 29, 2024
Corrected

Staffing Data

Reporting period: October 1 – December 31, 2025 (Q4 2025). Source: CMS Payroll-Based Journal report.

Total staff 102
Employees 70
Contractors 32
Staff to resident ratio 3.78:1
106% better than South Carolina average
South Carolina average ratio: 1.84:1 South Carolina average ratio: 1.84:1See full South Carolina ranking
Avg staff/day 30
Average shift 7.5 hours
5% worse than South Carolina average
South Carolina average: 7.9 hours South Carolina average shift: 7.9 hoursSee full South Carolina ranking
Total staff hours (quarter) 20,798

Nursing staff breakdown

Q4 2025 · Oct 1 – Dec 31 More info This data comes from the CMS Payroll-Based Journal report covering October 1 – December 31, 2025.
Registered Nurse

Manages medical care and health needs.

RN Staff Info 13 total: 10 full-time employees and 3 contractors. 13
Average shift length Info Average shift length. Calculated as total hours divided by days worked and average staff per day. 8.1 hours
Licensed Practical Nurse

Assists with medical care and medications.

LPN Staff Info 19 total: 16 full-time employees and 3 contractors. 19
Average shift length Info Average shift length. Calculated as total hours divided by days worked and average staff per day. 9 hours
Certified Nursing Assistant

Helps with daily care and mobility.

CNA Staff Info 34 total: 31 full-time employees and 3 contractors. 34
Average shift length Info Average shift length. Calculated as total hours divided by days worked and average staff per day. 8.8 hours

Contractor staffing

Q4 2025 · Oct 1 – Dec 31 More info This data comes from the CMS Payroll-Based Journal report covering October 1 – December 31, 2025.

Total hours from contractors

11.9%

2,474 contractor hours this quarter

Feeding Assistant: 5 Certified Nursing Assistant: 3 Registered Nurse: 3 Licensed Practical Nurse: 3 Respiratory Therapy Technician: 3 Speech Language Pathologist: 3 Other Physician: 3 Qualified Social Worker: 2 Physical Therapy Aide: 2 Physical Therapy Assistant: 2 Medical Director: 1 Occupational Therapy Aide: 1 Occupational Therapy Assistant: 1

Staff by category

Q4 2025 · Oct 1 – Dec 31 More info This data comes from the CMS Payroll-Based Journal report covering October 1 – December 31, 2025.
Certified Nursing Assistant313348,33092100%8.8
Licensed Practical Nurse163193,17292100%9
Registered Nurse103132,17892100%8.1
Other Dietary Services Staff5051,8499098%7.3
RN Director of Nursing2029497278%7.9
Speech Language Pathologist0335166975%6.6
Physical Therapy Aide0224896773%6.6
Physical Therapy Assistant0224887076%6.2
Nurse Practitioner1014686672%7.1
Dietitian1014445560%8.1
Administrator1014205358%7.9
Mental Health Service Worker2023234246%7.7
Medication Aide/Technician1012894751%6.2
Feeding Assistant0552716166%2.8
Respiratory Therapy Technician0331856672%2.3
Other Physician0331304953%2
Occupational Therapy Aide0111284145%3.1
Qualified Social Worker0221174246%2.8
Medical Director011353336%1.1
Occupational Therapy Assistant01119910%2.1
34 Certified Nursing Assistant
% of Days 100%
19 Licensed Practical Nurse
% of Days 100%
13 Registered Nurse
% of Days 100%
5 Other Dietary Services Staff
% of Days 98%
2 RN Director of Nursing
% of Days 78%
3 Speech Language Pathologist
% of Days 75%
2 Physical Therapy Aide
% of Days 73%
2 Physical Therapy Assistant
% of Days 76%
1 Nurse Practitioner
% of Days 72%
1 Dietitian
% of Days 60%
1 Administrator
% of Days 58%
2 Mental Health Service Worker
% of Days 46%
1 Medication Aide/Technician
% of Days 51%
5 Feeding Assistant
% of Days 66%
3 Respiratory Therapy Technician
% of Days 72%
3 Other Physician
% of Days 53%
1 Occupational Therapy Aide
% of Days 45%
2 Qualified Social Worker
% of Days 46%
1 Medical Director
% of Days 36%
1 Occupational Therapy Assistant
% of Days 10%

Penalties and fines

Includes penalties issued in 2024-2025

Federal penalties imposed by CMS for regulatory violations, including civil money penalties (fines) and denials of payment for new Medicare/Medicaid admissions.

Source: CMS Penalties Database (Data as of Jan 2026)

Total fines amount $36K Rank #95 / 114Federal fines — State benchmarkedThis home is ranked 95th out of 114 homes in South Carolina. Shows this facility's cumulative CMS federal fine dollars versus the South Carolina average among facilities with fines, and where it ranks among 114 skilled nursing facilities in the pool. Lower total dollars mean a better rank.Click the rank badge to see the full State ranking.Click here to see the full State ranking.
7% higher than South Carolina average

South Carolina average: $34K

Number of fines 3
23% more fines than South Carolina average

South Carolina average: 2.4

Payment Denials Info Serious action where Medicare and/or Medicaid temporarily stops payments for new residents until issues are fixed. 1
761% more payment denials than South Carolina average

South Carolina average: 0.1

Fines amount comparison
This facility $36K
South Carolina average $34K
Penalty History

Penalties are imposed by CMS for violations of federal nursing home regulations.

4 penalties in the past 3 years

Multiple penalties were reported in the last 3 years.

Civil Money Penalty Info Fines imposed for noncompliance, which can be assessed per day or per instance of violation. Jul 30, 2025
$23K
Civil Money Penalty Info Fines imposed for noncompliance, which can be assessed per day or per instance of violation. Apr 9, 2024
$4K
Civil Money Penalty Info Fines imposed for noncompliance, which can be assessed per day or per instance of violation. Apr 9, 2024
$9K
Payment Denial Info Serious action where Medicare and/or Medicaid temporarily stops payments for new residents until issues are fixed. Apr 9, 2024
27 days

Last updated: Jan 2026

Quality of care over time

These measures show how residents usually do over time at this home, based on health outcomes and preventive care.

High-risk clinical events score Info A composite score based on pressure ulcers, falls with injury, weight loss, walking ability decline, and activities of daily living decline. 9.6
10% worse than South Carolina average

South Carolina average: 8.7

Functional decline score Info A composite score based on activities of daily living decline, walking ability decline, and incontinence. 18.1
17% worse than South Carolina average

South Carolina average: 15.5

Long-stay resident measures
Below average South Carolina avg: 3.9 Info CMS star rating based on long-stay quality measure performance. 5 stars = significantly above average, 1 star = significantly below average.
Need for Help with Daily Activities Increased Info Percent of long-stay residents whose need for help with daily activities has increased 15.0%
15% worse than South Carolina average

South Carolina average: 13.1%

Low Risk Residents with Bowel/Bladder Incontinence Info Percent of low risk long-stay residents who lose control of their bowels or bladder 21.1%
24% worse than South Carolina average

South Carolina average: 17.0%

Falls with Major Injury Info Percent of long-stay residents experiencing one or more falls with major injury 9.8%
229% worse than South Carolina average

South Carolina average: 3.0%

High Risk Residents with Pressure Ulcers Info Percent of long-stay high risk residents with pressure ulcers 4.1%
33% better than South Carolina average

South Carolina average: 6.1%

Urinary Tract Infection Info Percent of long-stay residents with a urinary tract infection 4.1%
147% worse than South Carolina average

South Carolina average: 1.6%

Depressive Symptoms Info Percent of long-stay residents who have depressive symptoms 4.4%
58% worse than South Carolina average

South Carolina average: 2.8%

Antipsychotic Use Info Percent of long-stay residents who received an antipsychotic medication 23.5%
62% worse than South Carolina average

South Carolina average: 14.5%

Pneumococcal Vaccine Info Percent of long-stay residents assessed and appropriately given the pneumococcal vaccine 94.1%
In line with South Carolina average

South Carolina average: 90.5%

Hospitalizations per 1,000 days Info Number of hospitalizations per 1,000 long-stay resident days. 1.51
26% better than South Carolina average

South Carolina average: 2.03

ED visits per 1,000 days Info Number of outpatient emergency department visits per 1,000 long-stay resident days. 3.61
89% worse than South Carolina average

South Carolina average: 1.91

Short-stay resident measures
Above average South Carolina avg: 2.8 Info CMS star rating based on short-stay quality measure performance. 5 stars = much above average, 1 star = much below average.
Pneumococcal Vaccine Info Percent of short-stay residents assessed and appropriately given the pneumococcal vaccine 86.1%
8% better than South Carolina average

South Carolina average: 79.5%

Antipsychotic medication increase Info Percent of short-stay residents who newly received an antipsychotic medication 0.4%
76% better than South Carolina average

South Carolina average: 1.7%

Influenza Vaccine Info Percent of short-stay residents assessed and appropriately given the seasonal influenza vaccine 85.5%
10% better than South Carolina average

South Carolina average: 78.0%

Re-hospitalized after SNF stay Info Percentage of short-stay residents who were re-hospitalized after their nursing home admission. 31.9%
29% worse than South Carolina average

South Carolina average: 24.7%

Emergency department visits Info Percentage of short-stay residents who had an outpatient emergency department visit. 8.5%
40% better than South Carolina average

South Carolina average: 14.1%

Falls with major injury Info Percentage of SNF residents who experience falls with major injury during their stay. 1.5%
94% worse than South Carolina average

South Carolina average: 0.8%

Ability to care for self at discharge Info Percentage of residents at or above expected ability to care for themselves at discharge. 62.6%
17% better than South Carolina average

South Carolina average: 53.7%

Successful return to home or community Info Rate of successful return to home or community from a skilled nursing facility. 63.1%
25% better than South Carolina average

South Carolina average: 50.6%

Breakdown by payment type

Medicare

45% of new residents, usually for short-term rehab.

Typical stay 17 days

Private pay

55% of new residents, often for short stays.

Typical stay 3 - 4 months

Facility Characteristics

Source: CMS Long-Term Care Facility Characteristics (Data as of Jan 2026)

Total residents 27
Medicare
11
40.7% of residents
Private pay or other
16
59.3% of residents
Programs & Services
Residents Group

Residents meet regularly to discuss policies, care quality, and activities

Active Resident Council

Organized group of residents that meets regularly to discuss facility policies, quality of life, and activities.

Finances and operations

Privately-owned community
Operated by a business corporation.
Home revenue
$7.4M
Operating loss
-$1.2M
Privately-owned community Operated by a business corporation.
Home revenue
$7.4M Rank #102 / 116Revenue — State benchmarkedThis home is ranked 102nd out of 116 homes in South Carolina. Shows this facility's annual revenue compared to the South Carolina SNF average. Higher revenue generally means more resources for staffing and capital — read alongside Payroll %.Click the rank badge to see the full State ranking.Click here to see the full State ranking.
Operating loss
-$1.2M
Payroll costs Info The portion of the home's budget spent on staff, including nurses, caregivers, and other employees who support care and operations. Rank #92 / 116Payroll — State benchmarkedThis home is ranked 92nd out of 116 homes in South Carolina. Shows total annual staff payroll benchmarked to the South Carolina average. Higher payroll investment relative to peers often signals better staffing and less reliance on cheaper contract labor.Click the rank badge to see the full State ranking.Click here to see the full State ranking.
$4.7M
63.7% of revenue Rank #14 / 116Payroll % — State benchmarkedThis home is ranked 14th out of 116 homes in South Carolina. Shows payroll as a percentage of revenue versus the South Carolina average. Well-run South Carolina SNFs typically land around 53–64% — the top third Statewide. Below 25% may signal understaffing or heavy agency use — read with Staffing ratings.Click the rank badge to see the full State ranking.Click here to see the full State ranking.
Other operating costs Info All remaining costs needed to run the home, such as food, utilities, building maintenance, supplies and administrative expenses.
$3.9M
Total costs $8.6M

What does this home offer?

Housing options icon

Housing Options: Studio / 1 Bed

Building type icon
Building type icon

Building Type: Single-story

Transportation services icon

Transportation Services

Fitness and recreation icon

Fitness and Recreation

Type of Rooms Available

Studio
Studio
1
1 Bed
1 Bed
1 / 4
1 Bed
1

Who this home usually serves

TYPE OF STAY

Mix of rehab and long-term care

This home supports both short-term rehab and long-term care, with residents staying for a wide range of durations.

Places of interest near Myrtle Beach Manor

Address 7.4 miles from city center Info Estimated distance in miles from Myrtle Beach's city center to Myrtle Beach Manor's address, calculated via Google Maps.

Calculate Travel Distance to Myrtle Beach Manor

Add your location

Address

Financial Assistance for
Nursing Home in South Carolina

Myrtle Beach Manor is located in Myrtle Beach, South Carolina.
Here are the financial assistance programs available to residents in South Carolina.

Get Financial aid guidance

Community Long Term Care (CLTC)

SC Medicaid CLTC

Age 65+ or disabled
General South Carolina resident, Medicaid-eligible, nursing home-level care need.
Income Limits (2025) ~$2,829/month 300% FBR, individual
Asset Limits $2,000 (individual), $3,000 (couple).
SC

High rural demand; waitlists possible.

Benefits
Personal care (5-7 hours/day) Respite (240 hours/year) Adult day care ($60/day) Home modifications ($1,500 avg.)

South Carolina Respite Care Program

SC NFCSP Respite

Age Caregiver of someone 60+ (or with dementia)
General South Carolina resident.
Income Limits No strict limit; prioritizes low-income.
Asset Limits Not applicable.
SC

Limited slots; rural/urban balance.

Benefits
In-home respite (4-6 hours/day) Adult day care (~$60/day) Short-term facility care (up to 5 days)

Medicare Savings Program (MSP)

South Carolina Medicare Savings Program

Age 65+ or disabled
General SC resident, Medicare Part A/B.
Income Limits (2025) ~$2,510/month (QMB), ~$3,380/month (SLMB), ~$3,598/month (QI)—individual.
Asset Limits $9,430 (individual), $14,130 (couple).
SC

Three tiers; includes Extra Help for Part D; no waitlist.

Benefits
Covers Part B premiums ($174.70/month) Deductibles ($240/year) Copays (~20%)

VA Aid and Attendance (A&A) and Housebound Benefits

South Carolina VA Aid and Attendance/Housebound

Age 65+ or disabled veteran/spouse
General SC resident, wartime service, need for ADL help (A&A) or homebound.
Income Limits (2025) Net income < ~$1,984/month (veteran with dependent, A&A); pension offsets income.
Asset Limits ~$155,356 net worth limit
SC

High veteran population; supports rural/urban care needs.

Benefits
Cash (~$1,433-$2,642/month veteran, ~$951-$1,318 spouse) for care costs (e.g., in-home, assisted living)

Senior Farmers’ Market Nutrition Program (SFMNP)

South Carolina SFMNP

Age 60+
General SC resident, low-income.
Income Limits (2025) ~$2,322/month individual, 185% FPL
Asset Limits Not assessed.
SC

Vouchers (~$50/season); serves ~20,000 annually via 10 AAAs.

Benefits
Vouchers (~$50/season) for fresh produce at approved markets

Homestead Exemption Program

South Carolina Homestead Exemption

Age 65+ (or disabled/blind)
General SC resident 1+ year, homeowner.
Income Limits (2025) None; tax-based eligibility.
Asset Limits Not assessed; home-focused.
SC

Saves ~$500-$1,000/year avg.; applies to primary residence.

Benefits
Property tax exemption (~$50,000 value, ~$500-$1,000/year savings)

Elderly Simplified Application Project (ESAP)

South Carolina ESAP (SNAP for Seniors)

Age 60+
General SC resident, no earned income, not on SCCAP.
Income Limits (2025) ~$1,732/month 133% FPL, individual
Asset Limits $4,250 individual, higher than standard SNAP
SC

Simplified process; serves ~50,000 seniors annually.

Benefits
EBT card for food (~$100-$300/month based on income)

Compare Nursing Home around Myrtle Beach

The information below is reported by the South Carolina Department of Public Health, Bureau of Healthcare Quality.

2 facilities compared · CMS & SC Dept. of Health data

Filter by care type
Brightwater Assisted Living
NH

Nursing Home Licensed facility providing 24/7 skilled nursing care for residents with complex, ongoing medical needs. Staffed by RNs, LPNs, and CNAs. Inspected and star-rated annually by CMS. Accepts Medicare (short-term rehab) and Medicaid (long-term care).

AL

Assisted Living A licensed, long-term care setting for seniors or individuals with disabilities who need help with daily activities — like bathing, dressing, and medication management — but not 24-hour skilled nursing. Offers housing, meals, and around-the-clock support while aiming to maximize resident independence.

Myrtle Beach56--5.00 +10%+25%$7.3k155.0252-Brightwater Retirement LLC$21.5M$8.3M38.7%425395
Myrtle Beach Manor
NH

Nursing Home Licensed facility providing 24/7 skilled nursing care for residents with complex, ongoing medical needs. Staffed by RNs, LPNs, and CNAs. Inspected and star-rated annually by CMS. Accepts Medicare (short-term rehab) and Medicaid (long-term care).

AL

Assisted Living A licensed, long-term care setting for seniors or individuals with disabilities who need help with daily activities — like bathing, dressing, and medication management — but not 24-hour skilled nursing. Offers housing, meals, and around-the-clock support while aiming to maximize resident independence.

MC

Memory Care Secured, specialized care for people living with Alzheimer's or dementia. Staff trained in cognitive impairment, with higher staff-to-resident ratios and an environment designed to reduce confusion and wandering risk.

RC

Respite Care Short-term temporary care — days to weeks — to give family caregivers a break. Full care provided during the stay. Often used after hospitalization or to trial a facility before a permanent placement decision.

Myrtle Beach111 44.0% -46%4.34 +36%+9%$35.9k172.8337 41 Tonya Fulk$7.4M$4.7M63.7%425070

Frequently Asked Questions about Myrtle Beach Manor

Who is the owner of Myrtle Beach Manor?

The legal owner and operator of Myrtle Beach Manor is Snh Sc Tenant Llc.

Is Myrtle Beach Manor in a walkable area?

Myrtle Beach Manor has a walk score of 41. Somewhat walkable. A few nearby services may be reachable on foot, but most trips require transportation.

What is the license number of Myrtle Beach Manor?

According to SC state health department records, Myrtle Beach Manor's license number is CRC-2123.

When does Myrtle Beach Manor's license expire?

According to SC state health department records, Myrtle Beach Manor's license expires on January 31, 2026.

What is the occupancy rate at Myrtle Beach Manor?

Myrtle Beach Manor's occupancy is 44%.

What is the best email address for Myrtle Beach Manor?

The team at Myrtle Beach Manor can be reached at [email protected].

Who is the administrator of Myrtle Beach Manor?

Elizabeth Schmeizl is the administrator of Myrtle Beach Manor.

More homes from the same operator

Operated by Phoenix SL

Guides for Better Senior Living

Care Cost Calculator: See Prices in Your Area

Nursing Home Data Explorer

Don’t Wait Too Long: 7 Red Flag Signs Your Parent Needs Assisted Living Now

The True Cost of Assisted Living in 2025 – And How Families Are Paying For It

Understanding Senior Living Costs: Pricing Models, Discounts & Financial Assistance

Explore Open Rooms
1 Contact details
2 What type of senior care service are you looking for?
3 What budget do you have in mind for senior care?
4 How soon do you need to find care?
5 Additional details

Thank you for your interest!

Our team will be in touch shortly to help with next steps.