North Cape Center
Nursing Home & Assisted Living · New Jersey, NJ
CMS overall rating Info CMS (the Centers for Medicare & Medicaid Services) is the federal agency that rates nursing home quality. Its Overall Rating runs from 1 to 5 stars, combining health inspections, staffing, and quality measures, with inspections weighted most heavily.

North Cape Center

Nursing Home & Assisted Living · New Jersey, NJ
CMS overall rating Info CMS (the Centers for Medicare & Medicaid Services) is the federal agency that rates nursing home quality. Its Overall Rating runs from 1 to 5 stars, combining health inspections, staffing, and quality measures, with inspections weighted most heavily.
Calculator: See prices in your area
North Cape Center accepts Medicare, Medicaid, and private pay.

Overview of North Cape Center

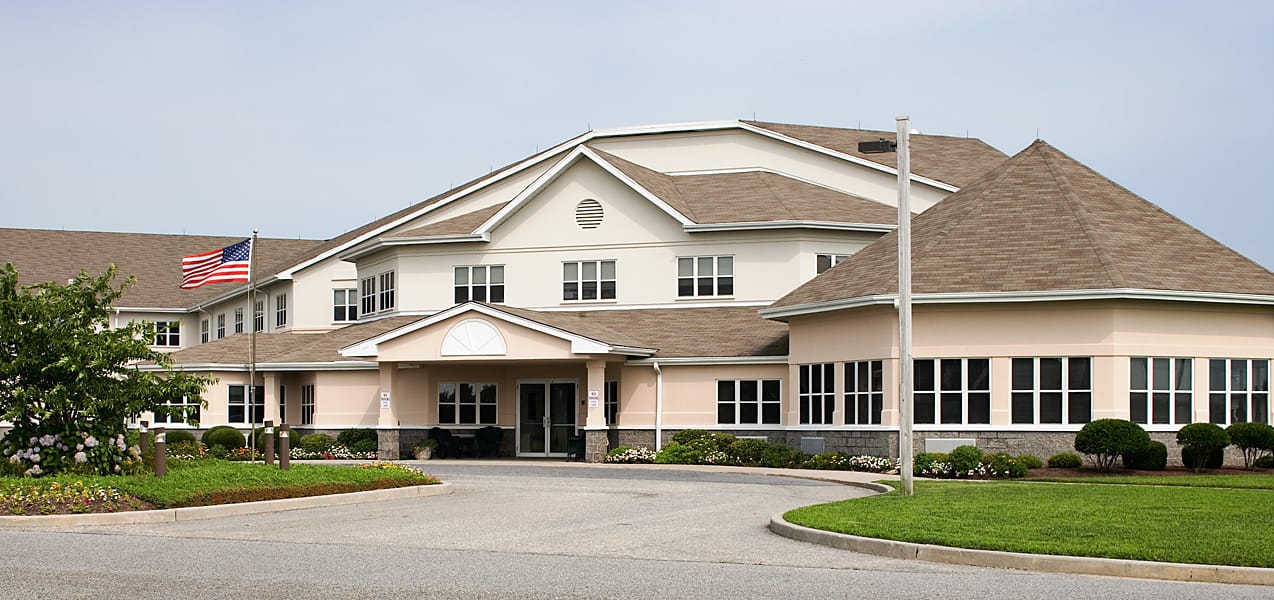
North Cape Center is a 120-bed skilled nursing facility operated by private company 700 Town Bank Road Operations LLC at 700 Town Bank Road in North Cape May, Cape May County, New Jersey. The facility provides skilled nursing, memory care, and respite services. Medicare, Medicaid, and private pay are welcome.

CMS rates the facility 3 stars, with a staffing sub-rating 35.5 percent below New Jersey average, the score’s defining drag. Nurse hours run 3h 12m per resident per day, 18 percent below state average of 3h 55m, placing the facility 230th of 274 New Jersey SNFs. Across inspections since 2021, the facility averaged 13.3 deficiencies annually, 156 percent above the 5.2 state average, with recurring citations for failing to meet New Jersey’s minimum staffing ratios cited in 2021, 2023, and 2025. The latest inspection in November 2025 found no deficiencies, suggesting recent improvement. No fines or immediate jeopardy findings exist. Occupancy stands at 100 percent, well above New Jersey’s 77 percent average, indicating strong local demand and limited availability. The second-floor secured unit serves memory care residents.

With full occupancy that reflects high local demand, the community in Cape May County is oriented toward residents seeking skilled nursing or memory care.

(609) 898-8899

Quality ratings

Measured by Centers for Medicare & Medicaid Services (CMS)

Overall rating Info The Overall CMS Rating combines results from health inspections, staffing levels and quality measures. Health inspections carry the most weight. Staffing and quality scores can increase or decrease the final rating based on performance compared to state and national standards.
▼ 8.0% Below NJ avg. ▼ 8.0% Below NJ avg.NJ average: 3.3Click the badge to see the full State ranking.Click here to see the full State ranking.
Health Inspection Info Based on the results of the facility's three most recent standard inspections and any complaint investigations. CMS reviews the number, scope, and severity of deficiencies, with more recent findings weighted more heavily.
▲ 8.0% Above NJ avg. ▲ 8.0% Above NJ avg.NJ average: 2.8Click the badge to see the full State ranking.Click here to see the full State ranking.
Staffing Info Measures average nursing staff hours per resident per day, including Registered Nurses (RNs) and total nursing staff. Ratings are adjusted based on the level of care residents require and are compared to state and national benchmarks.
At NJ avg. At NJ avg.NJ average: 3.0Click the badge to see the full State ranking.Click here to see the full State ranking.
Quality Measures Info Based on clinical and physical health indicators reported to CMS, such as hospital readmissions, falls, pressure ulcers, and improvements in mobility. These measures reflect how well residents' health needs are being managed.
▼ 7.1% Below NJ avg. ▼ 7.1% Below NJ avg.NJ average: 4.3Click the badge to see the full State ranking.Click here to see the full State ranking.

Staffing hours breakdown

Info Daily nursing hours per resident by staff type, reported to CMS. Higher is generally better — compare this facility to state and national averages to see where staffing stands.

Hours per resident per day — compared to New Jersey state averages

Total nursing care / resident Info This home is ranked 244th out of 294 homes in New Jersey for nurse hours. Total adjusted nursing hours per resident per day, combining RN, LPN, and aide time. CMS adjusts this for case-mix so facilities can be fairly compared.
3h 12m per day
Rank #244 / 294Nurse hours — State benchmarkedThis home is ranked 244th out of 294 homes in New Jersey. Shows adjusted nurse hours per resident per day benchmarked to the New Jersey average, with a ranking across 294 New Jersey facilities. More hours mean more direct care. The national average is about 3.5 hrs; below 3.0 is a red flag.Rankings are based only on facilities in New Jersey that report data for that category. Facilities without available data are excluded from the ranking.Click the rank badge to see the full State ranking.Click here to see the full State ranking.
This facility New Jersey avg (3h 53m per day)
vs New Jersey avg
-17%

4 of 6 metrics below state avg

Standout metric Physical Therapist is +47% above state avg
Staff typeHours / Day / Residentvs state avg
Registered Nurse (RN) Info RNs hold the highest nursing license and can assess residents, interpret test results, and direct care plans. More RN hours per day often signals stronger clinical oversight and faster response to health changes. 37m per day ▼ 9% State avg: 41m per day · National avg: 41m per day
LPN / LVN Info Licensed Practical Nurses (LPNs) or Licensed Vocational Nurses (LVNs) deliver routine hands-on care — medication administration, wound dressing, and monitoring vital signs. They work under RN supervision and make up a large share of daily bedside care. 1h 2m per day ▲ 10% State avg: 56m per day · National avg: 52m per day
Nurse Aide Info Certified Nurse Aides (CNAs) provide the most direct day-to-day assistance: bathing, dressing, feeding, and mobility. Nurse aide hours are typically the largest staffing category and directly affect residents' quality of life. 1h 41m per day ▼ 25% State avg: 2h 14m per day · National avg: 2h 20m per day
Weekend Total Nursing Info Combined nursing hours (RN + LPN + Nurse Aide) per resident per day on weekends. Staffing often drops on weekends — this figure reveals whether the facility maintains adequate coverage outside of weekday hours. 3h 4m per day ▼ 11% State avg: 3h 27m per day · National avg: 3h 26m per day
Physical Therapist Info Hours per resident per day provided by licensed Physical Therapists (PTs) or PT Assistants. PT services help residents recover mobility after injury or illness and are especially important for post-acute (short-stay) rehabilitation. 9m per day ▲ 47% State avg: 6m per day · National avg: 4m per day
Weekend RN Info Registered nurse hours specifically on weekends. Facilities sometimes reduce RN presence on Saturdays and Sundays — a low weekend RN figure compared to weekday hours can indicate reduced clinical oversight when most administrative staff are absent. 15m per day ▼ 47% State avg: 29m per day · National avg: 28m per day

Capacity and availability

Avg. Length of Stay
96 days
Bed community size
120-bed community Rank #236 / 561Bed count — State benchmarkedThis home is ranked 236th out of 561 homes in New Jersey. Shows this facility's certified or reported bed count compared to other New Jersey facilities. Larger communities may offer more amenities, programs, and on-site services for residents and families.Rankings are based only on facilities in New Jersey that report data for that category. Facilities without available data are excluded from the ranking.Click the rank badge to see the full State ranking.Click here to see the full State ranking.
A larger shared setting that may offer more common spaces and organized community services.
Walk Score
Walk Score: 20 / 100 Rank #521 / 640Walk Score — State benchmarkedThis home is ranked 521st out of 640 homes in New Jersey. Shows how walkable this facility's neighborhood is compared to the average Walk Score across New Jersey facilities. Higher scores benefit residents, families, and staff.Rankings are based only on facilities in New Jersey that report data for that category. Facilities without available data are excluded from the ranking.Click the rank badge to see the full State ranking.Click here to see the full State ranking.
Car-dependent. Most errands require a car, with limited nearby walkable options.

About this community

Occupancy

Occupancy rate
100%
Rank #185 / 496Occupancy rate — State benchmarkedThis home is ranked 185th out of 496 homes in New Jersey. Shows this facility's occupancy rate versus the New Jersey average, with its Statewide rank out of 496. Higher occupancy signals strong local demand and financial stability.Rankings are based only on facilities in New Jersey that report data for that category. Facilities without available data are excluded from the ranking.Click the rank badge to see the full State ranking.Click here to see the full State ranking.
Higher than the New Jersey average: 77%
Occupied beds
120 / 120
Average occupied beds in New Jersey homes 119 beds

License Details

Facility TypeLong Term Care Facility
StatusActive
License Number62200
CMS Certification Number315350

Ownership & Operating Entity

North Cape Center is administered by Ms. Jennifer Hess.

Owner Name700 Town Bank Road Operations LLC

Contact North Cape Center

Inspection History

In New Jersey, the Department of Health, Health Facilities Evaluation and Licensing conducts mandatory unannounced surveys to ensure facilities provide safe and effective resident care.

Since 2020 · 6 years of data 53 deficiencies 9 inspections

Inspection Scorecard Info This scorecard compares key inspection, citation, and complaint metrics at this facility against the New Jersey state average. Metrics rated ≥15% worse than average are highlighted in red; those ≥15% better are highlighted in green.

Since 2020 vs. New Jersey state average
Overall vs. NJ average 3 Worse Metrics worse than New Jersey average:
• Total deficiencies (194% above)
• Deficiencies per year (193% above)
• Deficiencies per inspection (195% above)
1 At Avg Metrics at New Jersey average:
• Total inspections (at NJ avg)
0 Better No metrics in this bucket.
Latest Inspection November 19, 2025

Deficiencies Info Deficiencies are formal regulatory issues recorded during state inspections.

This FacilityNJ Averagevs. NJ Avg
Total deficiencies Info Formal regulatory issues recorded by inspectors across all inspection types. 5318 This facility has 194% more total deficiencies than a typical New Jersey nursing home (53 vs. NJ avg 18).↑ 194% worse
Deficiencies per year Info Average deficiencies per year since 2020. 8.83 This facility has 193% more deficiencies per year than a typical New Jersey nursing home (8.8 vs. NJ avg 3).↑ 193% worse
Deficiencies per inspection Info Average deficiencies per inspection. 5.92 This facility has 195% more deficiencies per inspection than a typical New Jersey nursing home (5.9 vs. NJ avg 2).↑ 195% worse

Inspections Info State inspections evaluate whether the facility meets health and safety standards.

This FacilityNJ Averagevs. NJ Avg
Total inspections Info Combined count of all routine and focused inspections. Excludes complaint investigations. 99 This facility has total inspections in line with the New Jersey average (9 vs. NJ avg 9).— At avg

Inspection Reports Summary Info An editor-reviewed summary of the themes and findings across this facility's recent inspection reports.

  • The most recent inspection on March 7, 2025, cited 9 deficiencies but no immediate jeopardy was found.
  • Deficiencies repeatedly involved failure to resolve resident grievances, inadequate care planning, infection control lapses, staffing shortages, and life safety code violations.
  • Complaint investigations in March 2025 substantiated grievances not being resolved and consistent late meal service causing resident dissatisfaction.

Health Inspection History

Inspections since 2021
Total health inspections 3

New Jersey average 4


Last Health inspection on Mar 2025

Total health citations
19 Rank #140 / 296Health citations — State benchmarkedThis home is ranked 140th out of 296 homes in New Jersey. Shows this facility's total health deficiency citations benchmarked to the New Jersey State average, with a ranking across all 296 NJ facilities. Lower citation counts earn a better rank.Rankings are based only on facilities in New Jersey that report data for that category. Facilities without available data are excluded from the ranking.Click the rank badge to see the full State ranking.Click here to see the full State ranking.

New Jersey average 20.9

Citations per inspection
6.33 Rank #210 / 296Citations per inspection — State benchmarkedThis home is ranked 210th out of 296 homes in New Jersey. Shows average deficiency citations per CMS inspection for this facility versus the New Jersey mean across 296 facilities with citation data. Lower is better.Rankings are based only on facilities in New Jersey that report data for that category. Facilities without available data are excluded from the ranking.Click the rank badge to see the full State ranking.Click here to see the full State ranking.

New Jersey average 5.35


Health citations are formal notices following inspections when they fail to comply with safety and care standards.

12 of 19 citations resulted from standard inspections; and 7 of 19 came from combined inspections (standard and complaint).

Breakdown of citation severity (last 5 years)
Critical health citations
0
100% better than New Jersey average

New Jersey average: 0.7


Serious health citations
0
100% better than New Jersey average

New Jersey average: 0.4

0 critical citations New Jersey average: 0.7

0 serious citations New Jersey average: 0.4

19 moderate citations New Jersey average: 19.3

0 minor citations New Jersey average: 0.5
Citations history (last 5 years)
Infection Control moderate citation Mar 07, 2025
Corrected

Nutrition moderate citation Mar 07, 2025
Corrected

Quality of Care moderate citation Mar 07, 2025
Corrected

Quality of Care moderate citation Mar 07, 2025
Corrected

Staffing Data

Reporting period: October 1 – December 31, 2025 (Q4 2025). Source: CMS Payroll-Based Journal report.

Total staff 124
Employees 106
Contractors 18
Staff to resident ratio 1.22 : 1
32% fewer staff per resident than New Jersey average
New Jersey average ratio: 1.79 : 1 New Jersey average ratio: 1.79 : 1See full New Jersey ranking
Avg staff/day 44
Average shift 8 hours
0% compared with New Jersey average
New Jersey average: 8 hours New Jersey average shift: 8 hoursSee full New Jersey ranking
Total staff hours (quarter) 32,401

Nursing staff breakdown

Q4 2025 · Oct 1 – Dec 31 More info This data comes from the CMS Payroll-Based Journal report covering October 1 – December 31, 2025.
Registered Nurse

Manages medical care and health needs.

RN Staff Info All 11 RN Staff are full-time employees. No contractors work on this role. 11
Average shift length Info Average shift length. Calculated as total hours divided by days worked and average staff per day. 7.6 hours
Licensed Practical Nurse

Assists with medical care and medications.

LPN Staff Info 23 total: 21 full-time employees and 2 contractors. 23
Average shift length Info Average shift length. Calculated as total hours divided by days worked and average staff per day. 8.2 hours
Certified Nursing Assistant

Helps with daily care and mobility.

CNA Staff Info 44 total: 35 full-time employees and 9 contractors. 44
Average shift length Info Average shift length. Calculated as total hours divided by days worked and average staff per day. 9 hours

Contractor staffing

Q4 2025 · Oct 1 – Dec 31 More info This data comes from the CMS Payroll-Based Journal report covering October 1 – December 31, 2025.

Total hours from contractors

4.1%

1,329 contractor hours this quarter

Certified Nursing Assistant: 9 Occupational Therapy Assistant: 5 Licensed Practical Nurse: 2 Respiratory Therapy Technician: 1 Occupational Therapy Aide: 1

Staff by category

Q4 2025 · Oct 1 – Dec 31 More info This data comes from the CMS Payroll-Based Journal report covering October 1 – December 31, 2025.
Certified Nursing Assistant3594413,38192100%9
Licensed Practical Nurse212238,17192100%8.2
Registered Nurse110113,62292100%7.6
Respiratory Therapy Technician8191,1717278%7.7
Other Dietary Services Staff3031,1429199%7.5
Physical Therapy Aide7071,0057784%6.4
Clinical Nurse Specialist2028506470%8.1
Physical Therapy Assistant5055246975%7.2
Administrator3034966166%7.6
Other Social Services Staff1014706065%7.8
Nurse Practitioner1014646065%7.7
Mental Health Service Worker1014565762%8
Occupational Therapy Aide0112704246%6.4
Speech Language Pathologist3031762527%7
Qualified Social Worker4041423538%3.9
Occupational Therapy Assistant055313639%0.8
Medical Director101314145%0.8
44 Certified Nursing Assistant
% of Days 100%
23 Licensed Practical Nurse
% of Days 100%
11 Registered Nurse
% of Days 100%
9 Respiratory Therapy Technician
% of Days 78%
3 Other Dietary Services Staff
% of Days 99%
7 Physical Therapy Aide
% of Days 84%
2 Clinical Nurse Specialist
% of Days 70%
5 Physical Therapy Assistant
% of Days 75%
3 Administrator
% of Days 66%
1 Other Social Services Staff
% of Days 65%
1 Nurse Practitioner
% of Days 65%
1 Mental Health Service Worker
% of Days 62%
1 Occupational Therapy Aide
% of Days 46%
3 Speech Language Pathologist
% of Days 27%
4 Qualified Social Worker
% of Days 38%
5 Occupational Therapy Assistant
% of Days 39%
1 Medical Director
% of Days 45%

Penalties and fines

Federal penalties imposed by CMS for regulatory violations, including civil money penalties (fines) and denials of payment for new Medicare/Medicaid admissions.

Source: CMS Penalties Database

No penalties in the past 3 years

No civil money penalties or payment denials were reported in the last 3 years.

Quality of care over time

These measures show how residents usually do over time at this home, based on health outcomes and preventive care.

High-risk clinical events score Info A composite score based on pressure ulcers, falls with injury, weight loss, walking ability decline, and activities of daily living decline. 11.2
65% worse than New Jersey average

New Jersey average: 6.8

Functional decline score Info A composite score based on activities of daily living decline, walking ability decline, and incontinence. 23.1
85% worse than New Jersey average

New Jersey average: 12.4

Long-stay resident measures
Significantly above average New Jersey avg: 4.5 Info CMS star rating based on long-stay quality measure performance. 5 stars = significantly above average, 1 star = significantly below average.
Need for Help with Daily Activities Increased Info Percent of long-stay residents whose need for help with daily activities has increased 15.7%
56% worse than New Jersey average

New Jersey average: 10.1%

Walking Ability Worsened Info Percent of long-stay residents whose ability to move independently worsened 20.4%
85% worse than New Jersey average

New Jersey average: 11.0%

Low Risk Residents with Bowel/Bladder Incontinence Info Percent of low risk long-stay residents who lose control of their bowels or bladder 33.1%
108% worse than New Jersey average

New Jersey average: 16.0%

Falls with Major Injury Info Percent of long-stay residents experiencing one or more falls with major injury 4.4%
81% worse than New Jersey average

New Jersey average: 2.4%

High Risk Residents with Pressure Ulcers Info Percent of long-stay high risk residents with pressure ulcers 8.1%
33% worse than New Jersey average

New Jersey average: 6.1%

Urinary Tract Infection Info Percent of long-stay residents with a urinary tract infection 2.1%
119% worse than New Jersey average

New Jersey average: 1.0%

Lost Too Much Weight Info Percent of long-stay residents who lose too much weight 7.4%
60% worse than New Jersey average

New Jersey average: 4.6%

Depressive Symptoms Info Percent of long-stay residents who have depressive symptoms 13.8%
22% worse than New Jersey average

New Jersey average: 11.3%

Antipsychotic Use Info Percent of long-stay residents who received an antipsychotic medication 9.9%
11% better than New Jersey average

New Jersey average: 11.1%

Pneumococcal Vaccine Info Percent of long-stay residents assessed and appropriately given the pneumococcal vaccine 99.7%
7% better than New Jersey average

New Jersey average: 93.0%

Influenza Vaccine Info Percent of long-stay residents assessed and appropriately given the seasonal influenza vaccine 98.8%
In line with New Jersey average

New Jersey average: 97.2%

Hospitalizations per 1,000 days Info Number of hospitalizations per 1,000 long-stay resident days. 1.53
26% better than New Jersey average

New Jersey average: 2.08

ED visits per 1,000 days Info Number of outpatient emergency department visits per 1,000 long-stay resident days. 0.63
44% better than New Jersey average

New Jersey average: 1.12

Short-stay resident measures
Significantly above average New Jersey avg: 3.8 Info CMS star rating based on short-stay quality measure performance. 5 stars = much above average, 1 star = much below average.
Pneumococcal Vaccine Info Percent of short-stay residents assessed and appropriately given the pneumococcal vaccine 98.7%
25% better than New Jersey average

New Jersey average: 78.9%

Antipsychotic medication increase Info Percent of short-stay residents who newly received an antipsychotic medication 2.2%
92% worse than New Jersey average

New Jersey average: 1.2%

Influenza Vaccine Info Percent of short-stay residents assessed and appropriately given the seasonal influenza vaccine 98.1%
22% better than New Jersey average

New Jersey average: 80.1%

Re-hospitalized after SNF stay Info Percentage of short-stay residents who were re-hospitalized after their nursing home admission. 26.4%
In line with New Jersey average

New Jersey average: 25.4%

Emergency department visits Info Percentage of short-stay residents who had an outpatient emergency department visit. 6.6%
20% better than New Jersey average

New Jersey average: 8.2%

Falls with major injury Info Percentage of SNF residents who experience falls with major injury during their stay. 1.0%
35% worse than New Jersey average

New Jersey average: 0.8%

Ability to care for self at discharge Info Percentage of residents at or above expected ability to care for themselves at discharge. 67.2%
25% better than New Jersey average

New Jersey average: 53.7%

Successful return to home or community Info Rate of successful return to home or community from a skilled nursing facility. 57.7%
14% better than New Jersey average

New Jersey average: 50.6%

Breakdown by payment type

Medicare

55% of new residents, usually for short-term rehab.

Typical stay 1 months

Private pay

40% of new residents, often for short stays.

Typical stay 1 - 2 months

Medicaid

4% of new residents, often for long-term daily care.

Typical stay 4 years

Facility Characteristics

Source: CMS Long-Term Care Facility Characteristics (Data as of Jan 2026)

Total residents 102
Medicare
29
28.4% of residents
Medicaid
54
52.9% of residents
Private pay or other
19
18.6% of residents
Programs & Services
Residents Group

Residents meet regularly to discuss policies, care quality, and activities

Active Resident Council

Organized group of residents that meets regularly to discuss facility policies, quality of life, and activities.

Finances and operations

Based on CMS SNF Cost Report for fiscal year ending in 12/2023.

Voluntary non-profit community
Operated by a church.
Net patient revenue Info Net patient revenue — what the home actually collects for resident care, after contractual allowances, bad debt and discounts are subtracted from its gross charges (CMS cost report, Worksheet G-3). It covers resident care only; money the home earns from other sources is shown separately as "Other income."
$13.9M
Net patient income Info Net patient income: net patient revenue minus the home's total operating expenses. A positive figure means it earns more from resident care than it spends to deliver it; a negative figure means the opposite. It excludes non-operating "other income."
$403.5K
Voluntary non-profit community Operated by a church.
Net patient revenue Info Net patient revenue — what the home actually collects for resident care, after contractual allowances, bad debt and discounts are subtracted from its gross charges (CMS cost report, Worksheet G-3). It covers resident care only; money the home earns from other sources is shown separately as "Other income."
$13.9M Rank #210 / 292Revenue — State benchmarkedThis home is ranked 210th out of 292 homes in New Jersey. Shows this facility's annual revenue compared to the New Jersey average. Higher revenue generally means more resources for staffing and capital — read alongside Payroll %.Rankings are based only on facilities in New Jersey that report data for that category. Facilities without available data are excluded from the ranking.Click the rank badge to see the full State ranking.Click here to see the full State ranking.
Net patient income Info Net patient income: net patient revenue minus the home's total operating expenses. A positive figure means it earns more from resident care than it spends to deliver it; a negative figure means the opposite. It excludes non-operating "other income."
$403.5K
Other income Info Money the home earns outside of resident care — such as investments, grants, rentals and other non-operating sources (CMS cost report, Worksheet G-3). It is tracked separately from net patient revenue: it is not part of that figure, and it is not included in net patient income.
$37.0K
Payroll costs Info Staff salaries plus wage-related costs — benefits such as payroll taxes, health insurance and retirement — from the home's own accounting records (CMS cost report, Worksheet A). Contract or agency labor is counted separately, under other operating costs. Rank #168 / 292Payroll — State benchmarkedThis home is ranked 168th out of 292 homes in New Jersey. Shows total annual staff payroll benchmarked to the New Jersey average. Higher payroll investment relative to peers often signals better staffing and less reliance on cheaper contract labor.Rankings are based only on facilities in New Jersey that report data for that category. Facilities without available data are excluded from the ranking.Click the rank badge to see the full State ranking.Click here to see the full State ranking.
$6.0M 43.3% of net patient revenue Info Payroll as a share of revenue: staff salaries and wage-related benefits divided by net patient revenue. A higher figure means more of each revenue dollar goes to staff pay. Rank #43 / 292Payroll % — State benchmarkedThis home is ranked 43rd out of 292 homes in New Jersey. Shows payroll as a percentage of revenue versus the New Jersey average. Well-run New Jersey facilities typically land around 55–65% — the top third Statewide. Below 25% may signal understaffing or heavy agency use — read with Staffing ratings.Rankings are based only on facilities in New Jersey that report data for that category. Facilities without available data are excluded from the ranking.Click the rank badge to see the full State ranking.Click here to see the full State ranking.
Other operating costs Info Everything it costs to run the home apart from payroll — food, utilities, supplies, maintenance, contract labor and administration. Calculated as total operating expense minus payroll (staff salaries and wage-related benefits).
$7.5M
Total costs Info The home's total operating expense for the year — all the costs of running it, salaries included (CMS cost report, Worksheet G-3).
$13.5M

Who this home usually serves

TYPE OF STAY

Mostly short-term rehab stays

Most residents typically stay for a few weeks or months before returning home or moving on.

Most new residents arrive under Medicare (55% of admissions), and a typical Medicare stay runs around 1 months.

Admissions
408 total

Coverage residents most often arrive under.

Medicare 55%
Private pay 40%
Medicaid 4%
Discharges
407 total

Coverage residents most often leave under.

Medicare 48%
Private pay 39%
Medicaid 13%

Places of interest near North Cape Center

Address 4.3 miles from city center Info Estimated distance in miles from North Cape May's city center to North Cape Center's address, calculated via Google Maps.

Calculate Travel Distance to North Cape Center

Add your location

Address

Compare Nursing Homes around New Jersey

The information below is reported by the New Jersey Department of Health, Health Facilities Evaluation and Licensing.

5 facilities compared · CMS & NJ Dept. of Health data

Fellowship Village
NH
AL
HC
IL
MC
Basking Ridge
67
Facility 67
NJ AVG 125
Rank #471 / 561
86.6%
Facility 86.6%
NJ AVG 77%
Rank #157 / 496
+12%
5.83
Facility 5.83
NJ AVG 3.88
Rank #10 / 294
+57%+50%
$0
Facility $0
NJ AVG $76.4k
Rank #1 / 297
2
Facility 2
NJ AVG 20.9
Rank #1 / 296
1.0
Facility 1.0
NJ AVG 5.3
Rank #1 / 296
-58-
25
Facility 25
NJ AVG 47
Rank #477 / 640
Brian Lawrence
$51.2M
Facility $51.2M
NJ AVG $19.6M
Rank #4 / 292
$21.7M
Facility $21.7M
NJ AVG $7.1M
Rank #8 / 292
42.4%
Facility 42.4%
NJ AVG 39.3%
Rank #281 / 292
315356
Brighton Gardens of Edison
NH
AL
HC
MC
Edison (Oak Tree Road)
118
Facility 118
NJ AVG 125
Rank #288 / 561
90.5%
Facility 90.5%
NJ AVG 77%
Rank #93 / 496
+18%
4.90
Facility 4.90
NJ AVG 3.88
Rank #28 / 294
+93%+26%
$33.4k
Facility $33.4k
NJ AVG $76.4k
Rank #224 / 297
17
Facility 17
NJ AVG 20.9
Rank #113 / 296
8.5
Facility 8.5
NJ AVG 5.3
Rank #274 / 296
125A+
64
Facility 64
NJ AVG 47
Rank #198 / 640
Tracey Borges
$14.5M
Facility $14.5M
NJ AVG $19.6M
Rank #180 / 292
$7.7M
Facility $7.7M
NJ AVG $7.1M
Rank #203 / 292
53.2%
Facility 53.2%
NJ AVG 39.3%
Rank #212 / 292
315351
Complete Care at Woodlands
NH
AL
IL
MC
Plainfield (Woodland Avenue)
120
Facility 120
NJ AVG 125
Rank #236 / 561
--
3.79
Facility 3.79
NJ AVG 3.88
Rank #111 / 294
-43%-2%
$0
Facility $0
NJ AVG $76.4k
Rank #1 / 297
15
Facility 15
NJ AVG 20.9
Rank #87 / 296
3.0
Facility 3.0
NJ AVG 5.3
Rank #41 / 296
-7-
39
Facility 39
NJ AVG 47
Rank #368 / 640
Pc Holdings 2 LLC
$14.0M
Facility $14.0M
NJ AVG $19.6M
Rank #205 / 292
$6.9M
Facility $6.9M
NJ AVG $7.1M
Rank #193 / 292
49.7%
Facility 49.7%
NJ AVG 39.3%
Rank #114 / 292
315273
Arbor Ridge Rehabilitation & Healthcare Center
NH
AL
IL
MC
Wayne (Pines Lake)
120
Facility 120
NJ AVG 125
Rank #236 / 561
89.2%
Facility 89.2%
NJ AVG 77%
Rank #115 / 496
+16%
3.41
Facility 3.41
NJ AVG 3.88
Rank #197 / 294
+72%-12%
$0
Facility $0
NJ AVG $76.4k
Rank #1 / 297
17
Facility 17
NJ AVG 20.9
Rank #113 / 296
5.7
Facility 5.7
NJ AVG 5.3
Rank #183 / 296
-108-
26
Facility 26
NJ AVG 47
Rank #461 / 640
Quinto Delta LLC
$15.2M
Facility $15.2M
NJ AVG $19.6M
Rank #184 / 292
$7.7M
Facility $7.7M
NJ AVG $7.1M
Rank #182 / 292
50.4%
Facility 50.4%
NJ AVG 39.3%
Rank #148 / 292
315234
North Cape Center
NH
AL
North Cape May (North Wildwood)
120
Facility 120
NJ AVG 125
Rank #236 / 561
100.0%
Facility 100.0%
NJ AVG 77%
Rank #185 / 496
+30%
3.21
Facility 3.21
NJ AVG 3.88
Rank #244 / 294
-4%-17%
$0
Facility $0
NJ AVG $76.4k
Rank #1 / 297
19
Facility 19
NJ AVG 20.9
Rank #140 / 296
6.3
Facility 6.3
NJ AVG 5.3
Rank #210 / 296
-144-
20
Facility 20
NJ AVG 47
Rank #521 / 640
-
$13.9M
Facility $13.9M
NJ AVG $19.6M
Rank #210 / 292
$6.0M
Facility $6.0M
NJ AVG $7.1M
Rank #168 / 292
43.3%
Facility 43.3%
NJ AVG 39.3%
Rank #43 / 292
315350

Financial Assistance for
Nursing Home in New Jersey

North Cape Center is located in North Cape May, New Jersey.
Here are the financial assistance programs available to residents in New Jersey.

Get Financial aid guidance

Managed Long Term Services and Supports

NJ Medicaid MLTSS

Age 65+ or disabled
General New Jersey resident, Medicaid- eligible, nursing home-level care need.
Income Limits (2025) ~$2,829/month 300% FBR, individual
Asset Limits $2,000 (individual), $3,000 (couple).
NJ

High urban demand; managed care model.

Benefits
In-home care (5-7 hours/day) Assisted living Respite (240 hours/year) Medical services

JACC (Jersey Assistance for Community Caregiving)

NJ JACC

Age 60+
General New Jersey resident, at risk of nursing home.
Income Limits ~$2,500/month individual, varies
Asset Limits $40,000 individual
NJ

Higher asset limit; limited funding.

Benefits
In-home care (3-5 hours/week) Respite (up to 10 days/year) Home modifications (~$1,000 avg.)

Pharmaceutical Assistance to the Aged and Disabled (PAAD)

New Jersey PAAD

Age 65+
General NJ resident, enrolled in Medicare Part D or eligible.
Income Limits (2025) ~$42,142/year (individual), ~$49,209/year (couple).
Asset Limits Not assessed.
NJ

Copays $5 (generic), $7 (brand); covers Part D premiums up to benchmark.

Benefits
Prescription cost reduction ($500-$1,000/year savings) Premium assistance ($20/month above benchmark)

Senior Gold Prescription Discount Program

New Jersey Senior Gold

Age 65+
General NJ resident, enrolled in Medicare Part D or eligible.
Income Limits (2025) ~$42,142-$52,142/year (individual), ~$49,209-$59,209/year (couple).
Asset Limits Not assessed.
NJ

Copays $15 + 50% of remaining cost; no premium assistance.

Benefits
Prescription cost reduction (~$300-$800/year savings)

Medicare Savings Program (MSP)

New Jersey Medicare Savings Program

Age 65+ or disabled
General NJ resident, Medicare Part A/B.
Income Limits (2025) ~$2,510/month (QMB), ~$3,380/month (SLMB), ~$3,598/month (QI)—individual.
Asset Limits $9,430 (individual), $14,130 (couple).
NJ

Three tiers; no waitlist; includes Extra Help for Part D.

Benefits
Covers Part B premiums ($174.70/month) Deductibles ($240/year) Copays (~20%)

Senior Freeze (Property Tax Reimbursement)

New Jersey Senior Freeze

Age 65+ by Dec 31 prior year
General NJ resident, homeowner, paid property taxes.
Income Limits (2025) ~$150,000/year combined household, projected
Asset Limits Not assessed; home ownership required.
NJ

Combines with ANCHOR/Stay NJ via PAS-1; annual application.

Benefits
Tax reimbursement (~$500-$2,000/year) for increases since base year

ANCHOR (Affordable NJ Communities for Homeowners and Renters)

New Jersey ANCHOR

Age 65+ prioritized
General NJ resident, homeowner/renter, paid property taxes/rent.
Income Limits (2025) ~$150,000/year (homeowners), ~$75,000/year (renters).
Asset Limits Not assessed.
NJ

Combines with Senior Freeze/Stay NJ; broader than prior Homestead program.

Benefits
Tax relief (~$700-$1,500/year homeowners, ~$250-$450 renters)

Stay NJ

New Jersey Stay NJ

Age 65+ by Dec 31 prior year
General NJ resident, homeowner, lived in home 10+ years.
Income Limits (2025) ~$500,000/year projected, subject to final regs
Asset Limits Not assessed; home ownership required.
NJ

Up to 50% tax credit (max $6,500); phased implementation.

Benefits
Tax credit (~$3,000-$6,500/year, projected) starting 2026

Universal Service Fund (USF)

New Jersey Universal Service Fund

Age 65+ prioritized
General NJ resident, utility customer, low-income.
Income Limits (2025) ~$3,970/month individual, 185% FPL
Asset Limits Not assessed; income-focused.
NJ

Must owe >$25 on bill; combines with LIHEAP if eligible.

Benefits
Bill credits (~$300-$1,500/year) to cap energy costs at 6% of income

NJ Family Caregiver Support Program (via NFCSP)

New Jersey Family Caregiver Support Program

Age
General Caregivers of 60+ needing care or 55+ caregivers of others; NJ resident; functional needs (2+ ADLs).
Income Limits (2025) Prioritizes ~$24,980/year (individual); no strict cap.
Asset Limits Not assessed; need-based.
NJ

21 AAAs; rural/low-income priority.

Benefits
Respite (4-6 hours/week or 5 days/year) Adult day care ($60/day) Training Supplies (~$500/year)

VA Aid and Attendance (A&A) and Housebound Benefits

New Jersey VA Aid and Attendance/Housebound

Age 65+ or disabled veteran/spouse
General NJ resident, wartime service, need for ADL help (A&A) or homebound.
Income Limits (2025) Net income < ~$1,984/month (veteran with dependent, A&A); pension offsets income.
Asset Limits ~$155,356 net worth limit
NJ

High veteran demand in urban/rural areas.

Benefits
Cash (~$1,433-$2,642/month veteran, ~$951-$1,318 spouse) for care costs (e.g., in-home, assisted living)

Frequently Asked Questions about North Cape Center

What neighborhood is North Cape Center in?

North Cape Center is in the North Wildwood neighborhood of North Cape May.

Who is the owner of North Cape Center?

The legal owner and operator of North Cape Center is 700 Town Bank Road Operations Llc.

Is North Cape Center in a walkable area?

North Cape Center has a walk score of 20. Car-dependent. Most errands require a car, with limited nearby walkable options.

What is the license number of North Cape Center?

According to NJ state health department records, North Cape Center's license number is 62200.

What is the occupancy rate at North Cape Center?

North Cape Center's occupancy is 100%.

Who is the administrator of North Cape Center?

Ms. JENNIFER HESS is the administrator of North Cape Center.

How many beds does North Cape Center have?

North Cape Center has 120 beds.

Guides for Better Senior Living

Care Cost Calculator: See Prices in Your Area

Nursing Home Data Explorer

Don’t Wait Too Long: 7 Red Flag Signs Your Parent Needs Assisted Living Now

The True Cost of Assisted Living in 2025 – And How Families Are Paying For It

Understanding Senior Living Costs: Pricing Models, Discounts & Financial Assistance