Ohman Family Living at Holly, a CCRC
Nursing Home, Assisted Living, Home Care, Hospice Care, Memory Care & Palliative Care · Newbury Township, OH
CMS overall rating Info CMS (the Centers for Medicare & Medicaid Services) is the federal agency that rates nursing home quality. Its Overall Rating runs from 1 to 5 stars, combining health inspections, staffing, and quality measures, with inspections weighted most heavily.

Ohman Family Living at Holly, a CCRC

Nursing Home, Assisted Living, Home Care, Hospice Care, Memory Care & Palliative Care · Newbury Township, OH
CMS overall rating Info CMS (the Centers for Medicare & Medicaid Services) is the federal agency that rates nursing home quality. Its Overall Rating runs from 1 to 5 stars, combining health inspections, staffing, and quality measures, with inspections weighted most heavily.
Calculator: See prices in your area
Ohman Family Living at Holly, a CCRC accepts Medicare, Medicaid, and private pay.

Overview of Ohman Family Living at Holly, a Ccrc

We are called to serve those entrusted to us at Ohman Family Living at Holly, a family-owned and managed community in Geauga County since 1965. Our expertise and longevity ensure that every resident experiences many levels of care from one trusted caregiver, allowing seamless transitions from post-hospital recovery to home health care, assisted living, memory care, or long-term care—all while remaining in a comforting, familiar place that feels like home.

Our healthcare keeps loved ones feeling right at home, specializing in conditions that often lead to hospital readmissions, including COPD, congestive heart failure, renal care, wound care, sepsis, and pneumonia (respiratory). With state-of-the-art ventilator services for high-acuity respiratory patients, a cutting-edge therapy gym, spacious dining rooms, and private rooms, we staff to the acuity of each individual, providing skilled attention to accelerate recovery. As a preferred provider of Cleveland Clinic and University Hospitals, we partner with ambulance services to gently relocate residents, preventing illnesses from becoming catastrophic.

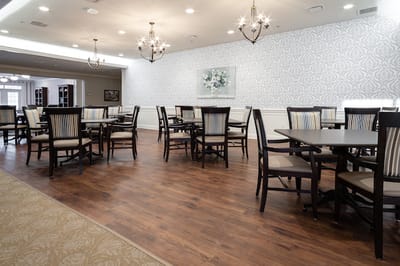
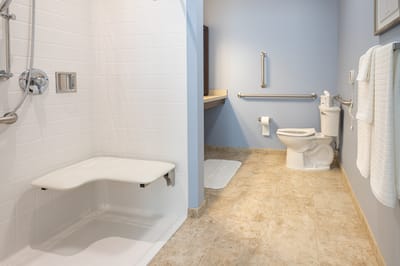
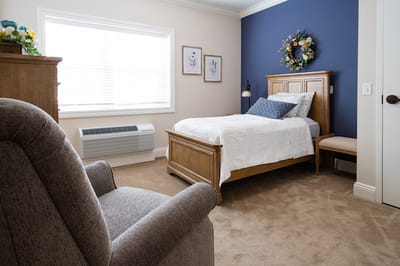
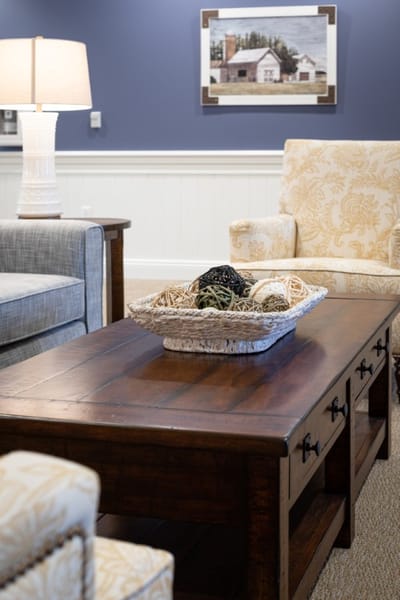
Assisted living at Ohman Family Living at Holly truly feels like home, offering safety, comfort, and the ability to age in place. Our spaces maximize natural light through large windows and doors overlooking thoughtfully designed courtyards and landscaping, creating a cozy atmosphere with fireplaces, soft colors, warm light, and Lake Erie-inspired accents. Residents enjoy fun and intellectually stimulating wellness programs, from cozy cafes to intimate lounges, all with immediate access to highly trained clinicians.

Our memory care is remarkably unique, where loved ones can function as they would at home, receiving tailored treatments in a safe, engaging environment. With spacious private suites, sensory engagement rooms, continuous walking paths, and specialized activities, we ensure compassion and respect for those with Alzheimer’s, dementia, and other memory deficits.

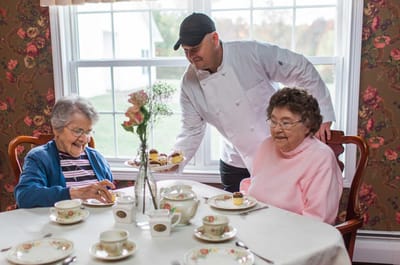
In long-term care, age in place comfortably as we love and serve you in a caring community where you feel at home. Our experienced team guides families through financial transitions, including Medicaid, veteran benefits, and long-term care insurance. Highly trained caregivers deliver comprehensive, personalized support, while vibrant activities like Fancy Nails, Bingo, Hollywood Trivia, arts and crafts, and gym sessions spark joy and foster connections. We invite residents back to the table with chef-prepared meals in elegant dining rooms, nurturing belonging and combating isolation.

Guided by a strong belief in the supremacy of love, our second- and third-generation Ohman family members, alongside a diversely skilled team, hold ourselves to a higher standard, creating a home-like environment that elevates compassion and quality of life.

Quality ratings

Measured by Centers for Medicare & Medicaid Services (CMS)

Overall rating Info The Overall CMS Rating combines results from health inspections, staffing levels and quality measures. Health inspections carry the most weight. Staffing and quality scores can increase or decrease the final rating based on performance compared to state and national standards.
Health Inspection Info Based on the results of the facility's three most recent standard inspections and any complaint investigations. CMS reviews the number, scope, and severity of deficiencies, with more recent findings weighted more heavily.
Staffing Info Measures average nursing staff hours per resident per day, including Registered Nurses (RNs) and total nursing staff. Ratings are adjusted based on the level of care residents require and are compared to state and national benchmarks.
Quality Measures Info Based on clinical and physical health indicators reported to CMS, such as hospital readmissions, falls, pressure ulcers, and improvements in mobility. These measures reflect how well residents' health needs are being managed.

Staffing hours breakdown

Info Daily nursing hours per resident by staff type, reported to CMS. Higher is generally better — compare this facility to state and national averages to see where staffing stands.

Hours per resident per day — compared to state averages

Staff typeHours / Day / Residentvs state avg
Registered Nurse (RN) Info RNs hold the highest nursing license and can assess residents, interpret test results, and direct care plans. More RN hours per day often signals stronger clinical oversight and faster response to health changes. 59m per day ▲ 56% State avg: 38m per day · National avg: 41m per day
LPN / LVN Info Licensed Practical Nurses (LPNs) or Licensed Vocational Nurses (LVNs) deliver routine hands-on care — medication administration, wound dressing, and monitoring vital signs. They work under RN supervision and make up a large share of daily bedside care. 49m per day ▼ 16% State avg: 58m per day · National avg: 52m per day
Nurse Aide Info Certified Nurse Aides (CNAs) provide the most direct day-to-day assistance: bathing, dressing, feeding, and mobility. Nurse aide hours are typically the largest staffing category and directly affect residents' quality of life. 1h 49m per day ▼ 15% State avg: 2h 8m per day · National avg: 2h 20m per day
Weekend Total Nursing Info Combined nursing hours (RN + LPN + Nurse Aide) per resident per day on weekends. Staffing often drops on weekends — this figure reveals whether the facility maintains adequate coverage outside of weekday hours. 3h 15m per day ■ Avg State avg: 3h 17m per day · National avg: 3h 26m per day
Physical Therapist Info Hours per resident per day provided by licensed Physical Therapists (PTs) or PT Assistants. PT services help residents recover mobility after injury or illness and are especially important for post-acute (short-stay) rehabilitation. 5m per day ▲ 68% State avg: 3m per day · National avg: 4m per day
Weekend RN Info Registered nurse hours specifically on weekends. Facilities sometimes reduce RN presence on Saturdays and Sundays — a low weekend RN figure compared to weekday hours can indicate reduced clinical oversight when most administrative staff are absent. 51m per day ▲ 103% State avg: 25m per day · National avg: 28m per day

Capacity and availability

This home usually has limited availability

Similar occupancy to the state average
Occupancy rate
90.9% Rank #62 / 211Occupancy rate — State benchmarkedThis home is ranked 62nd out of 211 homes in Ohio. Shows this facility's occupancy rate versus the Ohio average, with its Statewide rank out of 211. Higher occupancy signals strong local demand and financial stability.Rankings are based only on facilities in Ohio that report data for that category. Facilities without available data are excluded from the ranking.Click the rank badge to see the full State ranking.Click here to see the full State ranking.
Avg. Length of Stay
71 days
Bed community size
92-bed community Rank #104 / 323Bed count — State benchmarkedThis home is ranked 104th out of 323 homes in Ohio. Shows this facility's certified or reported bed count compared to other Ohio facilities. Larger communities may offer more amenities, programs, and on-site services for residents and families.Rankings are based only on facilities in Ohio that report data for that category. Facilities without available data are excluded from the ranking.Click the rank badge to see the full State ranking.Click here to see the full State ranking.
A larger shared setting that may offer more common spaces and organized community services.
Walk Score
Walk Score: 0 / 100 Rank #687 / 705Walk Score — State benchmarkedThis home is ranked 687th out of 705 homes in Ohio. Shows how walkable this facility's neighborhood is compared to the average Walk Score across Ohio facilities. Higher scores benefit residents, families, and staff.Rankings are based only on facilities in Ohio that report data for that category. Facilities without available data are excluded from the ranking.Click the rank badge to see the full State ranking.Click here to see the full State ranking.
Car-dependent. Most errands require a car, with limited nearby walkable options.

Payment & Insurance

2 services
Accept Medicaid
Accept Medicare

Therapy & Rehabilitation

3 services
Rehabilitation Services
Respite Care
Short-Term Rehab

Amenities & Lifestyle

Spacious Private Suites
Two-Room Suites With Sitting Area
In-Suite Kitchenette
Spacious Bathrooms With Built-In Safety Features
Beauty Salon And Barber
Gym/Exercise Room
Spa Room
Entertainment Room
Specialized Activities Center
Multi-Purpose Room
Sensory Engagement Rooms
Continuous Walking Path
Specific Meal Planning And Dining
Specific ProgramsPost-Hospital Recovery

Contact Ohman Family Living at Holly, a CCRC

Staffing Data

Reporting period: October 1 – December 31, 2025 (Q4 2025). Source: CMS Payroll-Based Journal report.

Total staff 347
Employees 103
Contractors 244
Staff to resident ratio 3.94 : 1
0% compared with State average

State average ratio: 0 : 0

Avg staff/day 54
Average shift 7.5 hours
0% compared with State average

State average: 0 hours

Total staff hours (quarter) 37,502

Nursing staff breakdown

Q4 2025 · Oct 1 – Dec 31 More info This data comes from the CMS Payroll-Based Journal report covering October 1 – December 31, 2025.
Registered Nurse

Manages medical care and health needs.

RN Staff Info 53 total: 25 full-time employees and 28 contractors. 53
Average shift length Info Average shift length. Calculated as total hours divided by days worked and average staff per day. 6.8 hours
Licensed Practical Nurse

Assists with medical care and medications.

LPN Staff Info 67 total: 18 full-time employees and 49 contractors. 67
Average shift length Info Average shift length. Calculated as total hours divided by days worked and average staff per day. 7.4 hours
Certified Nursing Assistant

Helps with daily care and mobility.

CNA Staff Info 174 total: 26 full-time employees and 148 contractors. 174
Average shift length Info Average shift length. Calculated as total hours divided by days worked and average staff per day. 7.2 hours

Contractor staffing

Q4 2025 · Oct 1 – Dec 31 More info This data comes from the CMS Payroll-Based Journal report covering October 1 – December 31, 2025.

Total hours from contractors

31.2%

11,701 contractor hours this quarter

Certified Nursing Assistant: 148 Licensed Practical Nurse: 49 Registered Nurse: 28 Physical Therapy Aide: 5 Speech Language Pathologist: 5 Respiratory Therapy Technician: 4 Qualified Social Worker: 3 Physical Therapy Assistant: 2

Staff by category

Q4 2025 · Oct 1 – Dec 31 More info This data comes from the CMS Payroll-Based Journal report covering October 1 – December 31, 2025.
Certified Nursing Assistant2614817414,30692100%7.2
Registered Nurse2528536,31692100%6.8
Licensed Practical Nurse1849675,96692100%7.4
Speech Language Pathologist2571,6747784%9.7
Other Dietary Services Staff6061,5557986%7.1
Physical Therapy Aide4591,4907986%9.2
Physical Therapy Assistant4261,2227885%8.7
Qualified Activities Professional7071,0478491%7.7
Clinical Nurse Specialist2029726470%8
Qualified Social Worker4377726672%10.3
Respiratory Therapy Technician2466647278%9
Administrator1015286672%8
Nurse Practitioner1015236571%8
RN Director of Nursing1014665560%8.5
174 Certified Nursing Assistant
% of Days 100%
53 Registered Nurse
% of Days 100%
67 Licensed Practical Nurse
% of Days 100%
7 Speech Language Pathologist
% of Days 84%
6 Other Dietary Services Staff
% of Days 86%
9 Physical Therapy Aide
% of Days 86%
6 Physical Therapy Assistant
% of Days 85%
7 Qualified Activities Professional
% of Days 91%
2 Clinical Nurse Specialist
% of Days 70%
7 Qualified Social Worker
% of Days 72%
6 Respiratory Therapy Technician
% of Days 78%
1 Administrator
% of Days 72%
1 Nurse Practitioner
% of Days 71%
1 RN Director of Nursing
% of Days 60%

Penalties and fines

Federal penalties imposed by CMS for regulatory violations, including civil money penalties (fines) and denials of payment for new Medicare/Medicaid admissions.

Source: CMS Penalties Database

No penalties in the past 3 years

No civil money penalties or payment denials were reported in the last 3 years.

Quality of care over time

These measures show how residents usually do over time at this home, based on health outcomes and preventive care.

High-risk clinical events score Info A composite score based on pressure ulcers, falls with injury, weight loss, walking ability decline, and activities of daily living decline. 6.0
In line with State average

State average: 5.8

Functional decline score Info A composite score based on activities of daily living decline, walking ability decline, and incontinence. 17.2
36% worse than State average

State average: 12.7

Long-stay resident measures
Significantly above average State avg: 4.7 Info CMS star rating based on long-stay quality measure performance. 5 stars = significantly above average, 1 star = significantly below average.
Need for Help with Daily Activities Increased Info Percent of long-stay residents whose need for help with daily activities has increased 10.9%
60% worse than State average

State average: 6.8%

Walking Ability Worsened Info Percent of long-stay residents whose ability to move independently worsened 12.6%
42% worse than State average

State average: 8.9%

Low Risk Residents with Bowel/Bladder Incontinence Info Percent of low risk long-stay residents who lose control of their bowels or bladder 28.0%
27% worse than State average

State average: 22.0%

Falls with Major Injury Info Percent of long-stay residents experiencing one or more falls with major injury 1.8%
48% better than State average

State average: 3.4%

High Risk Residents with Pressure Ulcers Info Percent of long-stay high risk residents with pressure ulcers 3.2%
18% better than State average

State average: 3.9%

Urinary Tract Infection Info Percent of long-stay residents with a urinary tract infection 0.5%
17% better than State average

State average: 0.5%

Lost Too Much Weight Info Percent of long-stay residents who lose too much weight 1.5%
76% better than State average

State average: 6.2%

Depressive Symptoms Info Percent of long-stay residents who have depressive symptoms 2.8%
88% better than State average

State average: 24.0%

Antipsychotic Use Info Percent of long-stay residents who received an antipsychotic medication 6.9%
19% better than State average

State average: 8.4%

Pneumococcal Vaccine Info Percent of long-stay residents assessed and appropriately given the pneumococcal vaccine 100.0%
8% better than State average

State average: 92.4%

Influenza Vaccine Info Percent of long-stay residents assessed and appropriately given the seasonal influenza vaccine 96.6%
In line with State average

State average: 94.5%

Hospitalizations per 1,000 days Info Number of hospitalizations per 1,000 long-stay resident days. 0.29
84% better than State average

State average: 1.77

ED visits per 1,000 days Info Number of outpatient emergency department visits per 1,000 long-stay resident days. 0.64
65% better than State average

State average: 1.83

Short-stay resident measures
Above average State avg: 2.4 Info CMS star rating based on short-stay quality measure performance. 5 stars = much above average, 1 star = much below average.
Pneumococcal Vaccine Info Percent of short-stay residents assessed and appropriately given the pneumococcal vaccine 99.9%
28% better than State average

State average: 78.0%

Antipsychotic medication increase Info Percent of short-stay residents who newly received an antipsychotic medication 0.0%
100% better than State average

State average: 1.3%

Influenza Vaccine Info Percent of short-stay residents assessed and appropriately given the seasonal influenza vaccine 94.6%
25% better than State average

State average: 75.6%

Re-hospitalized after SNF stay Info Percentage of short-stay residents who were re-hospitalized after their nursing home admission. 27.0%
8% worse than State average

State average: 25.1%

Emergency department visits Info Percentage of short-stay residents who had an outpatient emergency department visit. 12.7%
In line with State average

State average: 12.5%

Falls with major injury Info Percentage of SNF residents who experience falls with major injury during their stay. 0.7%
9% better than State average

State average: 0.8%

Ability to care for self at discharge Info Percentage of residents at or above expected ability to care for themselves at discharge. 41.4%
23% worse than State average

State average: 53.7%

Successful return to home or community Info Rate of successful return to home or community from a skilled nursing facility. 63.9%
26% better than State average

State average: 50.6%

Breakdown by payment type

Medicare

30% of new residents, usually for short-term rehab.

Typical stay 26 days

Private pay

61% of new residents, often for short stays.

Typical stay 2 - 3 months

Medicaid

9% of new residents, often for long-term daily care.

Typical stay 2 - 3 months

Facility Characteristics

Source: CMS Long-Term Care Facility Characteristics (Data as of Jan 2026)

Total residents 88
Medicare
13
14.8% of residents
Medicaid
41
46.6% of residents
Private pay or other
34
38.6% of residents
Programs & Services
Residents Group

Residents meet regularly to discuss policies, care quality, and activities

Nurse Aide Training

State-approved Nurse Aide Training and Competency Evaluation Program on-site

Active Resident Council

Organized group of residents that meets regularly to discuss facility policies, quality of life, and activities.

Finances and operations

Based on CMS SNF Cost Report for fiscal year ending in 12/2023.

For-profit
Corporation
Net patient revenue Info Net patient revenue — what the home actually collects for resident care, after contractual allowances, bad debt and discounts are subtracted from its gross charges (CMS cost report, Worksheet G-3). It covers resident care only; money the home earns from other sources is shown separately as "Other income."
$10.2M
Net patient income Info Net patient income: net patient revenue minus the home's total operating expenses. A positive figure means it earns more from resident care than it spends to deliver it; a negative figure means the opposite. It excludes non-operating "other income."
-$489.4K
For-profit Corporation
Net patient revenue Info Net patient revenue — what the home actually collects for resident care, after contractual allowances, bad debt and discounts are subtracted from its gross charges (CMS cost report, Worksheet G-3). It covers resident care only; money the home earns from other sources is shown separately as "Other income."
$10.2M Rank #80 / 210Revenue — State benchmarkedThis home is ranked 80th out of 210 homes in Ohio. Shows this facility's annual revenue compared to the Ohio average. Higher revenue generally means more resources for staffing and capital — read alongside Payroll %.Rankings are based only on facilities in Ohio that report data for that category. Facilities without available data are excluded from the ranking.Click the rank badge to see the full State ranking.Click here to see the full State ranking.
Net patient income Info Net patient income: net patient revenue minus the home's total operating expenses. A positive figure means it earns more from resident care than it spends to deliver it; a negative figure means the opposite. It excludes non-operating "other income."
-$489.4K
Other income Info Money the home earns outside of resident care — such as investments, grants, rentals and other non-operating sources (CMS cost report, Worksheet G-3). It is tracked separately from net patient revenue: it is not part of that figure, and it is not included in net patient income.
$404.4K
Payroll costs Info Staff salaries plus wage-related costs — benefits such as payroll taxes, health insurance and retirement — from the home's own accounting records (CMS cost report, Worksheet A). Contract or agency labor is counted separately, under other operating costs. Rank #85 / 210Payroll — State benchmarkedThis home is ranked 85th out of 210 homes in Ohio. Shows total annual staff payroll benchmarked to the Ohio average. Higher payroll investment relative to peers often signals better staffing and less reliance on cheaper contract labor.Rankings are based only on facilities in Ohio that report data for that category. Facilities without available data are excluded from the ranking.Click the rank badge to see the full State ranking.Click here to see the full State ranking.
$3.3M 32.2% of net patient revenue Info Payroll as a share of revenue: staff salaries and wage-related benefits divided by net patient revenue. A higher figure means more of each revenue dollar goes to staff pay. Rank #142 / 210Payroll % — State benchmarkedThis home is ranked 142nd out of 210 homes in Ohio. Shows payroll as a percentage of revenue versus the Ohio average. Well-run Ohio facilities typically land around 54–64% — the top third Statewide. Below 25% may signal understaffing or heavy agency use — read with Staffing ratings.Rankings are based only on facilities in Ohio that report data for that category. Facilities without available data are excluded from the ranking.Click the rank badge to see the full State ranking.Click here to see the full State ranking.
Other operating costs Info Everything it costs to run the home apart from payroll — food, utilities, supplies, maintenance, contract labor and administration. Calculated as total operating expense minus payroll (staff salaries and wage-related benefits).
$7.4M
Total costs Info The home's total operating expense for the year — all the costs of running it, salaries included (CMS cost report, Worksheet G-3).
$10.7M

What does this home offer?

Housing options icon

Housing Options: Private Suites

Building type icon
Building type icon

Building Type: Single-story

Beauty services icon

Beauty Services

Social and recreational activities icon

Social and Recreational Activities

Exercise program icon

Exercise Programs

On-site medical care and health services icon

On-site Medical Care and Health Services

Who this home usually serves

TYPE OF STAY

Primarily short stays

Residents typically stay for brief periods, with frequent admissions and discharges throughout the year.

Most new residents arrive under private pay (61% of admissions), and a typical private pay stay runs around 2 - 3 months.

Admissions
454 total

Coverage residents most often arrive under.

Medicare 30%
Private pay 61%
Medicaid 9%
Discharges
432 total

Coverage residents most often leave under.

Medicare 27%
Private pay 63%
Medicaid 9%

Living Spaces & Floor Plans for Ohman Family Living at Holly, a CCRC

Places of interest near Ohman Family Living at Holly, a CCRC

Address 3.1 miles from city center Info Estimated distance in miles from Newbury Township's city center to Ohman Family Living at Holly, a CCRC's address, calculated via Google Maps.

Calculate Travel Distance to Ohman Family Living at Holly, a CCRC

Add your location

Address

Compare Nursing Homes around the area

The information below is reported by the Ohio Department of Health, Bureau of Survey and Certification.

Ohman Family Living at Holly, a CCRC
NH
AL
HC
MC
PC
Newbury Township -92 - 0 Private Suites
Beachwood Commons by New Perspective
NH
AL
IL
MC
Beachwood -120 A+ 15 Studio / 1 Bed
Brookdale Westlake Village
NH
AL
IL
MC
Westlake -60 A+ 25 1 Bed / 2 Bed
Elizabeth Scott Community
NH
AL
MC
Maumee -60 A+ 0 Studio / 1 Bed
Genoa Retirement Village
NH
AL
IL
MC
Genoa -68 A+ 17 Studio / 1 Bed / 2 Bed

Frequently Asked Questions about Ohman Family Living at Holly, a CCRC

What neighborhood is Ohman Family Living at Holly, a CCRC in?

Ohman Family Living at Holly, a CCRC is in the Newbury Township neighborhood.

What is the occupancy rate at Ohman Family Living at Holly, a CCRC?

Ohman Family Living at Holly, a CCRC's occupancy is 90.9%.

Does Ohman Family Living at Holly, a CCRC have different floorplan options?

Yes — see the floorplan options available at Ohman Family Living at Holly, a CCRC on this page.

What is the best email address for Ohman Family Living at Holly, a CCRC?

The team at Ohman Family Living at Holly, a CCRC can be reached at info.holly@ohmanfamilyliving.com.

Does Ohman Family Living at Holly, a CCRC operate as a for-profit or non-profit?

Ohman Family Living at Holly, a CCRC is registered as a for-profit.

Are there photos of Ohman Family Living at Holly, a CCRC?

Yes — there are 6 photos of Ohman Family Living at Holly, a CCRC in the photo gallery on this page.

What is the address of Ohman Family Living at Holly, a CCRC?

Ohman Family Living at Holly, a CCRC is located at 10190 Fairmount Rd, Newbury Township, OH 44065.

Guides for Better Senior Living

Care Cost Calculator: See Prices in Your Area

Nursing Home Data Explorer

Don’t Wait Too Long: 7 Red Flag Signs Your Parent Needs Assisted Living Now

The True Cost of Assisted Living in 2025 – And How Families Are Paying For It

Understanding Senior Living Costs: Pricing Models, Discounts & Financial Assistance