Our Lady of Life Apartments
Nursing Home, Assisted Living, Independent Living & Memory Care · St. Louis, MO
CMS overall rating Info CMS (the Centers for Medicare & Medicaid Services) is the federal agency that rates nursing home quality. Its Overall Rating runs from 1 to 5 stars, combining health inspections, staffing, and quality measures, with inspections weighted most heavily.

Our Lady of Life Apartments

Nursing Home, Assisted Living, Independent Living & Memory Care · St. Louis, MO
CMS overall rating Info CMS (the Centers for Medicare & Medicaid Services) is the federal agency that rates nursing home quality. Its Overall Rating runs from 1 to 5 stars, combining health inspections, staffing, and quality measures, with inspections weighted most heavily.
Calculator: See prices in your area
Our Lady of Life Apartments accepts Medicare, Medicaid, and private pay.

Overview of Our Lady of Life Apartments

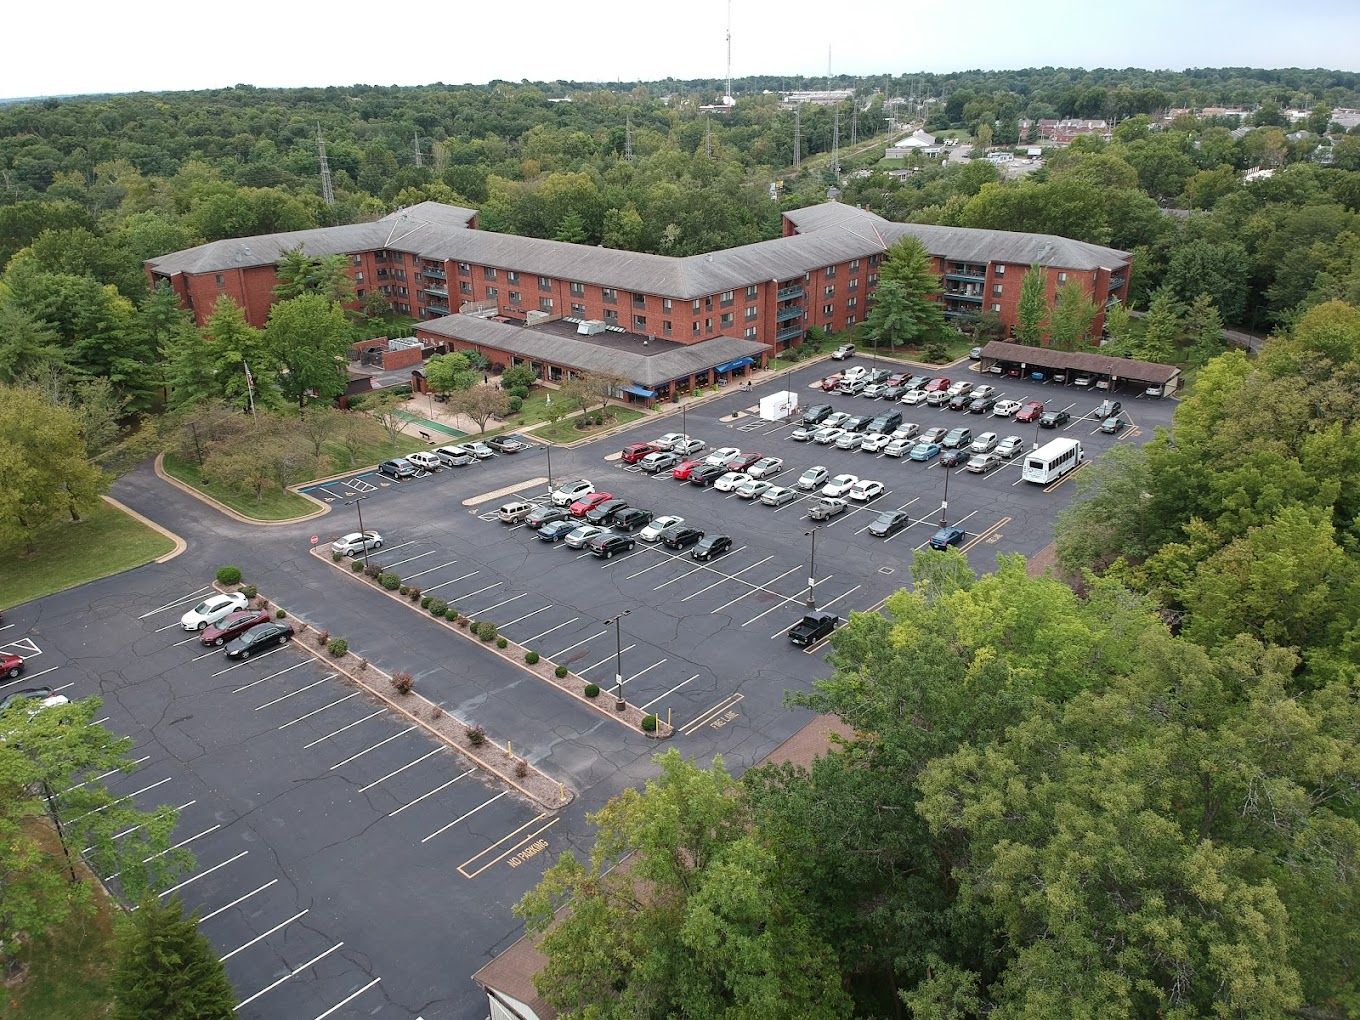
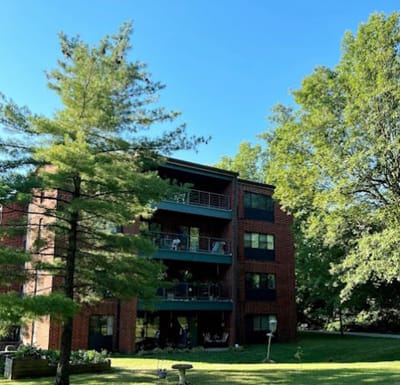
Nestled in the serene Watson Road, St.Louis, MO, Our Lady of Life Apartments is a blissful senior living community that provides independent living. With spacious and well-made floor plans including one-bedroom and two-bedroom apartments, the community ensures cozy and welcoming residences. Experience a relaxing and safe retirement life within the premises of the community.

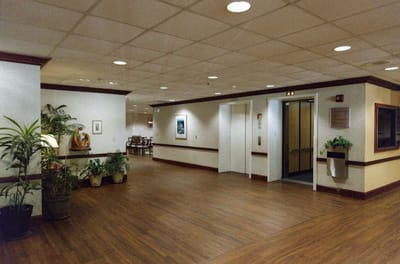
Our Lady of Life Apartments fosters a vibrant environment, providing its residents with engaging activities and enrichment programs that include exercise and fitness classes, outdoor games, and community parties. Residents enjoy healthy and delicious meals daily in the elegant dining room with friends. Amenities include well-maintained grounds, a coffee bar, a beauty salon and barbershop, a billiards and poker room, a multi-purpose space, an open living area with a classic fireplace, bocce ball courts, and outdoor terraces.

(314) 968-9447

Quality ratings

Measured by Centers for Medicare & Medicaid Services (CMS)

Overall rating Info The Overall CMS Rating combines results from health inspections, staffing levels and quality measures. Health inspections carry the most weight. Staffing and quality scores can increase or decrease the final rating based on performance compared to state and national standards.
▼ 19.5% Below MO avg. ▼ 19.5% Below MO avg.MO average: 2.5Click the badge to see the full State ranking.Click here to see the full State ranking.
Health Inspection Info Based on the results of the facility's three most recent standard inspections and any complaint investigations. CMS reviews the number, scope, and severity of deficiencies, with more recent findings weighted more heavily.
▼ 27.9% Below MO avg. ▼ 27.9% Below MO avg.MO average: 2.8Click the badge to see the full State ranking.Click here to see the full State ranking.
Staffing Info Measures average nursing staff hours per resident per day, including Registered Nurses (RNs) and total nursing staff. Ratings are adjusted based on the level of care residents require and are compared to state and national benchmarks.
▲ 37.1% Above MO avg. ▲ 37.1% Above MO avg.MO average: 2.2Click the badge to see the full State ranking.Click here to see the full State ranking.
Quality Measures Info Based on clinical and physical health indicators reported to CMS, such as hospital readmissions, falls, pressure ulcers, and improvements in mobility. These measures reflect how well residents' health needs are being managed.
▲ 50.5% Above MO avg. ▲ 50.5% Above MO avg.MO average: 2.7Click the badge to see the full State ranking.Click here to see the full State ranking.

Staffing hours breakdown

Info Daily nursing hours per resident by staff type, reported to CMS. Higher is generally better — compare this facility to state and national averages to see where staffing stands.

Hours per resident per day — compared to Missouri state averages

Total nursing care / resident Info This home is ranked 37th out of 282 homes in Missouri for nurse hours. Total adjusted nursing hours per resident per day, combining RN, LPN, and aide time. CMS adjusts this for case-mix so facilities can be fairly compared.
4h 45m per day
Rank #37 / 282Nurse hours — State benchmarkedThis home is ranked 37th out of 282 homes in Missouri. Shows adjusted nurse hours per resident per day benchmarked to the Missouri average, with a ranking across 282 Missouri facilities. More hours mean more direct care. The national average is about 3.5 hrs; below 3.0 is a red flag.Rankings are based only on facilities in Missouri that report data for that category. Facilities without available data are excluded from the ranking.Click the rank badge to see the full State ranking.Click here to see the full State ranking.
This facility Missouri avg (3h 44m per day)
vs Missouri avg
+27%

2 of 6 metrics below state avg

Standout metric Physical Therapist is +361% above state avg
Staff typeHours / Day / Residentvs state avg
Registered Nurse (RN) Info RNs hold the highest nursing license and can assess residents, interpret test results, and direct care plans. More RN hours per day often signals stronger clinical oversight and faster response to health changes. 24m per day ▼ 12% State avg: 28m per day · National avg: 41m per day
LPN / LVN Info Licensed Practical Nurses (LPNs) or Licensed Vocational Nurses (LVNs) deliver routine hands-on care — medication administration, wound dressing, and monitoring vital signs. They work under RN supervision and make up a large share of daily bedside care. 51m per day ▲ 26% State avg: 41m per day · National avg: 52m per day
Nurse Aide Info Certified Nurse Aides (CNAs) provide the most direct day-to-day assistance: bathing, dressing, feeding, and mobility. Nurse aide hours are typically the largest staffing category and directly affect residents' quality of life. 2h 22m per day ▲ 3% State avg: 2h 19m per day · National avg: 2h 20m per day
Weekend Total Nursing Info Combined nursing hours (RN + LPN + Nurse Aide) per resident per day on weekends. Staffing often drops on weekends — this figure reveals whether the facility maintains adequate coverage outside of weekday hours. 3h 14m per day ▲ 6% State avg: 3h 3m per day · National avg: 3h 27m per day
Physical Therapist Info Hours per resident per day provided by licensed Physical Therapists (PTs) or PT Assistants. PT services help residents recover mobility after injury or illness and are especially important for post-acute (short-stay) rehabilitation. 13m per day ▲ 361% State avg: 3m per day · National avg: 4m per day
Weekend RN Info Registered nurse hours specifically on weekends. Facilities sometimes reduce RN presence on Saturdays and Sundays — a low weekend RN figure compared to weekday hours can indicate reduced clinical oversight when most administrative staff are absent. 11m per day ▼ 45% State avg: 20m per day · National avg: 29m per day

Capacity and availability

This home usually has availability

Lower occupancy than the Missouri average: 66.6%
Occupancy rate
44.2% Rank #371 / 434Occupancy rate — State benchmarkedThis home is ranked 371st out of 434 homes in Missouri. Shows this facility's occupancy rate versus the Missouri average, with its Statewide rank out of 434. Higher occupancy signals strong local demand and financial stability.Rankings are based only on facilities in Missouri that report data for that category. Facilities without available data are excluded from the ranking.Click the rank badge to see the full State ranking.Click here to see the full State ranking.
Avg. Length of Stay
264 days
Bed community size
217-bed community Rank #11 / 454Bed count — State benchmarkedThis home is ranked 11th out of 454 homes in Missouri. Shows this facility's certified or reported bed count compared to other Missouri facilities. Larger communities may offer more amenities, programs, and on-site services for residents and families.Rankings are based only on facilities in Missouri that report data for that category. Facilities without available data are excluded from the ranking.Click the rank badge to see the full State ranking.Click here to see the full State ranking.
A large-scale community that may provide a wide range of amenities, services, and structured programs.
Walk Score
Walk Score: 56 / 100 Rank #181 / 563Walk Score — State benchmarkedThis home is ranked 181st out of 563 homes in Missouri. Shows how walkable this facility's neighborhood is compared to the average Walk Score across Missouri facilities. Higher scores benefit residents, families, and staff.Rankings are based only on facilities in Missouri that report data for that category. Facilities without available data are excluded from the ranking.Click the rank badge to see the full State ranking.Click here to see the full State ranking.
Moderately walkable. Some errands can be accomplished on foot, with a mix of nearby amenities.

Contact Our Lady of Life Apartments

Staffing Data

Reporting period: October 1 – December 31, 2025 (Q4 2025). Source: CMS Payroll-Based Journal report.

Total staff 231
Employees 61
Contractors 170
Staff to resident ratio 2.72 : 1
60% more staff per resident than Missouri average
Missouri average ratio: 1.69 : 1 Missouri average ratio: 1.69 : 1See full Missouri ranking
Avg staff/day 43
Average shift 7.7 hours
5% worse than Missouri average
Missouri average: 8.1 hours Missouri average shift: 8.1 hoursSee full Missouri ranking
Total staff hours (quarter) 30,302

Nursing staff breakdown

Q4 2025 · Oct 1 – Dec 31 More info This data comes from the CMS Payroll-Based Journal report covering October 1 – December 31, 2025.
Registered Nurse

Manages medical care and health needs.

RN Staff Info 7 total: 3 full-time employees and 4 contractors. 7
Average shift length Info Average shift length. Calculated as total hours divided by days worked and average staff per day. 9.5 hours
Licensed Practical Nurse

Assists with medical care and medications.

LPN Staff Info 43 total: 10 full-time employees and 33 contractors. 43
Average shift length Info Average shift length. Calculated as total hours divided by days worked and average staff per day. 9.4 hours
Certified Nursing Assistant

Helps with daily care and mobility.

CNA Staff Info 128 total: 30 full-time employees and 98 contractors. 128
Average shift length Info Average shift length. Calculated as total hours divided by days worked and average staff per day. 7.9 hours

Contractor staffing

Q4 2025 · Oct 1 – Dec 31 More info This data comes from the CMS Payroll-Based Journal report covering October 1 – December 31, 2025.

Total hours from contractors

20.1%

6,078 contractor hours this quarter

Certified Nursing Assistant: 98 Licensed Practical Nurse: 33 Medication Aide/Technician: 19 Registered Nurse: 4 Respiratory Therapy Technician: 3 Speech Language Pathologist: 3 Physical Therapy Aide: 3 Physical Therapy Assistant: 2 Qualified Social Worker: 2 Medical Director: 1 Occupational Therapy Assistant: 1 Other Physician: 1

Staff by category

Q4 2025 · Oct 1 – Dec 31 More info This data comes from the CMS Payroll-Based Journal report covering October 1 – December 31, 2025.
Certified Nursing Assistant309812813,96592100%7.9
Licensed Practical Nurse1033434,86592100%9.4
Medication Aide/Technician519242,12092100%8.7
Registered Nurse3471,4508997%9.5
Respiratory Therapy Technician2351,4348087%5.9
RN Director of Nursing2029446166%8
Speech Language Pathologist0338586571%4.9
Clinical Nurse Specialist2028566166%8
Administrator2026787582%7.3
Qualified Social Worker0225155964%5.2
Occupational Therapy Aide1014806065%8
Dietitian2024756470%7.1
Mental Health Service Worker1014725964%8
Nurse Practitioner1014325459%8
Physical Therapy Aide0334306672%4.9
Physical Therapy Assistant0222745964%3.8
Medical Director011361718%2.1
Occupational Therapy Assistant0111322%6.3
Other Physician011811%7.5
128 Certified Nursing Assistant
% of Days 100%
43 Licensed Practical Nurse
% of Days 100%
24 Medication Aide/Technician
% of Days 100%
7 Registered Nurse
% of Days 97%
5 Respiratory Therapy Technician
% of Days 87%
2 RN Director of Nursing
% of Days 66%
3 Speech Language Pathologist
% of Days 71%
2 Clinical Nurse Specialist
% of Days 66%
2 Administrator
% of Days 82%
2 Qualified Social Worker
% of Days 64%
1 Occupational Therapy Aide
% of Days 65%
2 Dietitian
% of Days 70%
1 Mental Health Service Worker
% of Days 64%
1 Nurse Practitioner
% of Days 59%
3 Physical Therapy Aide
% of Days 72%
2 Physical Therapy Assistant
% of Days 64%
1 Medical Director
% of Days 18%
1 Occupational Therapy Assistant
% of Days 2%
1 Other Physician
% of Days 1%

Penalties and fines

Includes penalties issued in 2025

Federal penalties imposed by CMS for regulatory violations, including civil money penalties (fines) and denials of payment for new Medicare/Medicaid admissions.

Source: CMS Penalties Database (Data as of Jan 2026)

Total fines amount $19K Rank #200 / 289Federal fines — State benchmarkedThis home is ranked 200th out of 289 homes in Missouri. Shows this facility's cumulative CMS federal fine dollars versus the Missouri average among facilities with fines, and where it ranks among 289 facilities in the pool. Lower total dollars mean a better rank.Rankings are based only on facilities in Missouri that report data for that category. Facilities without available data are excluded from the ranking.Click the rank badge to see the full State ranking.Click here to see the full State ranking.
74% lower than Missouri average

Missouri average: $73K

Number of fines 1
59% fewer fines than Missouri average

Missouri average: 2.4

Payment Denials Info Serious action where Medicare and/or Medicaid temporarily stops payments for new residents until issues are fixed. 1
45% more payment denials than Missouri average

Missouri average: 0.7

Fines amount comparison
This facility $19K
Missouri average $73K
Penalty History

Penalties are imposed by CMS for violations of federal nursing home regulations.

2 penalties in the past 3 years

Multiple penalties were reported in the last 3 years.

Civil Money Penalty Info Fines imposed for noncompliance, which can be assessed per day or per instance of violation. Mar 24, 2025
$19K
Payment Denial Info Serious action where Medicare and/or Medicaid temporarily stops payments for new residents until issues are fixed. Mar 24, 2025
9 days

Last updated: Jan 2026

Quality of care over time

These measures show how residents usually do over time at this home, based on health outcomes and preventive care.

High-risk clinical events score Info A composite score based on pressure ulcers, falls with injury, weight loss, walking ability decline, and activities of daily living decline. 6.6
40% better than Missouri average

Missouri average: 10.9

Functional decline score Info A composite score based on activities of daily living decline, walking ability decline, and incontinence. 9.5
51% better than Missouri average

Missouri average: 19.5

Long-stay resident measures
Need for Help with Daily Activities Increased Info Percent of long-stay residents whose need for help with daily activities has increased 11.1%
44% better than Missouri average

Missouri average: 19.8%

Walking Ability Worsened Info Percent of long-stay residents whose ability to move independently worsened 9.2%
56% better than Missouri average

Missouri average: 20.6%

Low Risk Residents with Bowel/Bladder Incontinence Info Percent of low risk long-stay residents who lose control of their bowels or bladder 8.2%
55% better than Missouri average

Missouri average: 18.1%

Falls with Major Injury Info Percent of long-stay residents experiencing one or more falls with major injury 6.9%
72% worse than Missouri average

Missouri average: 4.0%

High Risk Residents with Pressure Ulcers Info Percent of long-stay high risk residents with pressure ulcers 2.2%
56% better than Missouri average

Missouri average: 5.0%

Urinary Tract Infection Info Percent of long-stay residents with a urinary tract infection 0.0%
100% better than Missouri average

Missouri average: 2.7%

Lost Too Much Weight Info Percent of long-stay residents who lose too much weight 3.6%
35% better than Missouri average

Missouri average: 5.6%

Depressive Symptoms Info Percent of long-stay residents who have depressive symptoms 8.4%
34% better than Missouri average

Missouri average: 12.8%

Antipsychotic Use Info Percent of long-stay residents who received an antipsychotic medication 12.6%
43% better than Missouri average

Missouri average: 22.0%

Pneumococcal Vaccine Info Percent of long-stay residents assessed and appropriately given the pneumococcal vaccine 96.9%
14% better than Missouri average

Missouri average: 85.2%

Influenza Vaccine Info Percent of long-stay residents assessed and appropriately given the seasonal influenza vaccine 97.4%
7% better than Missouri average

Missouri average: 90.9%

Short-stay resident measures
Pneumococcal Vaccine Info Percent of short-stay residents assessed and appropriately given the pneumococcal vaccine 67.6%
In line with Missouri average

Missouri average: 66.6%

Antipsychotic medication increase Info Percent of short-stay residents who newly received an antipsychotic medication 0.9%
62% better than Missouri average

Missouri average: 2.2%

Influenza Vaccine Info Percent of short-stay residents assessed and appropriately given the seasonal influenza vaccine 64.0%
In line with Missouri average

Missouri average: 63.5%

Breakdown by payment type

Medicare

15% of new residents, usually for short-term rehab.

Typical stay 2 - 3 months

Private pay

85% of new residents, often for short stays.

Typical stay 2 - 3 months

Medicaid

1% of new residents, often for long-term daily care.

Typical stay 33 years

Facility Characteristics

Source: CMS Long-Term Care Facility Characteristics (Data as of Jan 2026)

Total residents 85
Medicare
11
12.9% of residents
Medicaid
40
47.1% of residents
Private pay or other
34
40% of residents

Finances and operations

Based on CMS SNF Cost Report for fiscal year ending in 06/2024.

Governmental community
Operated by state authorities.
Net patient revenue Info Net patient revenue — what the home actually collects for resident care, after contractual allowances, bad debt and discounts are subtracted from its gross charges (CMS cost report, Worksheet G-3). It covers resident care only; money the home earns from other sources is shown separately as "Other income."
$11.5M
Net patient income Info Net patient income: net patient revenue minus the home's total operating expenses. A positive figure means it earns more from resident care than it spends to deliver it; a negative figure means the opposite. It excludes non-operating "other income."
-$904.3K
Governmental community Operated by state authorities.
Net patient revenue Info Net patient revenue — what the home actually collects for resident care, after contractual allowances, bad debt and discounts are subtracted from its gross charges (CMS cost report, Worksheet G-3). It covers resident care only; money the home earns from other sources is shown separately as "Other income."
$11.5M Rank #29 / 292Revenue — State benchmarkedThis home is ranked 29th out of 292 homes in Missouri. Shows this facility's annual revenue compared to the Missouri average. Higher revenue generally means more resources for staffing and capital — read alongside Payroll %.Rankings are based only on facilities in Missouri that report data for that category. Facilities without available data are excluded from the ranking.Click the rank badge to see the full State ranking.Click here to see the full State ranking.
Net patient income Info Net patient income: net patient revenue minus the home's total operating expenses. A positive figure means it earns more from resident care than it spends to deliver it; a negative figure means the opposite. It excludes non-operating "other income."
-$904.3K
Other income Info Money the home earns outside of resident care — such as investments, grants, rentals and other non-operating sources (CMS cost report, Worksheet G-3). It is tracked separately from net patient revenue: it is not part of that figure, and it is not included in net patient income.
$778.2K
Payroll costs Info Staff salaries plus wage-related costs — benefits such as payroll taxes, health insurance and retirement — from the home's own accounting records (CMS cost report, Worksheet A). Contract or agency labor is counted separately, under other operating costs. Rank #30 / 292Payroll — State benchmarkedThis home is ranked 30th out of 292 homes in Missouri. Shows total annual staff payroll benchmarked to the Missouri average. Higher payroll investment relative to peers often signals better staffing and less reliance on cheaper contract labor.Rankings are based only on facilities in Missouri that report data for that category. Facilities without available data are excluded from the ranking.Click the rank badge to see the full State ranking.Click here to see the full State ranking.
$5.8M 50.3% of net patient revenue Info Payroll as a share of revenue: staff salaries and wage-related benefits divided by net patient revenue. A higher figure means more of each revenue dollar goes to staff pay. Rank #194 / 292Payroll % — State benchmarkedThis home is ranked 194th out of 292 homes in Missouri. Shows payroll as a percentage of revenue versus the Missouri average. Well-run Missouri facilities typically land around 60–71% — the top third Statewide. Below 25% may signal understaffing or heavy agency use — read with Staffing ratings.Rankings are based only on facilities in Missouri that report data for that category. Facilities without available data are excluded from the ranking.Click the rank badge to see the full State ranking.Click here to see the full State ranking.
Other operating costs Info Everything it costs to run the home apart from payroll — food, utilities, supplies, maintenance, contract labor and administration. Calculated as total operating expense minus payroll (staff salaries and wage-related benefits).
$6.6M
Total costs Info The home's total operating expense for the year — all the costs of running it, salaries included (CMS cost report, Worksheet G-3).
$12.4M

What does this home offer?

Housing options icon

Housing Options: 1 Bed / 2 Bed

Building type icon
Building type icon

Building Type: Mid-rise

Transportation services icon

Transportation Services

Fitness and recreation icon

Fitness and Recreation

Who this home usually serves

TYPE OF STAY

Primarily short stays

Residents typically stay for brief periods, with frequent admissions and discharges throughout the year.

Most new residents arrive under private pay (85% of admissions), and a typical private pay stay runs around 2 - 3 months.

Admissions
189 total

Coverage residents most often arrive under.

Medicare 15%
Private pay 85%
Medicaid 1%
Discharges
141 total

Coverage residents most often leave under.

Medicare 40%
Private pay 58%
Medicaid 1%

Places of interest near Our Lady of Life Apartments

Address 10.9 miles from city center Info Estimated distance in miles from St. Louis's city center to Our Lady of Life Apartments's address, calculated via Google Maps.

Calculate Travel Distance to Our Lady of Life Apartments

Add your location

Address

Compare Nursing Homes around St Louis

The information below is reported by the Missouri Department of Health and Senior Services, Division of Regulation and Licensure.

5 facilities compared · CMS & MO Dept. of Health data

Laclede Groves
NH
AL
IL
MC
St. Louis
251
Facility 251
MO AVG 97
Rank #3 / 454
69.7%
Facility 69.7%
MO AVG 66.6%
Rank #191 / 434
+5%
5.27
Facility 5.27
MO AVG 3.74
Rank #19 / 282
+48%+41%
$0
Facility $0
MO AVG $76.9k
Rank #1 / 289
9
Facility 9
MO AVG 36.5
Rank #11 / 287
4.5
Facility 4.5
MO AVG 5.7
Rank #105 / 287
-103-
35
Facility 35
MO AVG 45
Rank #356 / 563
John Komlos
$24.9M
Facility $24.9M
MO AVG $8.4M
Rank #4 / 292
$27.4M
Facility $27.4M
MO AVG $3.3M
Rank #2 / 292
109.9%
Facility 109.9%
MO AVG 45.6%
Rank #192 / 292
265600
Cottages of Lake St. Louis
NH
Lake St Louis (Lake Saint Louis)
60
Facility 60
MO AVG 97
Rank #343 / 454
81.7%
Facility 81.7%
MO AVG 66.6%
Rank #97 / 434
+23%
6.04
Facility 6.04
MO AVG 3.74
Rank #6 / 282
-32%+62%
$17.7k
Facility $17.7k
MO AVG $76.9k
Rank #199 / 289
11
Facility 11
MO AVG 36.5
Rank #25 / 287
2.8
Facility 2.8
MO AVG 5.7
Rank #22 / 287
255-
13
Facility 13
MO AVG 45
Rank #486 / 563
Cottages Master LLC
$8.9M
Facility $8.9M
MO AVG $8.4M
Rank #76 / 292
$4.9M
Facility $4.9M
MO AVG $3.3M
Rank #70 / 292
55.4%
Facility 55.4%
MO AVG 45.6%
Rank #134 / 292
265860
River Crossing Rehab and Healthcare Center
NH
HC
MC
PC
St. Louis (Dunn Loring)
120
Facility 120
MO AVG 97
Rank #89 / 454
81.1%
Facility 81.1%
MO AVG 66.6%
Rank #106 / 434
+22%
3.34
Facility 3.34
MO AVG 3.74
Rank #206 / 282
-45%-11%
$0
Facility $0
MO AVG $76.9k
Rank #1 / 289
36
Facility 36
MO AVG 36.5
Rank #176 / 287
5.1
Facility 5.1
MO AVG 5.7
Rank #140 / 287
188-
1
Facility 1
MO AVG 45
Rank #549 / 563
River Crossing Holdco LLC
$4.9M
Facility $4.9M
MO AVG $8.4M
Rank #91 / 292
$3.3M
Facility $3.3M
MO AVG $3.3M
Rank #59 / 292
67.9%
Facility 67.9%
MO AVG 45.6%
Rank #42 / 292
265457
Our Lady of Life Apartments
NH
AL
IL
MC
St. Louis (Southhampton)
217
Facility 217
MO AVG 97
Rank #11 / 454
44.2%
Facility 44.2%
MO AVG 66.6%
Rank #371 / 434
-34%
4.75
Facility 4.75
MO AVG 3.74
Rank #37 / 282
-61%+27%
$19.1k
Facility $19.1k
MO AVG $76.9k
Rank #200 / 289
42
Facility 42
MO AVG 36.5
Rank #194 / 287
8.4
Facility 8.4
MO AVG 5.7
Rank #258 / 287
274-
56
Facility 56
MO AVG 45
Rank #181 / 563
Kevin Klingerman
$11.5M
Facility $11.5M
MO AVG $8.4M
Rank #29 / 292
$5.8M
Facility $5.8M
MO AVG $3.3M
Rank #30 / 292
50.3%
Facility 50.3%
MO AVG 45.6%
Rank #194 / 292
265159
Creve Coeur Manor
NH
St. Louis
149
Facility 149
MO AVG 97
Rank #55 / 454
49.6%
Facility 49.6%
MO AVG 66.6%
Rank #343 / 434
-26%
3.17
Facility 3.17
MO AVG 3.74
Rank #217 / 282
-34%-15%
$9.4k
Facility $9.4k
MO AVG $76.9k
Rank #171 / 289
67
Facility 67
MO AVG 36.5
Rank #265 / 287
8.4
Facility 8.4
MO AVG 5.7
Rank #258 / 287
270-
30
Facility 30
MO AVG 45
Rank #386 / 563
Jeanne Dirschuweit
$5.5M
Facility $5.5M
MO AVG $8.4M
Rank #158 / 292
$4.0M
Facility $4.0M
MO AVG $3.3M
Rank #126 / 292
72.5%
Facility 72.5%
MO AVG 45.6%
Rank #53 / 292
265720

Financial Assistance for
Nursing Home in Missouri

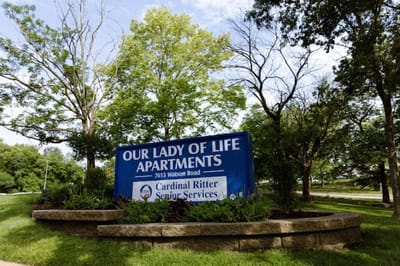
Our Lady of Life Apartments is located in St. Louis, Missouri.
Here are the financial assistance programs available to residents in Missouri.

Get Financial aid guidance

Aged and Disabled Waiver

Missouri Medicaid A&D Waiver

Age 65+ or disabled
General Missouri resident, Medicaid- eligible, nursing home-level care need.
Income Limits (2025) ~$2,829/month 300% FBR, individual
Asset Limits $2,000 (individual), $3,000 (couple).
MO

Rural access prioritized.

Benefits
Personal care (5-7 hours/day) Respite (240 hours/year) Adult day care (~$65/day) Home health services

Missouri Supplemental Nursing Care (SNC)

MO SNC

Age 65+
General Missouri resident, in approved facility.
Income Limits ~$1,215/month individual
Asset Limits $2,000 individual
MO

Supplements SSI; facility-based only.

Benefits
Monthly cash payment (~$156-$292/month) for care costs

Structured Family Caregiving Waiver (SFCW)

Missouri Structured Family Caregiving Waiver

Age 65+
General Missouri resident, MO HealthNet-eligible, NFLOC, dementia diagnosis, live with caregiver.
Income Limits (2025) ~$2,901/month (300% FBR, individual); QIT required.
Asset Limits $5,909.25 (individual), $11,818.45 (couple).
MO

Caregiver must be family; small program size.

Benefits
Cash stipend ($1,000-$1,500/month) to family caregiver Respite Training Supplies ($500/year)

MO HealthNet Aged, Blind, and Disabled (ABD)

Missouri MO HealthNet ABD

Age 65+ or disabled
General Missouri resident, MO HealthNet-eligible, needs help with 1+ ADL.
Income Limits (2025) ~$1,690/month (individual, projected); spenddown allowed.
Asset Limits $5,909.25 (individual), $11,818.45 (couple).
MO

Less intensive than waivers; statewide access.

Benefits
Personal care (2-4 hours/day) Homemaker services Limited respite Medical equipment

Medicare Savings Program (MSP)

Missouri Medicare Savings Program

Age 65+ or disabled
General Missouri resident, Medicare Part A/B.
Income Limits (2025) ~$2,510/month (QMB), ~$3,380/month (SLMB), ~$3,598/month (QI)—individual.
Asset Limits $9,430 (individual), $14,130 (couple).
MO

Three tiers; no waitlist; includes Extra Help for Part D.

Benefits
Covers Part B premiums ($174.70/month) Deductibles ($240/year) Copays (~20%)

Missouri Caregiver Program (Customized Caregiver Training & Relief)

Missouri Caregiver Program

Age
General Caregivers of 60+ with dementia, Missouri resident, functional needs (2+ ADLs).
Income Limits (2025) No strict cap; prioritizes low-income ~$24,980/year individual
Asset Limits Not assessed; need-based.
MO

Administered via AAAs and Alzheimer’s Association; rural focus.

Benefits
Respite (4-6 hours/week) Training Assistive tech ($500/year) Supplies

VA Aid and Attendance (A&A) and Housebound Benefits

Missouri VA Aid and Attendance/Housebound

Age 65+ or disabled veteran/spouse
General Missouri resident, wartime service, need for ADL help (A&A) or homebound.
Income Limits (2025) Net income < ~$1,984/month (veteran with dependent, A&A); pension offsets income.
Asset Limits ~$155,356 net worth limit
MO

High veteran demand in rural/urban areas.

Benefits
Cash (~$1,433-$2,642/month veteran, ~$951-$1,318 spouse) for care costs (e.g., in-home, assisted living)

Frequently Asked Questions about Our Lady of Life Apartments

What neighborhood is Our Lady of Life Apartments in?

Our Lady of Life Apartments is in the Southhampton neighborhood.

Is Our Lady of Life Apartments in a walkable area?

Our Lady of Life Apartments has a walk score of 56. Moderately walkable. Some errands can be accomplished on foot, with a mix of nearby amenities.

What is the occupancy rate at Our Lady of Life Apartments?

Our Lady of Life Apartments's occupancy is 44.2%.

Are there photos of Our Lady of Life Apartments?

Yes — there are 4 photos of Our Lady of Life Apartments in the photo gallery on this page.

What is the address of Our Lady of Life Apartments?

Our Lady of Life Apartments is located at 7655 Watson Rd, St. Louis, MO 63119.

What is the phone number of Our Lady of Life Apartments?

(314) 968-9447 will put you in contact with the team at Our Lady of Life Apartments.

Is Our Lady of Life Apartments Medicare or Medicaid certified?

Yes — Our Lady of Life Apartments is a CMS-certified provider of Medicare and Medicaid.

Guides for Better Senior Living

Care Cost Calculator: See Prices in Your Area

Nursing Home Data Explorer

Don’t Wait Too Long: 7 Red Flag Signs Your Parent Needs Assisted Living Now

The True Cost of Assisted Living in 2025 – And How Families Are Paying For It

Understanding Senior Living Costs: Pricing Models, Discounts & Financial Assistance