Page Rehabilitation and Healthcare Center
Nursing Home, Memory Care & Respite Care · Fort Myers, FL
CMS overall rating Info CMS (the Centers for Medicare & Medicaid Services) is the federal agency that rates nursing home quality. Its Overall Rating runs from 1 to 5 stars, combining health inspections, staffing, and quality measures, with inspections weighted most heavily.

Page Rehabilitation and Healthcare Center

Nursing Home, Memory Care & Respite Care · Fort Myers, FL
CMS overall rating Info CMS (the Centers for Medicare & Medicaid Services) is the federal agency that rates nursing home quality. Its Overall Rating runs from 1 to 5 stars, combining health inspections, staffing, and quality measures, with inspections weighted most heavily.
Calculator: See prices in your area
Page Rehabilitation and Healthcare Center accepts Medicare, Medicaid, and private pay.

Overview of Page Rehabilitation and Healthcare Center

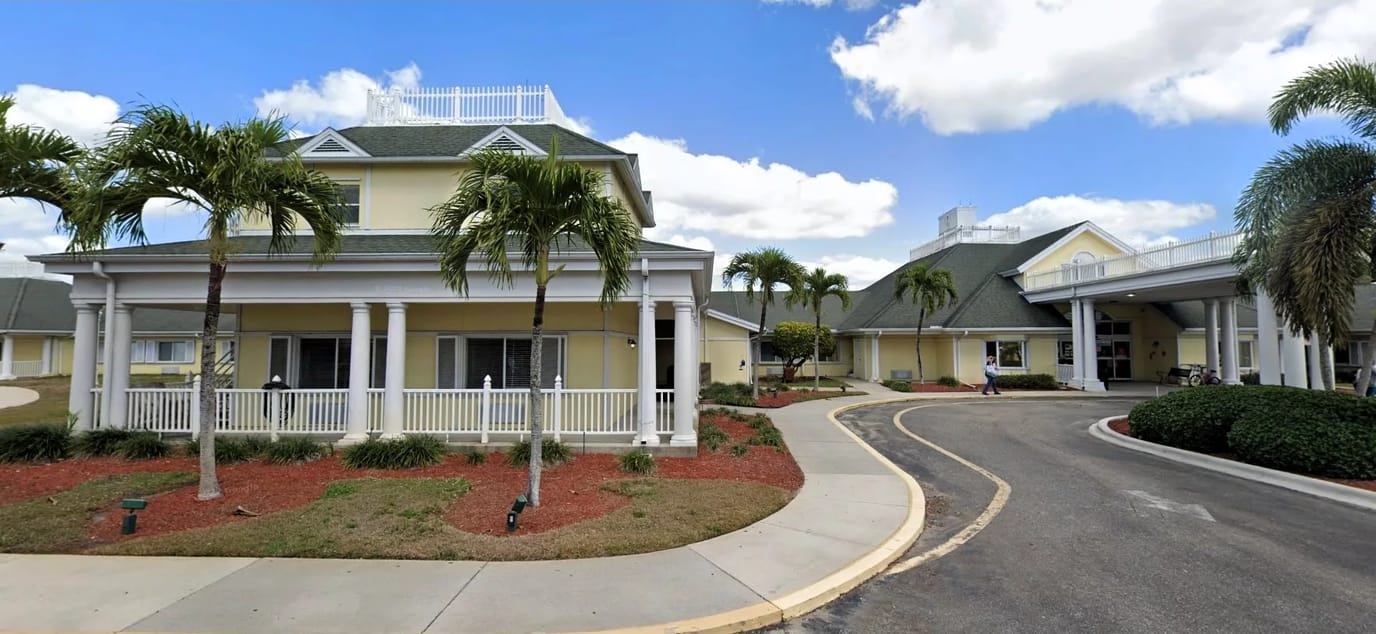
Page Rehabilitation & Healthcare Center provides a welcoming haven for seniors, where compassionate and skilled staff are dedicated to offering top-notch care. Families can trust this committed team to enhance the lives of their senior loved ones, navigating the challenges of aging with expertise and empathy. Here, residents can access a range of services tailored to meet their needs, including both short and long-term rehabilitation programs, as well as specialized skilled nursing services.
This esteemed community, established in 1958, boasts a cozy and homelike atmosphere, creating a comfortable environment for residents. Their commitment to excellence is reflected in their specialized care units, including a dedicated space for individuals facing Alzheimer’s disease and other memory-related disorders. Moreover, Page Rehabilitation & Healthcare Center excels in various specialties such as cardiac care, diabetes management, orthopedic rehabilitation, pain management, nutritional support, stroke rehabilitation, and post-surgical recovery. Through their unwavering dedication, they have earned their reputation as a trusted and reliable choice for seniors and their families.

Quality ratings

Measured by Centers for Medicare & Medicaid Services (CMS)

Overall rating Info The Overall CMS Rating combines results from health inspections, staffing levels and quality measures. Health inspections carry the most weight. Staffing and quality scores can increase or decrease the final rating based on performance compared to state and national standards.
▼ 37.0% Below FL avg. ▼ 37.0% Below FL avg.FL average: 3.2Click the badge to see the full State ranking.Click here to see the full State ranking.
Health Inspection Info Based on the results of the facility's three most recent standard inspections and any complaint investigations. CMS reviews the number, scope, and severity of deficiencies, with more recent findings weighted more heavily.
▼ 64.4% Below FL avg. ▼ 64.4% Below FL avg.FL average: 2.8Click the badge to see the full State ranking.Click here to see the full State ranking.
Staffing Info Measures average nursing staff hours per resident per day, including Registered Nurses (RNs) and total nursing staff. Ratings are adjusted based on the level of care residents require and are compared to state and national benchmarks.
▲ 47.8% Above FL avg. ▲ 47.8% Above FL avg.FL average: 3.4Click the badge to see the full State ranking.Click here to see the full State ranking.
Quality Measures Info Based on clinical and physical health indicators reported to CMS, such as hospital readmissions, falls, pressure ulcers, and improvements in mobility. These measures reflect how well residents' health needs are being managed.
▼ 1.4% Below FL avg. ▼ 1.4% Below FL avg.FL average: 4.1Click the badge to see the full State ranking.Click here to see the full State ranking.

Staffing hours breakdown

Info Daily nursing hours per resident by staff type, reported to CMS. Higher is generally better — compare this facility to state and national averages to see where staffing stands.

Hours per resident per day — compared to Florida state averages

Total nursing care / resident Info This home is ranked 38th out of 253 homes in Florida for nurse hours. Total adjusted nursing hours per resident per day, combining RN, LPN, and aide time. CMS adjusts this for case-mix so facilities can be fairly compared.
4h 45m per day
Rank #38 / 253Nurse hours — State benchmarkedThis home is ranked 38th out of 253 homes in Florida. Shows adjusted nurse hours per resident per day benchmarked to the Florida average, with a ranking across 253 Florida facilities. More hours mean more direct care. The national average is about 3.5 hrs; below 3.0 is a red flag.Rankings are based only on facilities in Florida that report data for that category. Facilities without available data are excluded from the ranking.Click the rank badge to see the full State ranking.Click here to see the full State ranking.
This facility Florida avg (4h 2m per day)
vs Florida avg
+18%

1 of 6 metrics below state avg

Standout metric LPN / LVN is +15% above state avg
Staff type Hours / Day / Resident vs state avg
Registered Nurse (RN) Info RNs hold the highest nursing license and can assess residents, interpret test results, and direct care plans. More RN hours per day often signals stronger clinical oversight and faster response to health changes. 47m per day ▲ 8% State avg: 44m per day · National avg: 41m per day
LPN / LVN Info Licensed Practical Nurses (LPNs) or Licensed Vocational Nurses (LVNs) deliver routine hands-on care — medication administration, wound dressing, and monitoring vital signs. They work under RN supervision and make up a large share of daily bedside care. 54m per day ▲ 15% State avg: 47m per day · National avg: 52m per day
Nurse Aide Info Certified Nurse Aides (CNAs) provide the most direct day-to-day assistance: bathing, dressing, feeding, and mobility. Nurse aide hours are typically the largest staffing category and directly affect residents' quality of life. 2h 32m per day ▲ 9% State avg: 2h 20m per day · National avg: 2h 21m per day
Weekend Total Nursing Info Combined nursing hours (RN + LPN + Nurse Aide) per resident per day on weekends. Staffing often drops on weekends — this figure reveals whether the facility maintains adequate coverage outside of weekday hours. 3h 51m per day ▲ 9% State avg: 3h 31m per day · National avg: 3h 26m per day
Physical Therapist Info Hours per resident per day provided by licensed Physical Therapists (PTs) or PT Assistants. PT services help residents recover mobility after injury or illness and are especially important for post-acute (short-stay) rehabilitation. 1m per day ▼ 70% State avg: 5m per day · National avg: 4m per day
Weekend RN Info Registered nurse hours specifically on weekends. Facilities sometimes reduce RN presence on Saturdays and Sundays — a low weekend RN figure compared to weekday hours can indicate reduced clinical oversight when most administrative staff are absent. 33m per day ▲ 3% State avg: 32m per day · National avg: 29m per day

Capacity and availability

This home usually has limited availability

Higher occupancy than the Florida average: 84.3%
Occupancy rate
89.8% Rank #122 / 258Occupancy rate — State benchmarkedThis home is ranked 122nd out of 258 homes in Florida. Shows this facility's occupancy rate versus the Florida average, with its Statewide rank out of 258. Higher occupancy signals strong local demand and financial stability.Rankings are based only on facilities in Florida that report data for that category. Facilities without available data are excluded from the ranking.Click the rank badge to see the full State ranking.Click here to see the full State ranking.
Avg. Length of Stay
108 days
Bed community size
180-bed community Rank #56 / 1074Bed count — State benchmarkedThis home is ranked 56th out of 1074 homes in Florida. Shows this facility's certified or reported bed count compared to other Florida facilities. Larger communities may offer more amenities, programs, and on-site services for residents and families.Rankings are based only on facilities in Florida that report data for that category. Facilities without available data are excluded from the ranking.Click the rank badge to see the full State ranking.Click here to see the full State ranking.
A large-scale community that may provide a wide range of amenities, services, and structured programs.
Walk Score
Walk Score: 37 / 100 Rank #787 / 1486Walk Score — State benchmarkedThis home is ranked 787th out of 1486 homes in Florida. Shows how walkable this facility's neighborhood is compared to the average Walk Score across Florida facilities. Higher scores benefit residents, families, and staff.Rankings are based only on facilities in Florida that report data for that category. Facilities without available data are excluded from the ranking.Click the rank badge to see the full State ranking.Click here to see the full State ranking.
Somewhat walkable. A few nearby services may be reachable on foot, but most trips require transportation.

Therapy & Rehabilitation

2 services
Rehabilitation Services
Respite Care

Staffing & Medical

1 service
24-Hour Staffing

Contact Page Rehabilitation and Healthcare Center

Staffing Data

Reporting period: October 1 – December 31, 2025 (Q4 2025). Source: CMS Payroll-Based Journal report.

Total staff 205
Employees 204
Contractors 1
Staff to resident ratio 1.93 : 1
31% more staff per resident than Florida average
Florida average ratio: 1.47 : 1 Florida average ratio: 1.47 : 1See full Florida ranking
Avg staff/day 90
Average shift 8.3 hours
5% better than Florida average
Florida average: 7.9 hours Florida average shift: 7.9 hoursSee full Florida ranking
Total staff hours (quarter) 68,368

Nursing staff breakdown

Q4 2025 · Oct 1 – Dec 31 More info This data comes from the CMS Payroll-Based Journal report covering October 1 – December 31, 2025.
Registered Nurse

Manages medical care and health needs.

RN Staff Info 38 total: 37 full-time employees and 1 contractor. 38
Average shift length Info Average shift length. Calculated as total hours divided by days worked and average staff per day. 9.2 hours
Licensed Practical Nurse

Assists with medical care and medications.

LPN Staff Info All 36 LPN Staff are full-time employees. No contractors work on this role. 36
Average shift length Info Average shift length. Calculated as total hours divided by days worked and average staff per day. 9.6 hours
Certified Nursing Assistant

Helps with daily care and mobility.

CNA Staff Info All 94 CNA Staff are full-time employees. No contractors work on this role. 94
Average shift length Info Average shift length. Calculated as total hours divided by days worked and average staff per day. 7.9 hours

Contractor staffing

Q4 2025 · Oct 1 – Dec 31 More info This data comes from the CMS Payroll-Based Journal report covering October 1 – December 31, 2025.

Total hours from contractors

0.7%

455 contractor hours this quarter

Registered Nurse: 1

Staff by category

Q4 2025 · Oct 1 – Dec 31 More info This data comes from the CMS Payroll-Based Journal report covering October 1 – December 31, 2025.
Certified Nursing Assistant 94 0 94 36,928 92 100% 7.9
Licensed Practical Nurse 36 0 36 12,223 92 100% 9.6
Registered Nurse 37 1 38 9,655 92 100% 9.2
Dietitian 11 0 11 2,050 92 100% 7.3
Clinical Nurse Specialist 3 0 3 1,372 65 71% 8
Mental Health Service Worker 3 0 3 1,252 70 76% 7.9
Therapeutic Recreation Specialist 4 0 4 873 67 73% 7.6
RN Director of Nursing 2 0 2 856 66 72% 7.9
Physical Therapy Assistant 4 0 4 495 82 89% 5.8
Administrator 1 0 1 488 61 66% 8
Nurse Practitioner 1 0 1 472 59 64% 8
Speech Language Pathologist 1 0 1 472 59 64% 8
Physical Therapy Aide 1 0 1 439 60 65% 7.3
Respiratory Therapy Technician 3 0 3 362 69 75% 5.1
Qualified Activities Professional 1 0 1 266 45 49% 5.9
Qualified Social Worker 2 0 2 166 31 34% 5.3
94 Certified Nursing Assistant
% of Days 100%
36 Licensed Practical Nurse
% of Days 100%
38 Registered Nurse
% of Days 100%
11 Dietitian
% of Days 100%
3 Clinical Nurse Specialist
% of Days 71%
3 Mental Health Service Worker
% of Days 76%
4 Therapeutic Recreation Specialist
% of Days 73%
2 RN Director of Nursing
% of Days 72%
4 Physical Therapy Assistant
% of Days 89%
1 Administrator
% of Days 66%
1 Nurse Practitioner
% of Days 64%
1 Speech Language Pathologist
% of Days 64%
1 Physical Therapy Aide
% of Days 65%
3 Respiratory Therapy Technician
% of Days 75%
1 Qualified Activities Professional
% of Days 49%
2 Qualified Social Worker
% of Days 34%

Penalties and fines

Includes penalties issued in 2023-2025

Federal penalties imposed by CMS for regulatory violations, including civil money penalties (fines) and denials of payment for new Medicare/Medicaid admissions.

Source: CMS Penalties Database (Data as of Jan 2026)

Total fines amount $195K Rank #255 / 258Federal fines — State benchmarkedThis home is ranked 255th out of 258 homes in Florida. Shows this facility's cumulative CMS federal fine dollars versus the Florida average among facilities with fines, and where it ranks among 258 facilities in the pool. Lower total dollars mean a better rank.Rankings are based only on facilities in Florida that report data for that category. Facilities without available data are excluded from the ranking.Click the rank badge to see the full State ranking.Click here to see the full State ranking.
171% higher than Florida average

Florida average: $72K

Number of fines 2
24% fewer fines than Florida average

Florida average: 2.6

Payment Denials Info Serious action where Medicare and/or Medicaid temporarily stops payments for new residents until issues are fixed. 0
100% fewer payment denials than Florida average

Florida average: 0.1

Fines amount comparison
This facility $195K
Florida average $72K
Penalty History

Penalties are imposed by CMS for violations of federal nursing home regulations.

2 penalties in the past 3 years

Multiple penalties were reported in the last 3 years.

Civil Money Penalty Info Fines imposed for noncompliance, which can be assessed per day or per instance of violation. Jan 10, 2025
$162K
Civil Money Penalty Info Fines imposed for noncompliance, which can be assessed per day or per instance of violation. Jul 27, 2023
$33K

Last updated: Jan 2026

Quality of care over time

These measures show how residents usually do over time at this home, based on health outcomes and preventive care.

High-risk clinical events score Info A composite score based on pressure ulcers, falls with injury, weight loss, walking ability decline, and activities of daily living decline. 10.6
43% worse than Florida average

Florida average: 7.4

Functional decline score Info A composite score based on activities of daily living decline, walking ability decline, and incontinence. 21.8
76% worse than Florida average

Florida average: 12.4

Long-stay resident measures
Significantly above average Florida avg: 4.5 Info CMS star rating based on long-stay quality measure performance. 5 stars = significantly above average, 1 star = significantly below average.
Need for Help with Daily Activities Increased Info Percent of long-stay residents whose need for help with daily activities has increased 15.0%
43% worse than Florida average

Florida average: 10.5%

Walking Ability Worsened Info Percent of long-stay residents whose ability to move independently worsened 27.1%
110% worse than Florida average

Florida average: 12.9%

Low Risk Residents with Bowel/Bladder Incontinence Info Percent of low risk long-stay residents who lose control of their bowels or bladder 23.3%
72% worse than Florida average

Florida average: 13.5%

Falls with Major Injury Info Percent of long-stay residents experiencing one or more falls with major injury 4.6%
74% worse than Florida average

Florida average: 2.6%

High Risk Residents with Pressure Ulcers Info Percent of long-stay high risk residents with pressure ulcers 2.1%
61% better than Florida average

Florida average: 5.4%

Urinary Tract Infection Info Percent of long-stay residents with a urinary tract infection 1.5%
64% worse than Florida average

Florida average: 0.9%

Lost Too Much Weight Info Percent of long-stay residents who lose too much weight 4.3%
28% better than Florida average

Florida average: 6.0%

Depressive Symptoms Info Percent of long-stay residents who have depressive symptoms 1.6%
53% better than Florida average

Florida average: 3.3%

Antipsychotic Use Info Percent of long-stay residents who received an antipsychotic medication 4.0%
50% better than Florida average

Florida average: 8.0%

Pneumococcal Vaccine Info Percent of long-stay residents assessed and appropriately given the pneumococcal vaccine 99.7%
In line with Florida average

Florida average: 97.7%

Influenza Vaccine Info Percent of long-stay residents assessed and appropriately given the seasonal influenza vaccine 100.0%
In line with Florida average

Florida average: 99.2%

Hospitalizations per 1,000 days Info Number of hospitalizations per 1,000 long-stay resident days. 1.58
25% better than Florida average

Florida average: 2.10

ED visits per 1,000 days Info Number of outpatient emergency department visits per 1,000 long-stay resident days. 1.57
33% worse than Florida average

Florida average: 1.18

Short-stay resident measures
Above average Florida avg: 3.1 Info CMS star rating based on short-stay quality measure performance. 5 stars = much above average, 1 star = much below average.
Pneumococcal Vaccine Info Percent of short-stay residents assessed and appropriately given the pneumococcal vaccine 97.8%
In line with Florida average

Florida average: 94.0%

Antipsychotic medication increase Info Percent of short-stay residents who newly received an antipsychotic medication 1.0%
36% better than Florida average

Florida average: 1.5%

Influenza Vaccine Info Percent of short-stay residents assessed and appropriately given the seasonal influenza vaccine 98.1%
In line with Florida average

Florida average: 94.7%

Re-hospitalized after SNF stay Info Percentage of short-stay residents who were re-hospitalized after their nursing home admission. 18.3%
30% better than Florida average

Florida average: 26.2%

Emergency department visits Info Percentage of short-stay residents who had an outpatient emergency department visit. 10.7%
15% worse than Florida average

Florida average: 9.3%

Falls with major injury Info Percentage of SNF residents who experience falls with major injury during their stay. 0.6%
27% better than Florida average

Florida average: 0.8%

Ability to care for self at discharge Info Percentage of residents at or above expected ability to care for themselves at discharge. 35.7%
33% worse than Florida average

Florida average: 53.7%

Successful return to home or community Info Rate of successful return to home or community from a skilled nursing facility. 48.7%
In line with Florida average

Florida average: 50.6%

Breakdown by payment type

Medicare

33% of new residents, usually for short-term rehab.

Typical stay 1 - 2 months

Private pay

53% of new residents, often for short stays.

Typical stay 1 - 2 months

Medicaid

14% of new residents, often for long-term daily care.

Typical stay 1 - 2 years

Facility Characteristics

Source: CMS Long-Term Care Facility Characteristics (Data as of Jan 2026)

Total residents 106
Medicare
13
12.3% of residents
Medicaid
93
87.7% of residents
Programs & Services
Residents Group

Residents meet regularly to discuss policies, care quality, and activities

Active Resident Council

Organized group of residents that meets regularly to discuss facility policies, quality of life, and activities.

Finances and operations

Based on CMS SNF Cost Report for fiscal year ending in 12/2023.

For-profit
Operated by a single business entity.
Net patient revenue Info Net patient revenue — what the home actually collects for resident care, after contractual allowances, bad debt and discounts are subtracted from its gross charges (CMS cost report, Worksheet G-3). It covers resident care only; money the home earns from other sources is shown separately as "Other income."
$19.6M
Net patient income Info Net patient income: net patient revenue minus the home's total operating expenses. A positive figure means it earns more from resident care than it spends to deliver it; a negative figure means the opposite. It excludes non-operating "other income."
$537.1K
For-profit Operated by a single business entity.
Net patient revenue Info Net patient revenue — what the home actually collects for resident care, after contractual allowances, bad debt and discounts are subtracted from its gross charges (CMS cost report, Worksheet G-3). It covers resident care only; money the home earns from other sources is shown separately as "Other income."
$19.6M Rank #82 / 257Revenue — State benchmarkedThis home is ranked 82nd out of 257 homes in Florida. Shows this facility's annual revenue compared to the Florida average. Higher revenue generally means more resources for staffing and capital — read alongside Payroll %.Rankings are based only on facilities in Florida that report data for that category. Facilities without available data are excluded from the ranking.Click the rank badge to see the full State ranking.Click here to see the full State ranking.
Net patient income Info Net patient income: net patient revenue minus the home's total operating expenses. A positive figure means it earns more from resident care than it spends to deliver it; a negative figure means the opposite. It excludes non-operating "other income."
$537.1K
Other income Info Money the home earns outside of resident care — such as investments, grants, rentals and other non-operating sources (CMS cost report, Worksheet G-3). It is tracked separately from net patient revenue: it is not part of that figure, and it is not included in net patient income.
$19.5K
Payroll costs Info Staff salaries plus wage-related costs — benefits such as payroll taxes, health insurance and retirement — from the home's own accounting records (CMS cost report, Worksheet A). Contract or agency labor is counted separately, under other operating costs. Rank #77 / 257Payroll — State benchmarkedThis home is ranked 77th out of 257 homes in Florida. Shows total annual staff payroll benchmarked to the Florida average. Higher payroll investment relative to peers often signals better staffing and less reliance on cheaper contract labor.Rankings are based only on facilities in Florida that report data for that category. Facilities without available data are excluded from the ranking.Click the rank badge to see the full State ranking.Click here to see the full State ranking.
$9.2M 47.1% of net patient revenue Info Payroll as a share of revenue: staff salaries and wage-related benefits divided by net patient revenue. A higher figure means more of each revenue dollar goes to staff pay. Rank #151 / 257Payroll % — State benchmarkedThis home is ranked 151st out of 257 homes in Florida. Shows payroll as a percentage of revenue versus the Florida average. Well-run Florida facilities typically land around 49–56% — the top third Statewide. Below 25% may signal understaffing or heavy agency use — read with Staffing ratings.Rankings are based only on facilities in Florida that report data for that category. Facilities without available data are excluded from the ranking.Click the rank badge to see the full State ranking.Click here to see the full State ranking.
Other operating costs Info Everything it costs to run the home apart from payroll — food, utilities, supplies, maintenance, contract labor and administration. Calculated as total operating expense minus payroll (staff salaries and wage-related benefits).
$9.8M
Total costs Info The home's total operating expense for the year — all the costs of running it, salaries included (CMS cost report, Worksheet G-3).
$19.0M

Who this home usually serves

TYPE OF STAY

Mix of rehab and long-term care

This home supports both short-term rehab and long-term care, with residents staying for a wide range of durations.

Most new residents arrive under private pay (53% of admissions), and a typical private pay stay runs around 1 - 2 months.

Admissions
553 total

Coverage residents most often arrive under.

Medicare 33%
Private pay 53%
Medicaid 14%
Discharges
549 total

Coverage residents most often leave under.

Medicare 23%
Private pay 46%
Medicaid 31%

Places of interest near Page Rehabilitation and Healthcare Center

Address 3.2 miles from city center Info Estimated distance in miles from Fort Myers's city center to Page Rehabilitation and Healthcare Center's address, calculated via Google Maps. — 2.4 miles to nearest hospital (Lee Memorial Hospital)

Calculate Travel Distance to Page Rehabilitation and Healthcare Center

Add your location

Address

Compare Nursing Homes around Fort Myers

The information below is reported by the Florida Agency for Health Care Administration (AHCA).

5 facilities compared · CMS & FL Dept. of Health data

The Preserve
NH
AL
MC
NC
Fort Myers
38
Facility 38
FL AVG 89
Rank #829 / 1074
88.1%
Facility 88.1%
FL AVG 84.3%
Rank #144 / 258
+5%
4.78
Facility 4.78
FL AVG 4.04
Rank #38 / 253
+33% +19%
$25.2k
Facility $25.2k
FL AVG $78.9k
Rank #207 / 258
97
Facility 97
FL AVG 83
Rank #68 / 876
10
Facility 10
FL AVG 19.7
Rank #48 / 252
2.5
Facility 2.5
FL AVG 4.5
Rank #35 / 252
1 67 -
9
Facility 9
FL AVG 40
Rank #1282 / 1486
Voa Lee County Health Care Facility, Inc
$11.2M
Facility $11.2M
FL AVG $15.7M
Rank #141 / 257
$7.3M
Facility $7.3M
FL AVG $6.1M
Rank #141 / 257
64.7%
Facility 64.7%
FL AVG 39.8%
Rank #131 / 257
106137
ProMedica Skilled Nursing and Rehabilitation Fort Myers East (Eagleridge)
NH
MC
PC
RC
Ft. Myers (Eagle Ridge Drive)
120
Facility 120
FL AVG 89
Rank #256 / 1074
87.2%
Facility 87.2%
FL AVG 84.3%
Rank #154 / 258
+3%
3.45
Facility 3.45
FL AVG 4.04
Rank #233 / 253
-16% -15%
$63.9k
Facility $63.9k
FL AVG $78.9k
Rank #223 / 258
-
27
Facility 27
FL AVG 19.7
Rank #190 / 252
4.5
Facility 4.5
FL AVG 4.5
Rank #141 / 252
3 112 -
17
Facility 17
FL AVG 40
Rank #1145 / 1486
Eagleridge Rehab Holdings
$7.8M
Facility $7.8M
FL AVG $15.7M
Rank #236 / 257
$4.3M
Facility $4.3M
FL AVG $6.1M
Rank #224 / 257
54.3%
Facility 54.3%
FL AVG 39.8%
Rank #19 / 257
106020
Fort Myers Nursing and Rehab
NH
HC
MC
RC
Fort Myers (Arborwood)
120
Facility 120
FL AVG 89
Rank #256 / 1074
100.0%
Facility 100.0%
FL AVG 84.3%
Rank #1 / 258
+19%
4.33
Facility 4.33
FL AVG 4.04
Rank #66 / 253
-6% +7%
$0
Facility $0
FL AVG $78.9k
Rank #1 / 258
-
23
Facility 23
FL AVG 19.7
Rank #169 / 252
7.7
Facility 7.7
FL AVG 4.5
Rank #235 / 252
1 118 -
73
Facility 73
FL AVG 40
Rank #179 / 1486
Hollywood Hills Holdings, LLC
$17.1M
Facility $17.1M
FL AVG $15.7M
Rank #129 / 257
$9.2M
Facility $9.2M
FL AVG $6.1M
Rank #87 / 257
53.6%
Facility 53.6%
FL AVG 39.8%
Rank #52 / 257
105427
Page Rehabilitation and Healthcare Center
NH
MC
RC
Fort Myers
180
Facility 180
FL AVG 89
Rank #56 / 1074
89.8%
Facility 89.8%
FL AVG 84.3%
Rank #122 / 258
+7%
4.75
Facility 4.75
FL AVG 4.04
Rank #38 / 253
+53% +18%
$195.4k
Facility $195.4k
FL AVG $78.9k
Rank #255 / 258
-
47
Facility 47
FL AVG 19.7
Rank #249 / 252
5.9
Facility 5.9
FL AVG 4.5
Rank #200 / 252
7 158 -
37
Facility 37
FL AVG 40
Rank #787 / 1486
Page Operating
$19.6M
Facility $19.6M
FL AVG $15.7M
Rank #82 / 257
$9.2M
Facility $9.2M
FL AVG $6.1M
Rank #77 / 257
47.1%
Facility 47.1%
FL AVG 39.8%
Rank #151 / 257
105864
Winkler Court
NH
NC
PC
RC
Fort Myers (Colonial Oaks)
120
Facility 120
FL AVG 89
Rank #256 / 1074
94.2%
Facility 94.2%
FL AVG 84.3%
Rank #39 / 258
+12%
3.87
Facility 3.87
FL AVG 4.04
Rank #126 / 253
+6% -4%
$178.9k
Facility $178.9k
FL AVG $78.9k
Rank #251 / 258
-
40
Facility 40
FL AVG 19.7
Rank #243 / 252
8.0
Facility 8.0
FL AVG 4.5
Rank #236 / 252
4 116 -
46
Facility 46
FL AVG 40
Rank #590 / 1486
Sally Boswell
$14.4M
Facility $14.4M
FL AVG $15.7M
Rank #155 / 257
$6.5M
Facility $6.5M
FL AVG $6.1M
Rank #122 / 257
45.3%
Facility 45.3%
FL AVG 39.8%
Rank #77 / 257
105882

Financial Assistance for
Nursing Home in Florida

Page Rehabilitation and Healthcare Center is located in Fort Myers, Florida.
Here are the financial assistance programs available to residents in Florida.

Get Financial aid guidance

Long-Term Care Waiver

Florida Medicaid LTC Waiver

Age 65+ or 21+ disabled
General Florida resident, Medicaid- eligible, nursing home-level care need.
Income Limits (2025) ~$2,829/month 300% FBR, individual
Asset Limits $2,000 (individual), $3,000 (couple).
FL

High demand; waitlists common.

Benefits
In-home care (6-8 hours/day) Assisted living Respite (240 hours/year) Case management

Community Care for the Elderly (CCE)

Florida CCE

Age 60+
General Florida resident, at risk of nursing home.
Income Limits ~$2,000/month varies
Asset Limits $5,000 individual
FL

Limited funding; regional variation.

Benefits
Homemaker services (3-5 hours/week) Adult day care (~$60/day) Respite (up to 10 days/year)

Home Care for the Elderly (HCE)

Florida Home Care for the Elderly

Age 60+
General Florida resident, at risk of nursing home placement; caregiver must be approved.
Income Limits (2025) ~$2,829/month individual, aligned with Medicaid thresholds
Asset Limits ~$2,000 (individual); varies by case manager discretion.
FL

Limited funding (~3,500 served annually); prioritizes low-income frail seniors.

Benefits
Basic subsidy (~$160/month) for housing/medical costs; special subsidies for supplies/services (e.g., incontinence supplies, ~$50-$200/month)

Program of All-Inclusive Care for the Elderly (PACE)

Florida Medicaid PACE

Age 55+
General Florida resident, nursing home-level care need, safe with PACE support.
Income Limits (2025) ~$2,829/month 300% FBR
Asset Limits $2,000 (individual), $3,000 (couple).
FL

Limited to specific counties (e.g., Hillsborough, Miami-Dade); ~10 sites statewide.

Benefits
Personal care (5-7 hours/day) Medical care Meals Transportation Therapy

Optional State Supplementation (OSS)

Florida Optional State Supplementation

Age 65+ or disabled
General Florida resident, living in approved facility, receiving SSI or low-income.
Income Limits (2025) ~$1,004/month individual, including SSI
Asset Limits $2,000 (individual), $3,000 (couple).
FL

Limited to specific facility types; ~$78.40/month max supplement.

Benefits
Cash payment (~$78.40/month) for room/board or personal needs in facilities

Frequently Asked Questions about Page Rehabilitation and Healthcare Center

Is Page Rehabilitation and Healthcare Center in a walkable area?

Page Rehabilitation and Healthcare Center has a walk score of 37. Somewhat walkable. A few nearby services may be reachable on foot, but most trips require transportation.

What is the occupancy rate at Page Rehabilitation and Healthcare Center?

Page Rehabilitation and Healthcare Center's occupancy is 89.8%.

Does Page Rehabilitation and Healthcare Center operate as a for-profit or non-profit?

Page Rehabilitation and Healthcare Center is registered as a for-profit.

Are there photos of Page Rehabilitation and Healthcare Center?

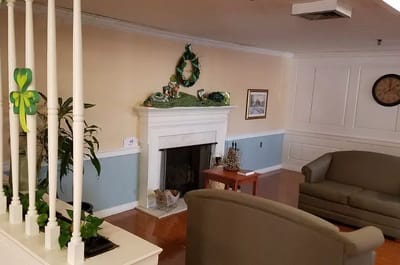
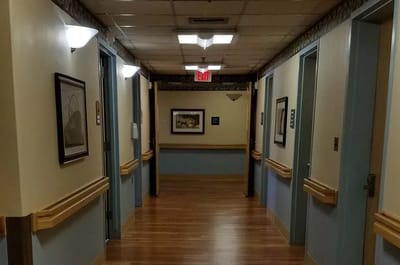
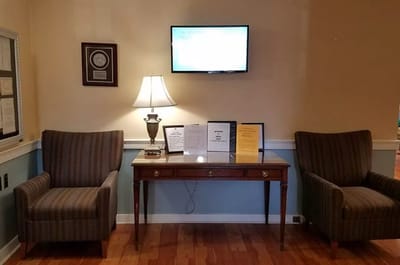
Yes — there are 5 photos of Page Rehabilitation and Healthcare Center in the photo gallery on this page.

What is the address of Page Rehabilitation and Healthcare Center?

Page Rehabilitation and Healthcare Center is located at 2310 N Airport Rd, Fort Myers, FL 33907.

What is the phone number of Page Rehabilitation and Healthcare Center?

(239) 931-8401 will put you in contact with the team at Page Rehabilitation and Healthcare Center.

Is Page Rehabilitation and Healthcare Center Medicare or Medicaid certified?

Yes — Page Rehabilitation and Healthcare Center is a CMS-certified provider of Medicare and Medicaid.

Guides for Better Senior Living

Care Cost Calculator: See Prices in Your Area

Nursing Home Data Explorer

Don’t Wait Too Long: 7 Red Flag Signs Your Parent Needs Assisted Living Now

The True Cost of Assisted Living in 2025 – And How Families Are Paying For It

Understanding Senior Living Costs: Pricing Models, Discounts & Financial Assistance