Parkway Health & Rehabilitation Center

Nursing Home
Overview of Parkway Health & Rehabilitation Center

The Parkway Health and Rehabilitation Center approaches its service with the understanding that its residents need a sense of healing– both on the physical and emotional level. The staff ensures residents are inspired to grow as better individuals through their enhanced lifestyle in a vibrant and positive environment. Families of Parkway Health and Rehabilitation Center can surely rest easy knowing that their loved ones are in good hands. 
Parkway is a comprehensive and flexible nursing home that focuses on skilled nursing, wound care, memory care, hospice care, and long-term and short-term care. The residents are surely enthralled because of the warm and welcoming environment the community strives to maintain. From dining experience to outdoor walking, or relaxing reading books– Parkway aims to satisfy the body, spirit, and mind of its residents.

Quality ratings

Measured by Centers for Medicare & Medicaid Services (CMS)

Overall rating Info Official CMS rating based on health inspections, staffing and quality measures.
1/5
Massachusetts average: 2.9/5
Health Inspection Info Official CMS rating based on deficiencies found during state health inspections.
1/5
Massachusetts average: 2.8/5
Staffing Info Official CMS rating based on nurse staffing hours per resident per day.
2/5
Massachusetts average: 3.0/5
Quality Measures Info Official CMS rating based on clinical outcomes for residents.
2/5
Massachusetts average: 3.2/5

Nursing care per resident

Info Average daily nursing hours per resident (adjusted for acuity). Higher values indicate more nursing time per resident.
3h 12m per day

This home provides 19% less nursing time per resident than the state average.

Massachusetts average: 3h 56m per day

Staffing hours breakdown

Info Hours of care per resident per day, broken down by staff type. Data from CMS Medicare.
Staff type Facility State avg National avg
Registered Nurse (RN) Info Registered nurse hours per resident per day. 39m per day 39m per day 41m per day
LPN / LVN Info Licensed Practical Nurse / Licensed Vocational Nurse hours per resident per day. 33m per day 58m per day 52m per day
Nurse Aide Info Nurse aide hours per resident per day. 1h 53m per day 2h 16m per day 2h 21m per day
Total Nursing (Weekend) Info Total number of nurse staff hours per resident per day on weekends. 2h 44m per day 3h 27m per day 3h 26m per day
Physical Therapist Info Physical therapist staff hours per resident per day. 2m per day 4m per day 4m per day
RN (Weekend) Info Registered nurse hours per resident per day on weekends. 24m per day 28m per day 29m per day

Capacity and availability

Medium-capacity home

Offers a balance of services and community atmosphere.

Total beds 141

This home usually has availability

Lower occupancy suggests more openings may be available.

Lower demand than the Massachusetts average
Occupancy rate 73.9%
Residents per day (avg) 129
Occupancy rate
73.9%
Residents per day (avg)
129

Who this home usually serves

TYPE OF STAY

Mostly short-term rehab stays

Most residents typically stay for a few weeks or months before returning home or moving on.

Might be optimal for
Short stays Recovery Medicare-covered care

Breakdown by payment type

Medicare

69% of new residents, usually for short-term rehab.

Typical stay 11 days

Private pay

17% of new residents, often for short stays.

Typical stay 3 years

Medicaid

14% of new residents, often for long-term daily care.

Typical stay 2 - 3 years

Finances and operations

Proprietary home
Corporation
Home revenue
$12.7M
Operating loss
-$2.0M
Proprietary home Corporation
Home revenue
$12,684,074.00
Operating loss
$-1,950,655.00
Payroll costs Info The portion of the home's budget spent on staff, including nurses, caregivers, and other employees who support care and operations.
$5.9M
46.4% of revenue
Other operating costs Info All remaining costs needed to run the home, such as food, utilities, building maintenance, supplies and administrative expenses.
$8.7M
Total costs $14.6M
Walk Score
Walk Score: 54 / 100
Moderately walkable. Some errands can be accomplished on foot, with a mix of nearby amenities.

About this community

Care Services

Nursing Services
Rehabilitation Services
Respite Care
Skilled Nursing
Licensed Nurses/CNAs
24-Hour Staffing
Short-Term Rehab

Programs & Activities

Specific Programs
24/7 Skilled Nursing, Short Term Rehabilitation, Long Term Care, Respite Care, Physical Therapy, Occupational Therapy, Speech Therapy, IV Therapy, Pain Management, Hospice Care, Dementia Management, Outpatient Dialysis, Wound Care, Peg Tube Care, Psych Services, Social Services, Medicaid Specialist, Podiatry Care, Dental/Vision/Audiology Services
Contact Parkway Health & Rehabilitation Center

Compare Nursing Homes around Boston

The information below is reported by the Massachusetts Executive Office of Elder Affairs and Department of Public Health.
Sherrill House
SNF

Nursing Home 24/7 care needed

AL

Assisted Living For seniors needing help with daily tasks but not full-time nursing.

Boston (Jamaica Hills)
182
No
78
SANTOS, JOAO
79.7%
$27,581,869.00
$17,186,014.00
62.3%
160.30
3/5
3.9438
2/5
4/5
5/5
-
27
-
+36%
0%
-3%
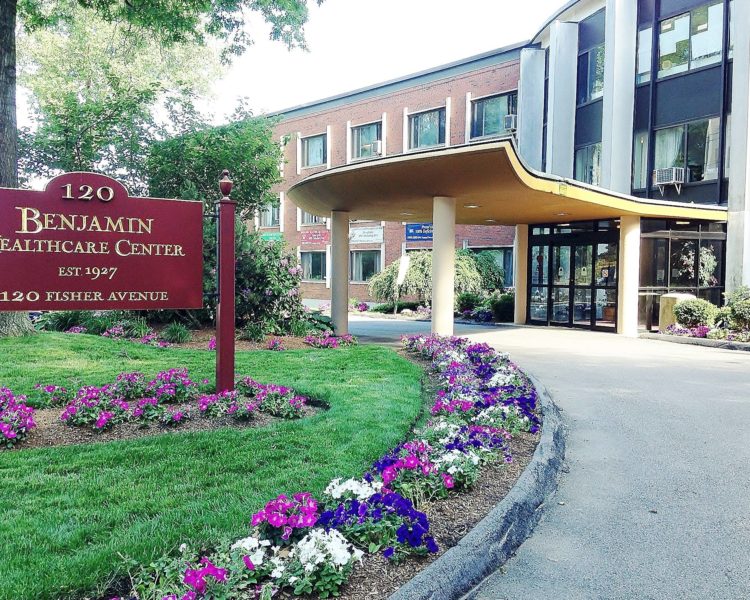
Edgar P. Benjamin Healthcare Center
SNF

Nursing Home 24/7 care needed

AL

Assisted Living For seniors needing help with daily tasks but not full-time nursing.

Boston (Mission Hill)
164
No
82
FRANCIS, TONY
49.3%
$9,969,054.00
$7,307,712.00
73.3%
82.20
1/5
3.4531
1/5
2/5
4/5
1
32
2
+12%
-12%
-40%
Parkway Health & Rehabilitation Center
SNF

Nursing Home 24/7 care needed

AL

Assisted Living For seniors needing help with daily tasks but not full-time nursing.

West Roxbury (West Roxbury)
141
No
54
POURALI, SAEED
73.9%
$12,630,209.00
$5,887,709.00
46.6%
128.60
1/5
3.2013
1/5
2/5
2/5
4
94
5
+1%
-19%
-10%
Marian Manor Nursing Home
AL

Assisted Living For seniors needing help with daily tasks but not full-time nursing.

IL

Independent Living For self-sufficient seniors seeking community and minimal assistance.

MC

Memory Care Specialized care for those with Memory Loss, Alzheimer's, or dementia, ensuring safety and support.

SNF

Nursing Homes 24/7 care needed

Boston (South Boston)
248
No
96
ANDERSON, KAHONEY
60.7%
$26,702,707.00
$8,074,575.00
30.2%
-
-
-
-
-
-
-
-
-
-
-
-26%
North End Rehabilitation & Healthcare Center
SNF

Nursing Home 24/7 care needed

AL

Assisted Living For seniors needing help with daily tasks but not full-time nursing.

-
-
No
100
-
-
-
-
-
-
-
-
-
-
-
-
-
-
-
-
-

Places of interest near Parkway Health & Rehabilitation Center

Address 0.6 miles from city center — 2.27 miles to nearest hospital (Hebrew Rehabilitation Center - Boston)

Address 1190 VFW Pkwy, West Roxbury, MA 02132

Calculate Travel Distance to Parkway Health & Rehabilitation Center

Add your location

Address

Staffing Data

Source: CMS Payroll-Based Journal (Q2 2025)

122
Total Staff
114
Employees
8
Contractors
39,369
Total Hours (Quarter)
52
Avg Staff/Day
8.3
Avg Shift (hrs)
Nursing Staff Breakdown
Role Count Avg Shift (hrs) Uses Contractors?
Registered Nurse169.5 No
Licensed Practical Nurse169.3 No
Certified Nursing Assistant568.3 No
Staff by Category
Administration
3 staff
6.3hs shift avg
Nursing Staff
92 staff
8.6hs shift avg
Physicians & Practitioners
7 staff
8.6hs shift avg
Therapy Services
12 staff
6.6hs shift avg
Activities & Recreation
0 staff
0hs shift avg
Social Services
2 staff
7.4hs shift avg
Dietary Services
2 staff
7.7hs shift avg
Other Services
4 staff
5.6hs shift avg
Contractor Analysis
1.1%
of total hours from contractors
436 contractor hours this quarter
Feeding Assistant: 2 Medical Director: 2 Diagnostic X-ray Services Staff: 3 Other Physician: 1
Role Employees Contractors Total Staff Total Hours Days Worked % of Days Avg Shift (hrs)
Certified Nursing Assistant5605621,77491100%8.3
Registered Nurse160165,86891100%9.5
Licensed Practical Nurse160165,48891100%9.3
Clinical Nurse Specialist5051,4847582%9.1
Physical Therapy Assistant4047807279%7.4
Nurse Practitioner1015596774%8.3
Administrator1015126470%8
Other Dietary Services Staff2025026268%7.7
RN Director of Nursing2024395257%7.1
Respiratory Therapy Technician4043796268%5.1
Occupational Therapy Aide1013515055%7
Respiratory Therapist1013114549%6.9
Mental Health Service Worker1012955358%5.6
Feeding Assistant0222104448%4.4
Qualified Social Worker2021341820%7.4
Diagnostic X-ray Services Staff0331342325%5.8
Speech Language Pathologist202591112%5.3
Medical Director022532426%2
Other Physician011391314%3

Health Inspection History

Inspections
Total health inspections 11

Massachusetts average 4.5


Last Health inspection on Nov 2025

Total health citations 94
Citations per inspection
8.55

Health citations are formal notices following inspections when they fail to comply with safety and care standards.

82 of 94 citations resulted from standard inspections; and 12 of 94 resulted from complaint investigations.

Breakdown of citation severity (last 3 years)
Critical Health citations More info 0
100% better than Massachusetts average

Massachusetts average: 0.3


Serious Health citations More info 5
233% worse than Massachusetts average

Massachusetts average: 1.5

0 critical citations More info Massachusetts average: 0.3

5 serious citations More info Massachusetts average: 1.5

87 moderate citations More info Massachusetts average: 29.7

2 minor citations More info Massachusetts average: 1.3
Citations history (last 3 years)
Quality of Care moderate citation Nov 17, 2025
Corrected

Resident Rights moderate citation Nov 17, 2025
Corrected

Abuse/Neglect moderate citation May 20, 2025
Corrected

Pharmacy serious citation Mar 19, 2025
Corrected

Facility Characteristics

Source: CMS Long-Term Care Facility Characteristics (Data as of Jan 2026)

Ownership: For-Profit LLC
Part of: Bear Mountain Healthcare
Resident Census by Payment Source
132 Total Residents
Medicare 11 (8.3%)
Medicaid 119 (90.2%)
Private Pay/Other 2 (1.5%)
Programs & Services
Residents' Group
Family Engagement

Active councils help families stay involved in care decisions and facility operations.

Quality of care over time

These measures show how residents usually do over time at this home, based on health outcomes and preventive care.

High-risk clinical events score Info A composite score based on pressure ulcers, falls with injury, weight loss, walking ability decline, and activities of daily living decline. 10.0
In line with Massachusetts average

Massachusetts average: 10.2

Functional decline score Info A composite score based on activities of daily living decline, walking ability decline, and incontinence. 14.0
30% better than Massachusetts average

Massachusetts average: 20.0

Long-stay resident measures
Need for Help with Daily Activities Increased Info Percent of long-stay residents whose need for help with daily activities has increased 21.0%
12% worse than Massachusetts average

Massachusetts average: 18.7%

Walking Ability Worsened Info Percent of long-stay residents whose ability to move independently worsened 15.6%
20% better than Massachusetts average

Massachusetts average: 19.3%

Low Risk Residents with Bowel/Bladder Incontinence Info Percent of low risk long-stay residents who lose control of their bowels or bladder 5.4%
75% better than Massachusetts average

Massachusetts average: 22.1%

Falls with Major Injury Info Percent of long-stay residents experiencing one or more falls with major injury 2.5%
31% better than Massachusetts average

Massachusetts average: 3.6%

High Risk Residents with Pressure Ulcers Info Percent of long-stay high risk residents with pressure ulcers 4.8%
In line with Massachusetts average

Massachusetts average: 4.7%

Urinary Tract Infection Info Percent of long-stay residents with a urinary tract infection 2.6%
23% worse than Massachusetts average

Massachusetts average: 2.1%

Lost Too Much Weight Info Percent of long-stay residents who lose too much weight 6.4%
23% worse than Massachusetts average

Massachusetts average: 5.2%

Depressive Symptoms Info Percent of long-stay residents who have depressive symptoms 1.0%
91% better than Massachusetts average

Massachusetts average: 10.7%

Antipsychotic Use Info Percent of long-stay residents who received an antipsychotic medication 19.5%
In line with Massachusetts average

Massachusetts average: 20.3%

Pneumococcal Vaccine Info Percent of long-stay residents assessed and appropriately given the pneumococcal vaccine 92.3%
In line with Massachusetts average

Massachusetts average: 91.9%

Influenza Vaccine Info Percent of long-stay residents assessed and appropriately given the seasonal influenza vaccine 99.2%
5% better than Massachusetts average

Massachusetts average: 94.8%

Hospitalizations per 1,000 days Info Number of hospitalizations per 1,000 long-stay resident days. 1.42
24% better than Massachusetts average

Massachusetts average: 1.86

ED visits per 1,000 days Info Number of outpatient emergency department visits per 1,000 long-stay resident days. 0.95
38% better than Massachusetts average

Massachusetts average: 1.54

Short-stay resident measures
Pneumococcal Vaccine Info Percent of short-stay residents assessed and appropriately given the pneumococcal vaccine 60.4%
21% worse than Massachusetts average

Massachusetts average: 76.7%

Antipsychotic medication increase Info Percent of short-stay residents who newly received an antipsychotic medication 3.4%
155% worse than Massachusetts average

Massachusetts average: 1.3%

Influenza Vaccine Info Percent of short-stay residents assessed and appropriately given the seasonal influenza vaccine 94.9%
22% better than Massachusetts average

Massachusetts average: 77.7%

Re-hospitalized after SNF stay Info Percentage of short-stay residents who were re-hospitalized after their nursing home admission. 25.7%
In line with Massachusetts average

Massachusetts average: 25.8%

Emergency department visits Info Percentage of short-stay residents who had an outpatient emergency department visit. 5.4%
54% better than Massachusetts average

Massachusetts average: 11.8%

Falls with major injury Info Percentage of SNF residents who experience falls with major injury during their stay. 0.0%
100% better than Massachusetts average

Massachusetts average: 0.8%

Successful return to home or community Info Rate of successful return to home or community from a skilled nursing facility. 32.8%
35% worse than Massachusetts average

Massachusetts average: 50.6%

Penalties and fines

Federal penalties imposed by CMS for regulatory violations, including civil money penalties (fines) and denials of payment for new Medicare/Medicaid admissions.

Source: CMS Penalties Database (Data as of Jan 2026)

Total fines amount $187K
160% higher than Massachusetts average

Massachusetts average: $72K

Number of fines 3
75% more fines than Massachusetts average

Massachusetts average: 1.7

Payment Denials Info Serious action where Medicare and/or Medicaid temporarily stops payments for new residents until issues are fixed. 0
100% fewer payment denials than Massachusetts average

Massachusetts average: 0.1

Fines amount comparison
This facility $187K
Massachusetts average $72K
Penalty History

Penalties are imposed by CMS for violations of federal nursing home regulations.

Civil Money Penalty Info Fines imposed for noncompliance, which can be assessed per day or per instance of violation. Feb 13, 2025
$11K
Civil Money Penalty Info Fines imposed for noncompliance, which can be assessed per day or per instance of violation. Nov 30, 2023
$18K
Civil Money Penalty Info Fines imposed for noncompliance, which can be assessed per day or per instance of violation. May 25, 2023
$158K

Last updated: Jan 2026

Guides for Better Senior Living

Care Cost Calculator: See Prices in Your Area

Nursing Home Data Explorer

Don’t Wait Too Long: 7 Red Flag Signs Your Parent Needs Assisted Living Now

The True Cost of Assisted Living in 2025 – And How Families Are Paying For It

Understanding Senior Living Costs: Pricing Models, Discounts & Financial Assistance

Financial Aid for Massachusetts Seniors

Get financial aid guidance

Home Care Program

MassHealth Home Care

Age 60+, Massachusetts resident, at risk of nursing home placement.

~$1,500/month (individual, varies by region).

$2,000 (individual, excludes home, car).

Coordinated through Aging Services Access Points (ASAPs); high demand in urban areas.

Frail Elder Waiver

Massachusetts Medicaid FE Waiver

Age 65+, Massachusetts resident, Medicaid-eligible, nursing home-level care need.

~$2,829/month (300% FBR, individual).

$2,000 (individual), $3,000 (couple).

Requires clinical eligibility determination.

Senior Care Options (SCO)

Massachusetts Senior Care Options

Age 65+, Massachusetts resident, eligible for MassHealth (Medicare optional), nursing home-level care need.

~$2,829/month (300% FBR, individual); QIT allowed.

$2,000 (individual), $3,000 (couple) (excludes home up to $713,000, car).

Not available in Dukes/Nantucket Counties; multiple SCO providers (e.g., CCA, Tufts).

Medicare Savings Program (MSP)

Massachusetts Medicare Savings Program (MassHealth Buy-In)

Age 65+ or disabled, Massachusetts resident, Medicare Part A/B.

~$2,510/month (QMB), ~$3,380/month (SLMB), ~$3,598/month (QI)—individual.

$9,430 (individual), $14,130 (couple).

Three tiers; no waitlist; includes Extra Help for Part D.

National Family Caregiver Support Program (NFCSP) Respite

Massachusetts NFCSP Respite Care

Caregivers of 60+ needing care or 55+ caregivers of others; Massachusetts resident; functional needs (2+ ADLs).

Prioritizes ~$24,980/year (individual); no strict cap.

Not assessed; need-based.

27 ASAPs; prioritizes low-income, rural caregivers.

Prescription Advantage

Massachusetts Prescription Advantage

Age 65+ or disabled, Massachusetts resident, enrolled in Medicare Part D (or ineligible for Medicare).

No strict limit; copays vary by income (~$24,980-$75,000/year individual).

Not assessed.

Supplements Medicare Part D; no enrollment fee for low-income.

Senior Community Service Employment Program (SCSEP)

Massachusetts SCSEP

Age 55+, unemployed, low-income, Massachusetts resident.

~$1,983/month (125% FPL).

Not specified; income-focused.

Priority for veterans, rural residents; AARP partnership.

VA Aid and Attendance (A&A) and Housebound Benefits

Massachusetts VA Aid and Attendance/Housebound

Age 65+ or disabled veteran/spouse, Massachusetts resident, wartime service, need for ADL help (A&A) or homebound.

Net income < ~$1,984/month (veteran with dependent, A&A); pension offsets income.

~$155,356 (net worth limit).

High veteran demand statewide.

Who we are

Your Senior Care Partner, Every Step of the Way

We help families find affordable senior communities and unlock same day discounts, Medicaid, and Medicare options tailored to your needs.

Contact us Today