


Occupancy rate
100%
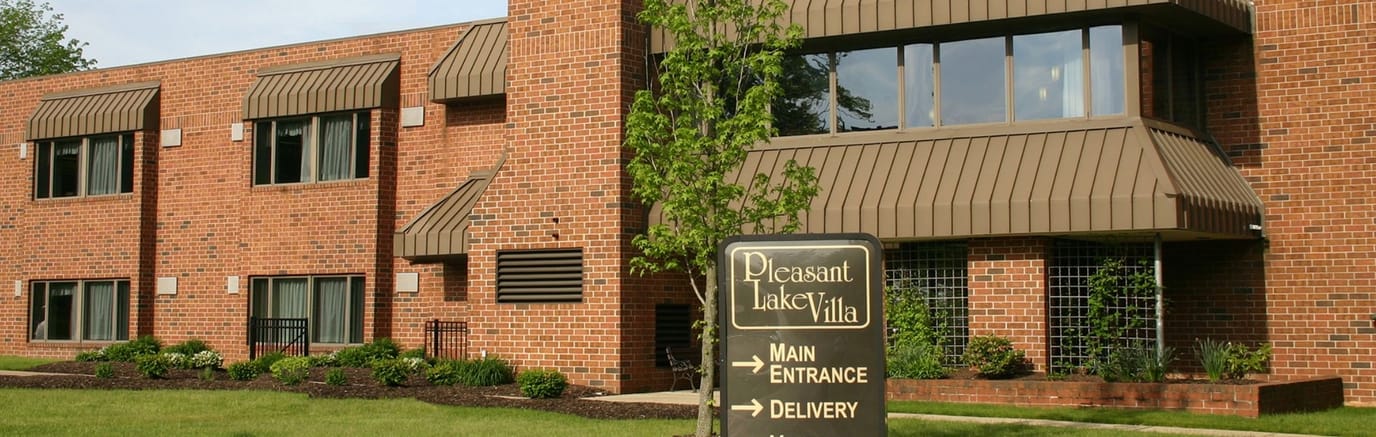
Located on Ridge Road in Parma, Ohio, Pleasant Lake Villa is a skilled nursing home serving the Cleveland area. The 66-bed community has full occupancy. It specializes in short-term rehabilitation and post-acute recovery.
Residents stay an average of 92 days, because the home is focused on helping people recover after they have been hospitalized or had surgery. It also serves people who need longer-term care. Medicare, Medicaid, and private pay are accepted, providing families with multiple options for covering the costs of care.
Nurse staffing averages 3 hours and 12 minutes per resident each day. This includes 30 minutes of registered nurse care, 2 hours and 6 minutes of nurse aide support, and 30 minutes of licensed practical or vocational nurse care. The staffing structure supports round-the-clock care and regular clinical oversight.
Rehabilitation is the facility’s primary clinical focus. Physical, occupational, and speech therapy are available up to seven days a week. On-site cardiology and pulmonary specialists support residents with more complex medical needs. Advanced respiratory therapy is also available daily. A certified wound care nurse provides specialized wound treatment, and full-time nurse practitioners oversee medical care and coordination.
The facility has a secure, activity-based memory care unit for residents with cognitive decline. Respite care is available to families who need temporary support. Private suites are available in the short-term rehabilitation unit, giving residents a comfortable space between therapy sessions.
Dining services accommodate a variety of dietary needs. A private dining room is available for family gatherings. Residents and visitors have access to complimentary Wi-Fi, along with lounges and activity spaces throughout the community.
Having served the area for 48 years, Pleasant Lake Villa has a long history in the Parma community. The location is in a car-dependent area, so most visits and errands require a vehicle.
| Staff type | Hours / Day / Resident | vs state avg |
|---|---|---|
|
Registered Nurse (RN)
| 30m per day | ▼ 21% State avg: 38m per day · National avg: 41m per day |
|
LPN / LVN
| 1h 6m per day | ▲ 14% State avg: 58m per day · National avg: 52m per day |
|
Nurse Aide
| 2h 6m per day | ■ Avg State avg: 2h 8m per day · National avg: 2h 20m per day |
|
Weekend Total Nursing
| 3h 22m per day | ▲ 3% State avg: 3h 17m per day · National avg: 3h 26m per day |
|
Physical Therapist
| 2m per day | ▼ 36% State avg: 3m per day · National avg: 4m per day |
|
Weekend RN
| 23m per day | ▼ 9% State avg: 25m per day · National avg: 28m per day |
Pleasant Lake Villa is administered by James J.
Key information about the people who lead and staff this community.
In Ohio, the Department of Health, Bureau of Survey and Certification conducts unannounced onsite inspections to evaluate the quality of care and environment in all licensed facilities.
Citations
| This Facility | OH Average | vs. OH Avg |
|---|---|---|---|
|
Total citations
| 3 | 2 | This facility has 50% more total citations than a typical Ohio nursing home (3 vs. OH avg 2).↑ 50% worse |
Every two years, the Ohio Department of Aging and the Office of the State Long-Term Care Ombudsman organizations conduct a satisfaction survey among residents in long-term care facilities to assess their quality of care and life.
Ohio average: 80 / 100
Ohio average: 64 / 100
Ohio average: 95 / 100
Ohio average: 92 / 100
Ohio average: 86 / 100
Ohio average: 78 / 100
Ohio average: 71 / 100
Ohio average: 73 / 100
Based on the RCF Resident Satisfaction Survey 2022-23, Final Results
Scores represent percent of positive resident responses for each item, excluding "don't know" and "not applicable" responses and instances where the question was skipped.
Based on the RCF Resident Satisfaction Survey 2022-23, Final Results
Scores represent percent of positive resident responses for each item, excluding "don't know" and "not applicable" responses and instances where the question was skipped.
Based on the RCF Resident Satisfaction Survey 2022-23, Final Results
Scores represent percent of positive resident responses for each item, excluding "don't know" and "not applicable" responses and instances where the question was skipped.
Based on the RCF Resident Satisfaction Survey 2022-23, Final Results
Scores represent percent of positive resident responses for each item, excluding "don't know" and "not applicable" responses and instances where the question was skipped.
Based on the RCF Resident Satisfaction Survey 2022-23, Final Results
Scores represent percent of positive resident responses for each item, excluding "don't know" and "not applicable" responses and instances where the question was skipped.
Based on the RCF Resident Satisfaction Survey 2022-23, Final Results
Scores represent percent of positive resident responses for each item, excluding "don't know" and "not applicable" responses and instances where the question was skipped.
Based on the RCF Resident Satisfaction Survey 2022-23, Final Results
Scores represent percent of positive resident responses for each item, excluding "don't know" and "not applicable" responses and instances where the question was skipped.
State average 6.7
Last Health inspection on Mar 2025
State average 30.9
State average 4.59
Health citations are formal notices following inspections when they fail to comply with safety and care standards.
12 of 20 citations resulted from standard inspections; and 8 of 20 resulted from complaint investigations.
State average: 0.3
State average: 0.9
Reporting period: October 1 – December 31, 2025 (Q4 2025). Source: CMS Payroll-Based Journal report.
Manages medical care and health needs.
Assists with medical care and medications.
Helps with daily care and mobility.
Total hours from contractors
1,055 contractor hours this quarter
| Certified Nursing Assistant | 110 | 0 | 110 | 33,221 | 92 | 100% | 8 |
| Licensed Practical Nurse | 55 | 0 | 55 | 16,091 | 92 | 100% | 8.8 |
| Registered Nurse | 22 | 1 | 23 | 6,189 | 92 | 100% | 7.7 |
| RN Director of Nursing | 6 | 0 | 6 | 2,010 | 71 | 77% | 8 |
| Other Dietary Services Staff | 4 | 0 | 4 | 1,987 | 92 | 100% | 8.2 |
| Clinical Nurse Specialist | 2 | 6 | 8 | 1,573 | 78 | 85% | 5.6 |
| Dental Services Staff | 15 | 0 | 15 | 1,555 | 65 | 71% | 9.1 |
| Speech Language Pathologist | 7 | 0 | 7 | 1,252 | 79 | 86% | 6.5 |
| Physical Therapy Aide | 8 | 0 | 8 | 1,070 | 92 | 100% | 6.4 |
| Physical Therapy Assistant | 4 | 0 | 4 | 1,010 | 75 | 82% | 7.3 |
| Nurse Aide in Training | 5 | 0 | 5 | 938 | 77 | 84% | 7.7 |
| Respiratory Therapy Technician | 4 | 0 | 4 | 529 | 68 | 74% | 5.6 |
| Nurse Practitioner | 1 | 0 | 1 | 496 | 62 | 67% | 8 |
| Administrator | 1 | 0 | 1 | 480 | 60 | 65% | 8 |
| Qualified Social Worker | 1 | 0 | 1 | 441 | 62 | 67% | 7.1 |
| Occupational Therapy Aide | 1 | 0 | 1 | 440 | 55 | 60% | 8 |
| Dietitian | 1 | 0 | 1 | 440 | 55 | 60% | 8 |
| Qualified Activities Professional | 3 | 0 | 3 | 390 | 55 | 60% | 6.8 |
| Mental Health Service Worker | 2 | 0 | 2 | 350 | 48 | 52% | 7 |
| Medication Aide/Technician | 4 | 0 | 4 | 327 | 50 | 54% | 6.2 |
Federal penalties imposed by CMS for regulatory violations, including civil money penalties (fines) and denials of payment for new Medicare/Medicaid admissions.
Source: CMS Penalties Database
No penalties in the past 3 years
No civil money penalties or payment denials were reported in the last 3 years.
These measures show how residents usually do over time at this home, based on health outcomes and preventive care.
Ohio average: 5.8
Ohio average: 12.7
Ohio average: 6.8%
Ohio average: 8.9%
Ohio average: 22.0%
Ohio average: 3.4%
Ohio average: 3.9%
Ohio average: 0.5%
Ohio average: 6.2%
Ohio average: 24.0%
Ohio average: 8.4%
Ohio average: 92.4%
Ohio average: 94.5%
Ohio average: 78.0%
Ohio average: 1.3%
Ohio average: 75.6%
Ohio average: 25.1%
Ohio average: 12.5%
Ohio average: 0.8%
Ohio average: 53.7%
Ohio average: 50.6%
Quality measures are calculated from Minimum Data Set (MDS) assessments. For most measures, lower percentages indicate better care quality.
17% of new residents, usually for short-term rehab.
78% of new residents, often for short stays.
6% of new residents, often for long-term daily care.
Source: CMS Long-Term Care Facility Characteristics (Data as of Jan 2026)
Residents meet regularly to discuss policies, care quality, and activities
Family members meet regularly to discuss policies, care quality, and activities
Organized group of family members that meets regularly to discuss facility policies, resident care, and activities.
Organized group of residents that meets regularly to discuss facility policies, quality of life, and activities.
Data sourced from CMS Long-Term Care Facility Characteristics quarterly report. Payer mix reflects the current resident census by primary payment source.
Historical financial and operational data for Pleasant Lake Villa from 2011–2023, based on CMS SNF Cost Reports.
Key figures below are for fiscal year ending in 12/2023.
Based on CMS SNF Cost Report for fiscal year ending in 12/2023.
Residents typically stay for brief periods, with frequent admissions and discharges throughout the year.
Most new residents arrive under private pay (78% of admissions), and a typical private pay stay runs around 2 - 3 months.
Coverage residents most often arrive under.
Coverage residents most often leave under.
![]() 1.2 miles from city center
1.2 miles from city center
![]() Estimated distance in miles from Parma's city center to Pleasant Lake Villa's address, calculated via Google Maps.
Estimated distance in miles from Parma's city center to Pleasant Lake Villa's address, calculated via Google Maps.
Add your location
The information below is reported by the Ohio Department of Health, Bureau of Survey and Certification.
| Brookdale Westlake Village | NH AL IL MC SNF | Westlake | 60
Facility
60
OH AVG
75
Rank
#177 / 309 |
96.7%
Facility
96.7%
OH AVG
81.7
Rank
#4 / 138 | +18% | 4.38
Facility
4.38
OH AVG
3.54
Rank
#25 / 199 | +18% | +24% | $0
Facility
$0
OH AVG
$74.0k
Rank
#1 / 200 | 5
Facility
5
OH AVG
30.9
Rank
#10 / 199 | 1.3
Facility
1.3
OH AVG
4.6
Rank
#2 / 199 | - | 58 | A+ |
25
Facility
25
OH AVG
40
Rank
#500 / 704 | Labeed Diab | $20.1MFiscal year ending 12/2023
Facility
$20.1MFiscal year ending 12/2023
OH AVG
$10.1M
Rank
#74 / 199 | $10.2MFiscal year ending 12/2023
Facility
$10.2MFiscal year ending 12/2023
OH AVG
$3.9M
Rank
#14 / 199 | 50.8%Fiscal year ending 12/2023
Facility
50.8%Fiscal year ending 12/2023
OH AVG
40.2%
Rank
#6 / 199 | 366373 | ||||
| The Knolls of Oxford | NH AL IL MC SNF | Oxford | 50
Facility
50
OH AVG
75
Rank
#214 / 309 |
92.8%
Facility
92.8%
OH AVG
81.7
Rank
#25 / 138 | +14% | 4.09
Facility
4.09
OH AVG
3.54
Rank
#42 / 199 | -31% | +15% | $0
Facility
$0
OH AVG
$74.0k
Rank
#1 / 200 | 4
Facility
4
OH AVG
30.9
Rank
#4 / 199 | 2.0
Facility
2.0
OH AVG
4.6
Rank
#11 / 199 | - | 46 | - |
0
Facility
0
OH AVG
40
Rank
#686 / 704 | Ronald Beymer | $6.2MFiscal year ending 12/2023
Facility
$6.2MFiscal year ending 12/2023
OH AVG
$10.1M
Rank
#157 / 199 | $4.3MFiscal year ending 12/2023
Facility
$4.3MFiscal year ending 12/2023
OH AVG
$3.9M
Rank
#130 / 199 | 69.5%Fiscal year ending 12/2023
Facility
69.5%Fiscal year ending 12/2023
OH AVG
40.2%
Rank
#22 / 199 | 366282 | ||||
| Elizabeth Scott Community | NH AL MC SNF | Maumee | 60
Facility
60
OH AVG
75
Rank
#177 / 309 |
86.7%
Facility
86.7%
OH AVG
81.7
Rank
#68 / 138 | +6% | 3.52
Facility
3.52
OH AVG
3.54
Rank
#95 / 199 | -64% | -1% | $0
Facility
$0
OH AVG
$74.0k
Rank
#1 / 200 | 9
Facility
9
OH AVG
30.9
Rank
#22 / 199 | 2.3
Facility
2.3
OH AVG
4.6
Rank
#17 / 199 | - | 52 | A+ |
0
Facility
0
OH AVG
40
Rank
#686 / 704 | Elizabeth Scott, Inc | $6.7MFiscal year ending 12/2023
Facility
$6.7MFiscal year ending 12/2023
OH AVG
$10.1M
Rank
#140 / 199 | $3.2MFiscal year ending 12/2023
Facility
$3.2MFiscal year ending 12/2023
OH AVG
$3.9M
Rank
#129 / 199 | 48%Fiscal year ending 12/2023
Facility
48%Fiscal year ending 12/2023
OH AVG
40.2%
Rank
#58 / 199 | 366184 | ||||
| Locust Ridge | NH MC RC SNF | Williamsburg | 61
Facility
61
OH AVG
75
Rank
#174 / 309 |
90.2%
Facility
90.2%
OH AVG
81.7
Rank
#42 / 138 | +10% | 4.46
Facility
4.46
OH AVG
3.54
Rank
#21 / 199 | +35% | +26% | $0
Facility
$0
OH AVG
$74.0k
Rank
#1 / 200 | 18
Facility
18
OH AVG
30.9
Rank
#51 / 199 | 4.5
Facility
4.5
OH AVG
4.6
Rank
#117 / 199 | - | 55 | A+ |
0
Facility
0
OH AVG
40
Rank
#686 / 704 | Gary Vannostrand | $5.9MFiscal year ending 12/2023
Facility
$5.9MFiscal year ending 12/2023
OH AVG
$10.1M
Rank
#168 / 199 | $2.7MFiscal year ending 12/2023
Facility
$2.7MFiscal year ending 12/2023
OH AVG
$3.9M
Rank
#161 / 199 | 45.2%Fiscal year ending 12/2023
Facility
45.2%Fiscal year ending 12/2023
OH AVG
40.2%
Rank
#40 / 199 | 365336 | ||||
| Pleasant Lake Villa | NH AL HOS MC RC SNF | Parma | 66
Facility
66
OH AVG
75
Rank
#167 / 309 | - | - | 3.20
Facility
3.20
OH AVG
3.54
Rank
#141 / 199 | -6% | -10% | $0
Facility
$0
OH AVG
$74.0k
Rank
#1 / 200 | 20
Facility
20
OH AVG
30.9
Rank
#59 / 199 | 2.9
Facility
2.9
OH AVG
4.6
Rank
#37 / 199 | 1 | 189 | C- |
18
Facility
18
OH AVG
40
Rank
#560 / 704 | - | $18.7MFiscal year ending 12/2023
Facility
$18.7MFiscal year ending 12/2023
OH AVG
$10.1M
Rank
#13 / 199 | $10.8MFiscal year ending 12/2023
Facility
$10.8MFiscal year ending 12/2023
OH AVG
$3.9M
Rank
#10 / 199 | 57.7%Fiscal year ending 12/2023
Facility
57.7%Fiscal year ending 12/2023
OH AVG
40.2%
Rank
#91 / 199 | 365706 |
Sharon Santoli is the Director of Nursing at Pleasant Lake Villa.
Pleasant Lake Villa has a walk score of 18. Car-dependent. Most errands require a car, with limited nearby walkable options.
Pleasant Lake Villa's occupancy is 100%.
Pleasant Lake Villa has been operating for approximately 48 years, based on available licensing and registration records.
No, Pleasant Lake Villa has a no-pet policy.
Pleasant Lake Villa is registered as a for-profit in OH.
James J is the administrator of Pleasant Lake Villa.
Care Cost Calculator: See Prices in Your Area
Nursing Home Data Explorer
Don’t Wait Too Long: 7 Red Flag Signs Your Parent Needs Assisted Living Now
The True Cost of Assisted Living in 2025 – And How Families Are Paying For It
Understanding Senior Living Costs: Pricing Models, Discounts & Financial Assistance


