Nursing Home

Princeton Medical Lodge

Nursing Home

Princeton Medical Lodge

1401 W Princeton Dr, Princeton, TX 75407 View map
Overview of Princeton Medical Lodge

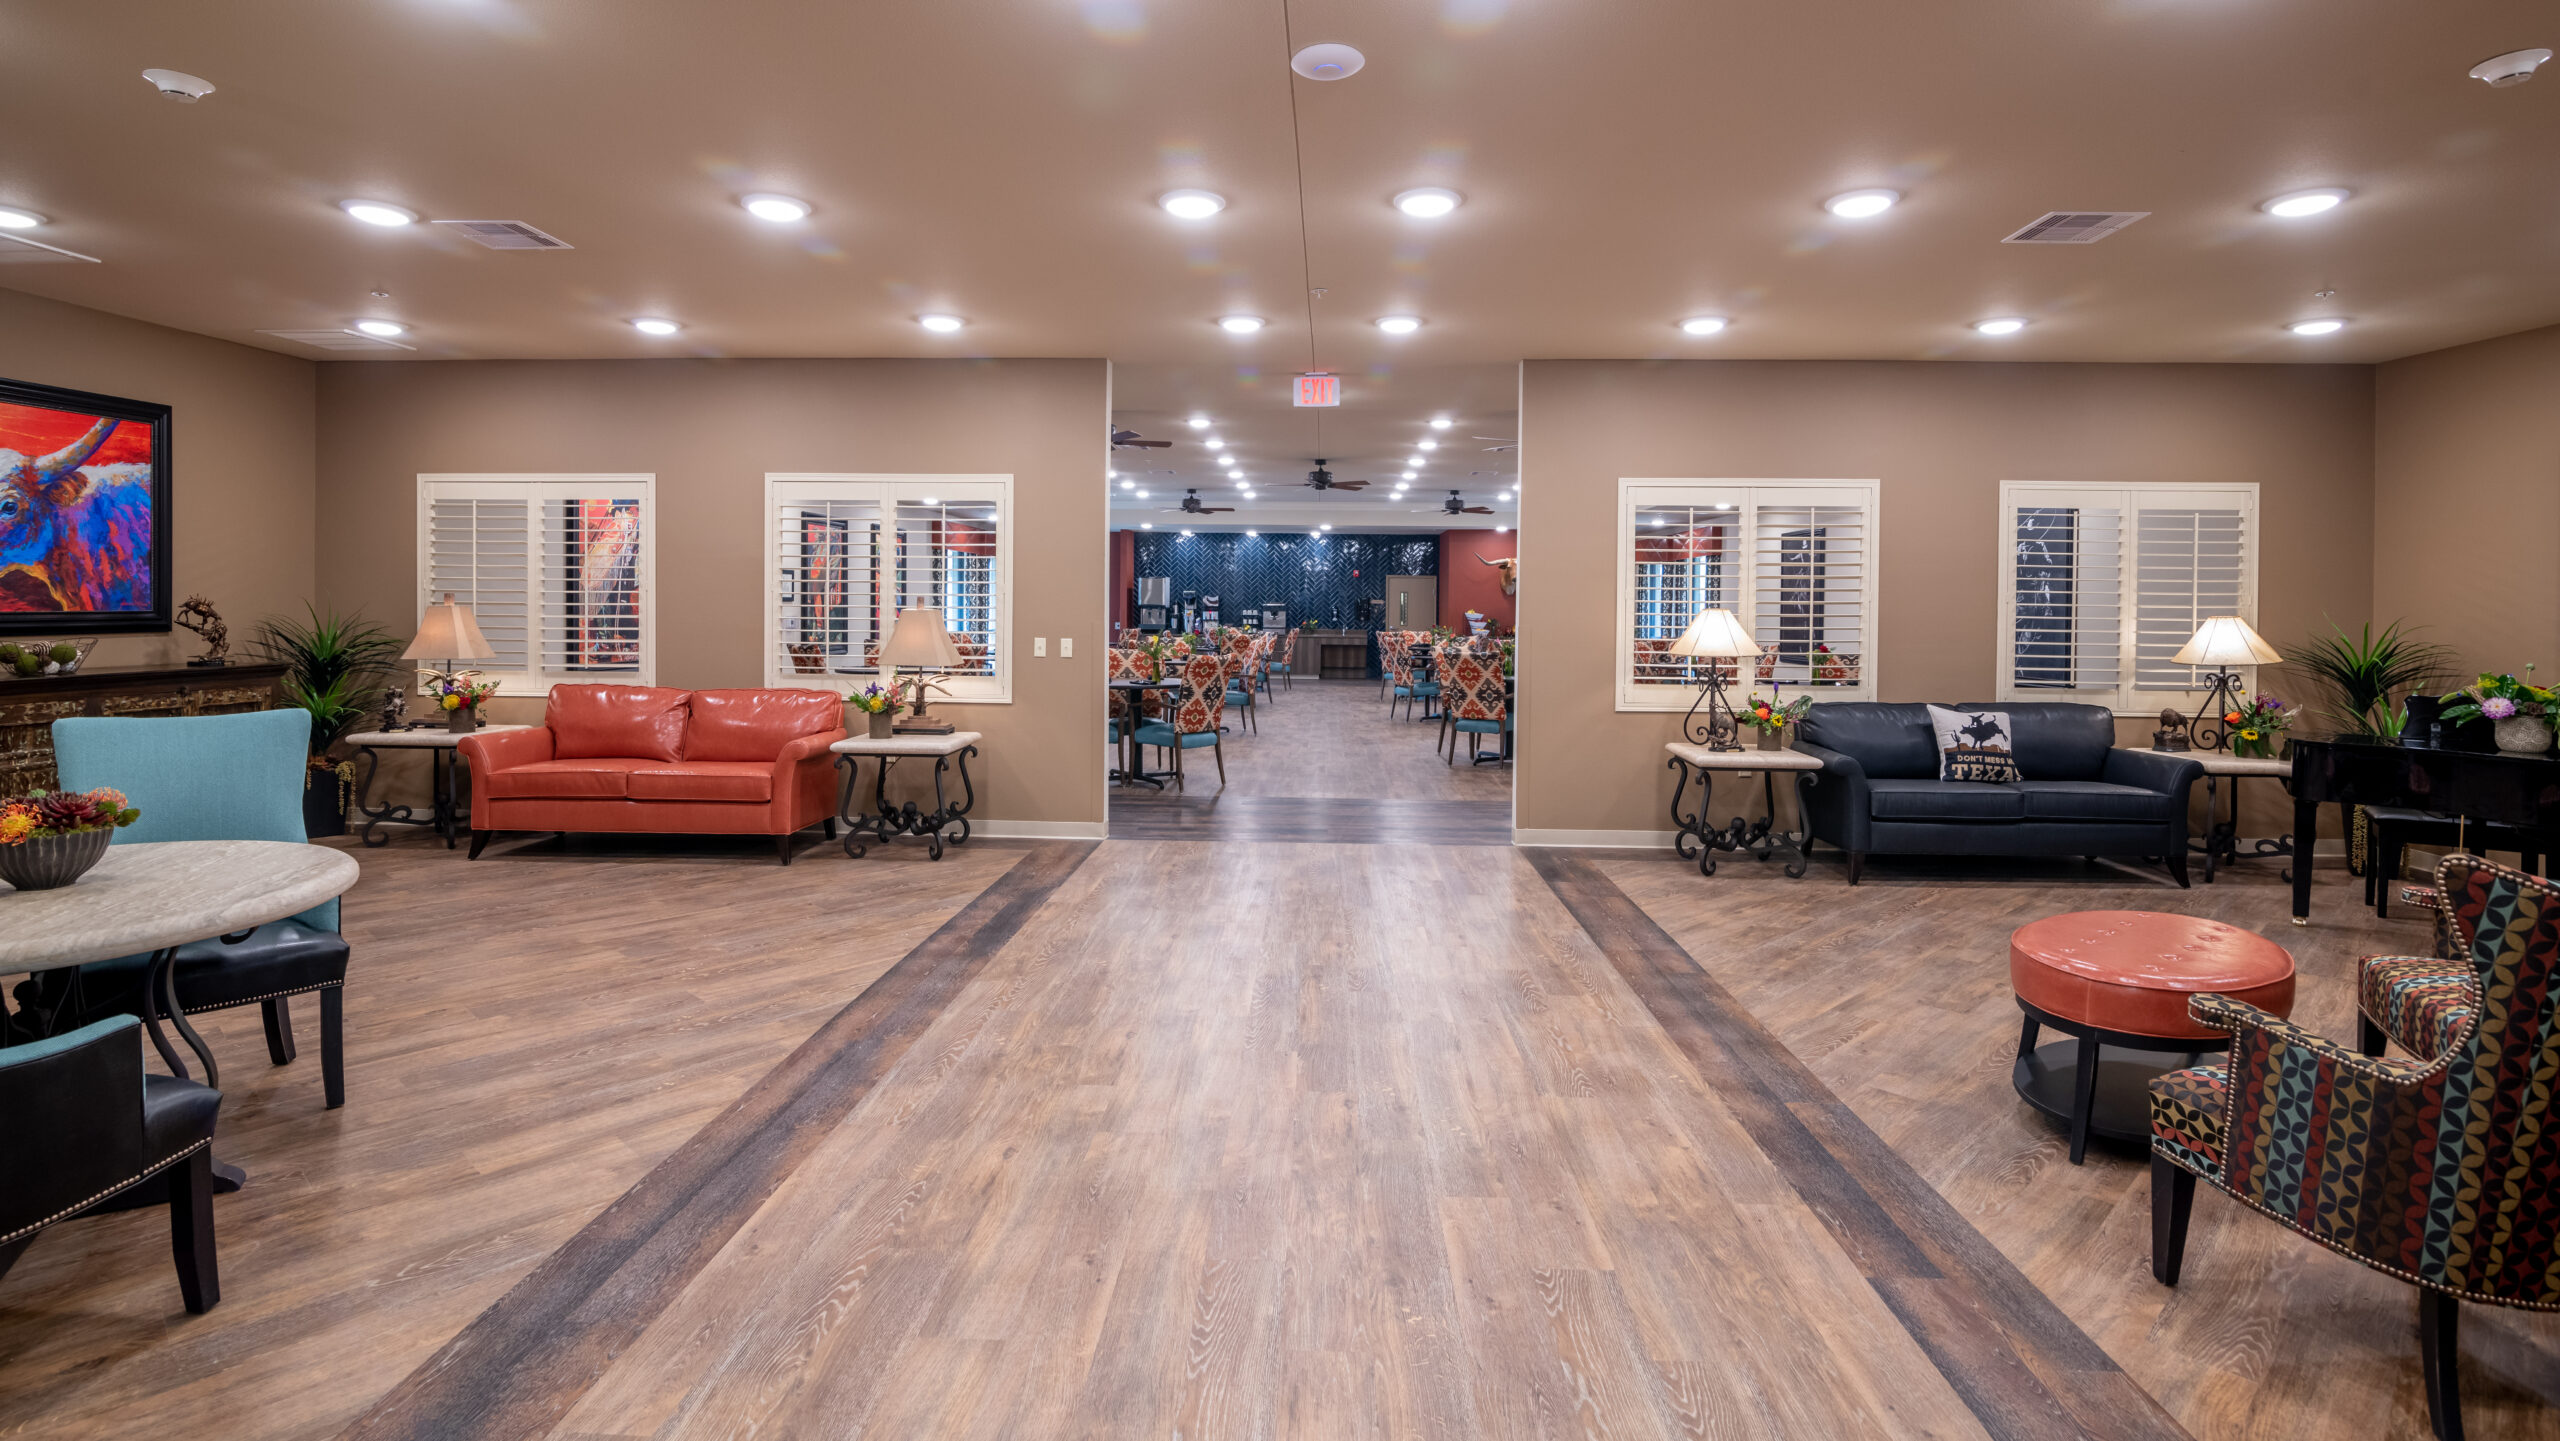
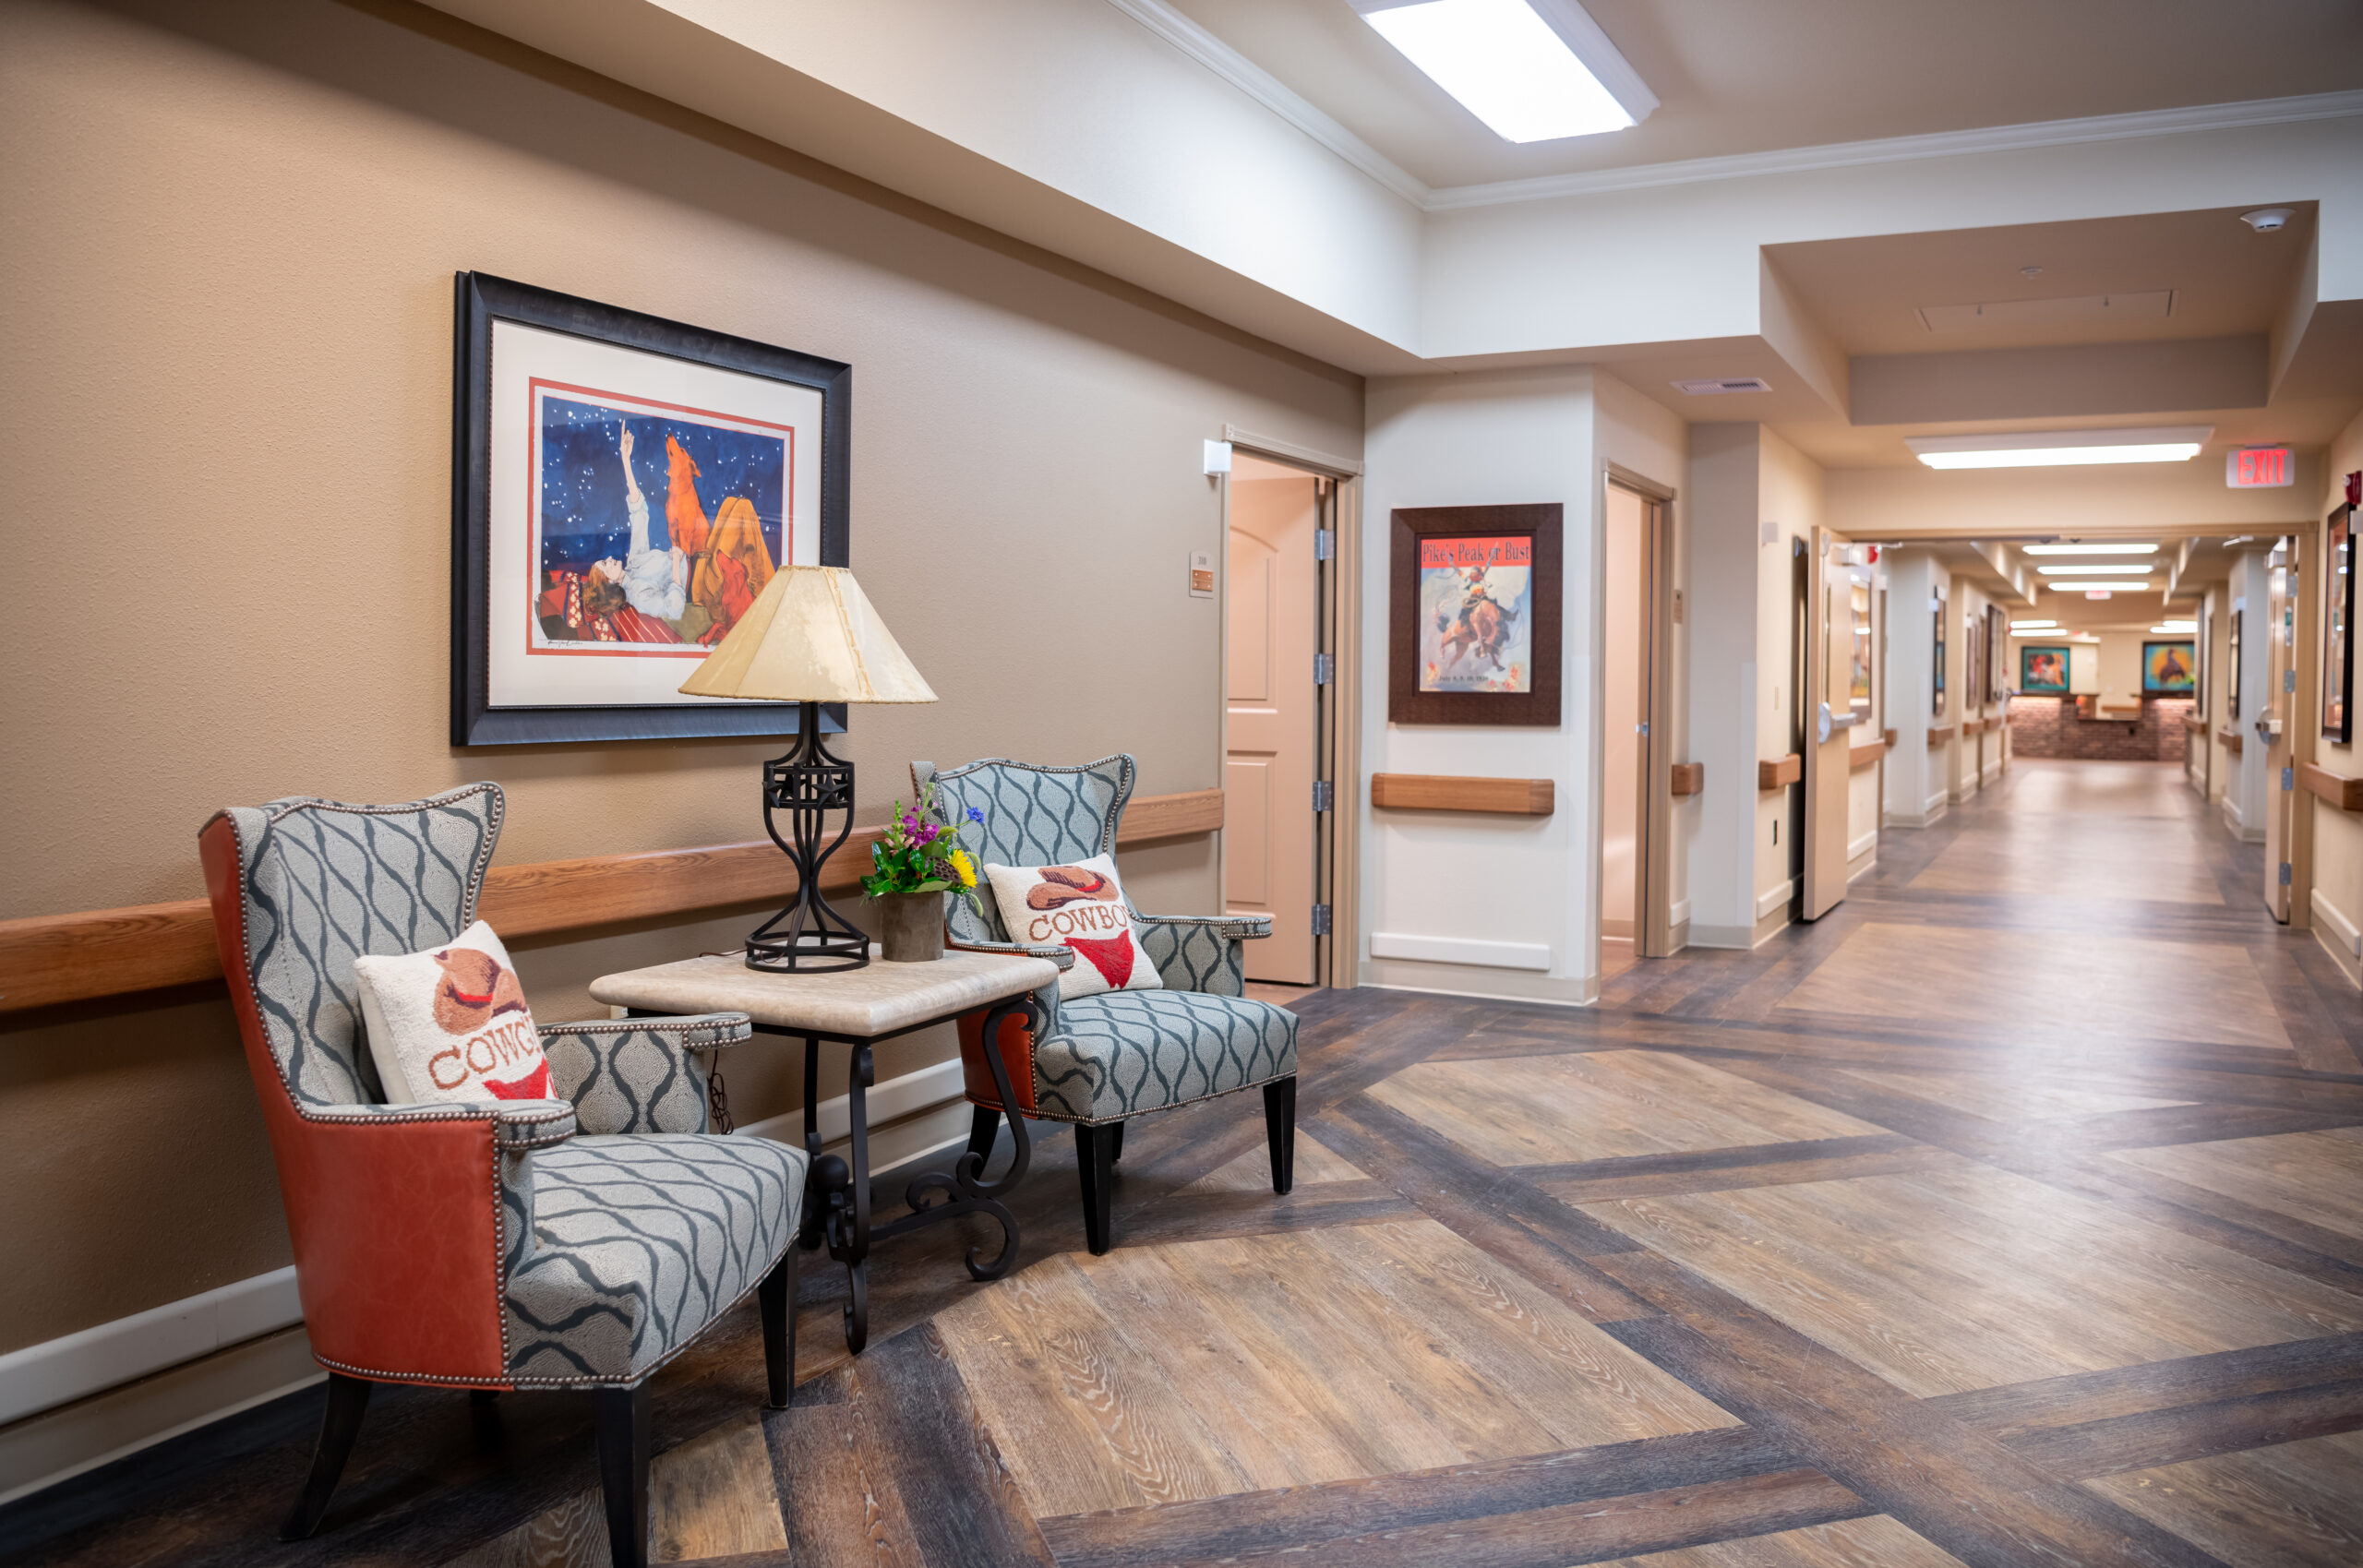
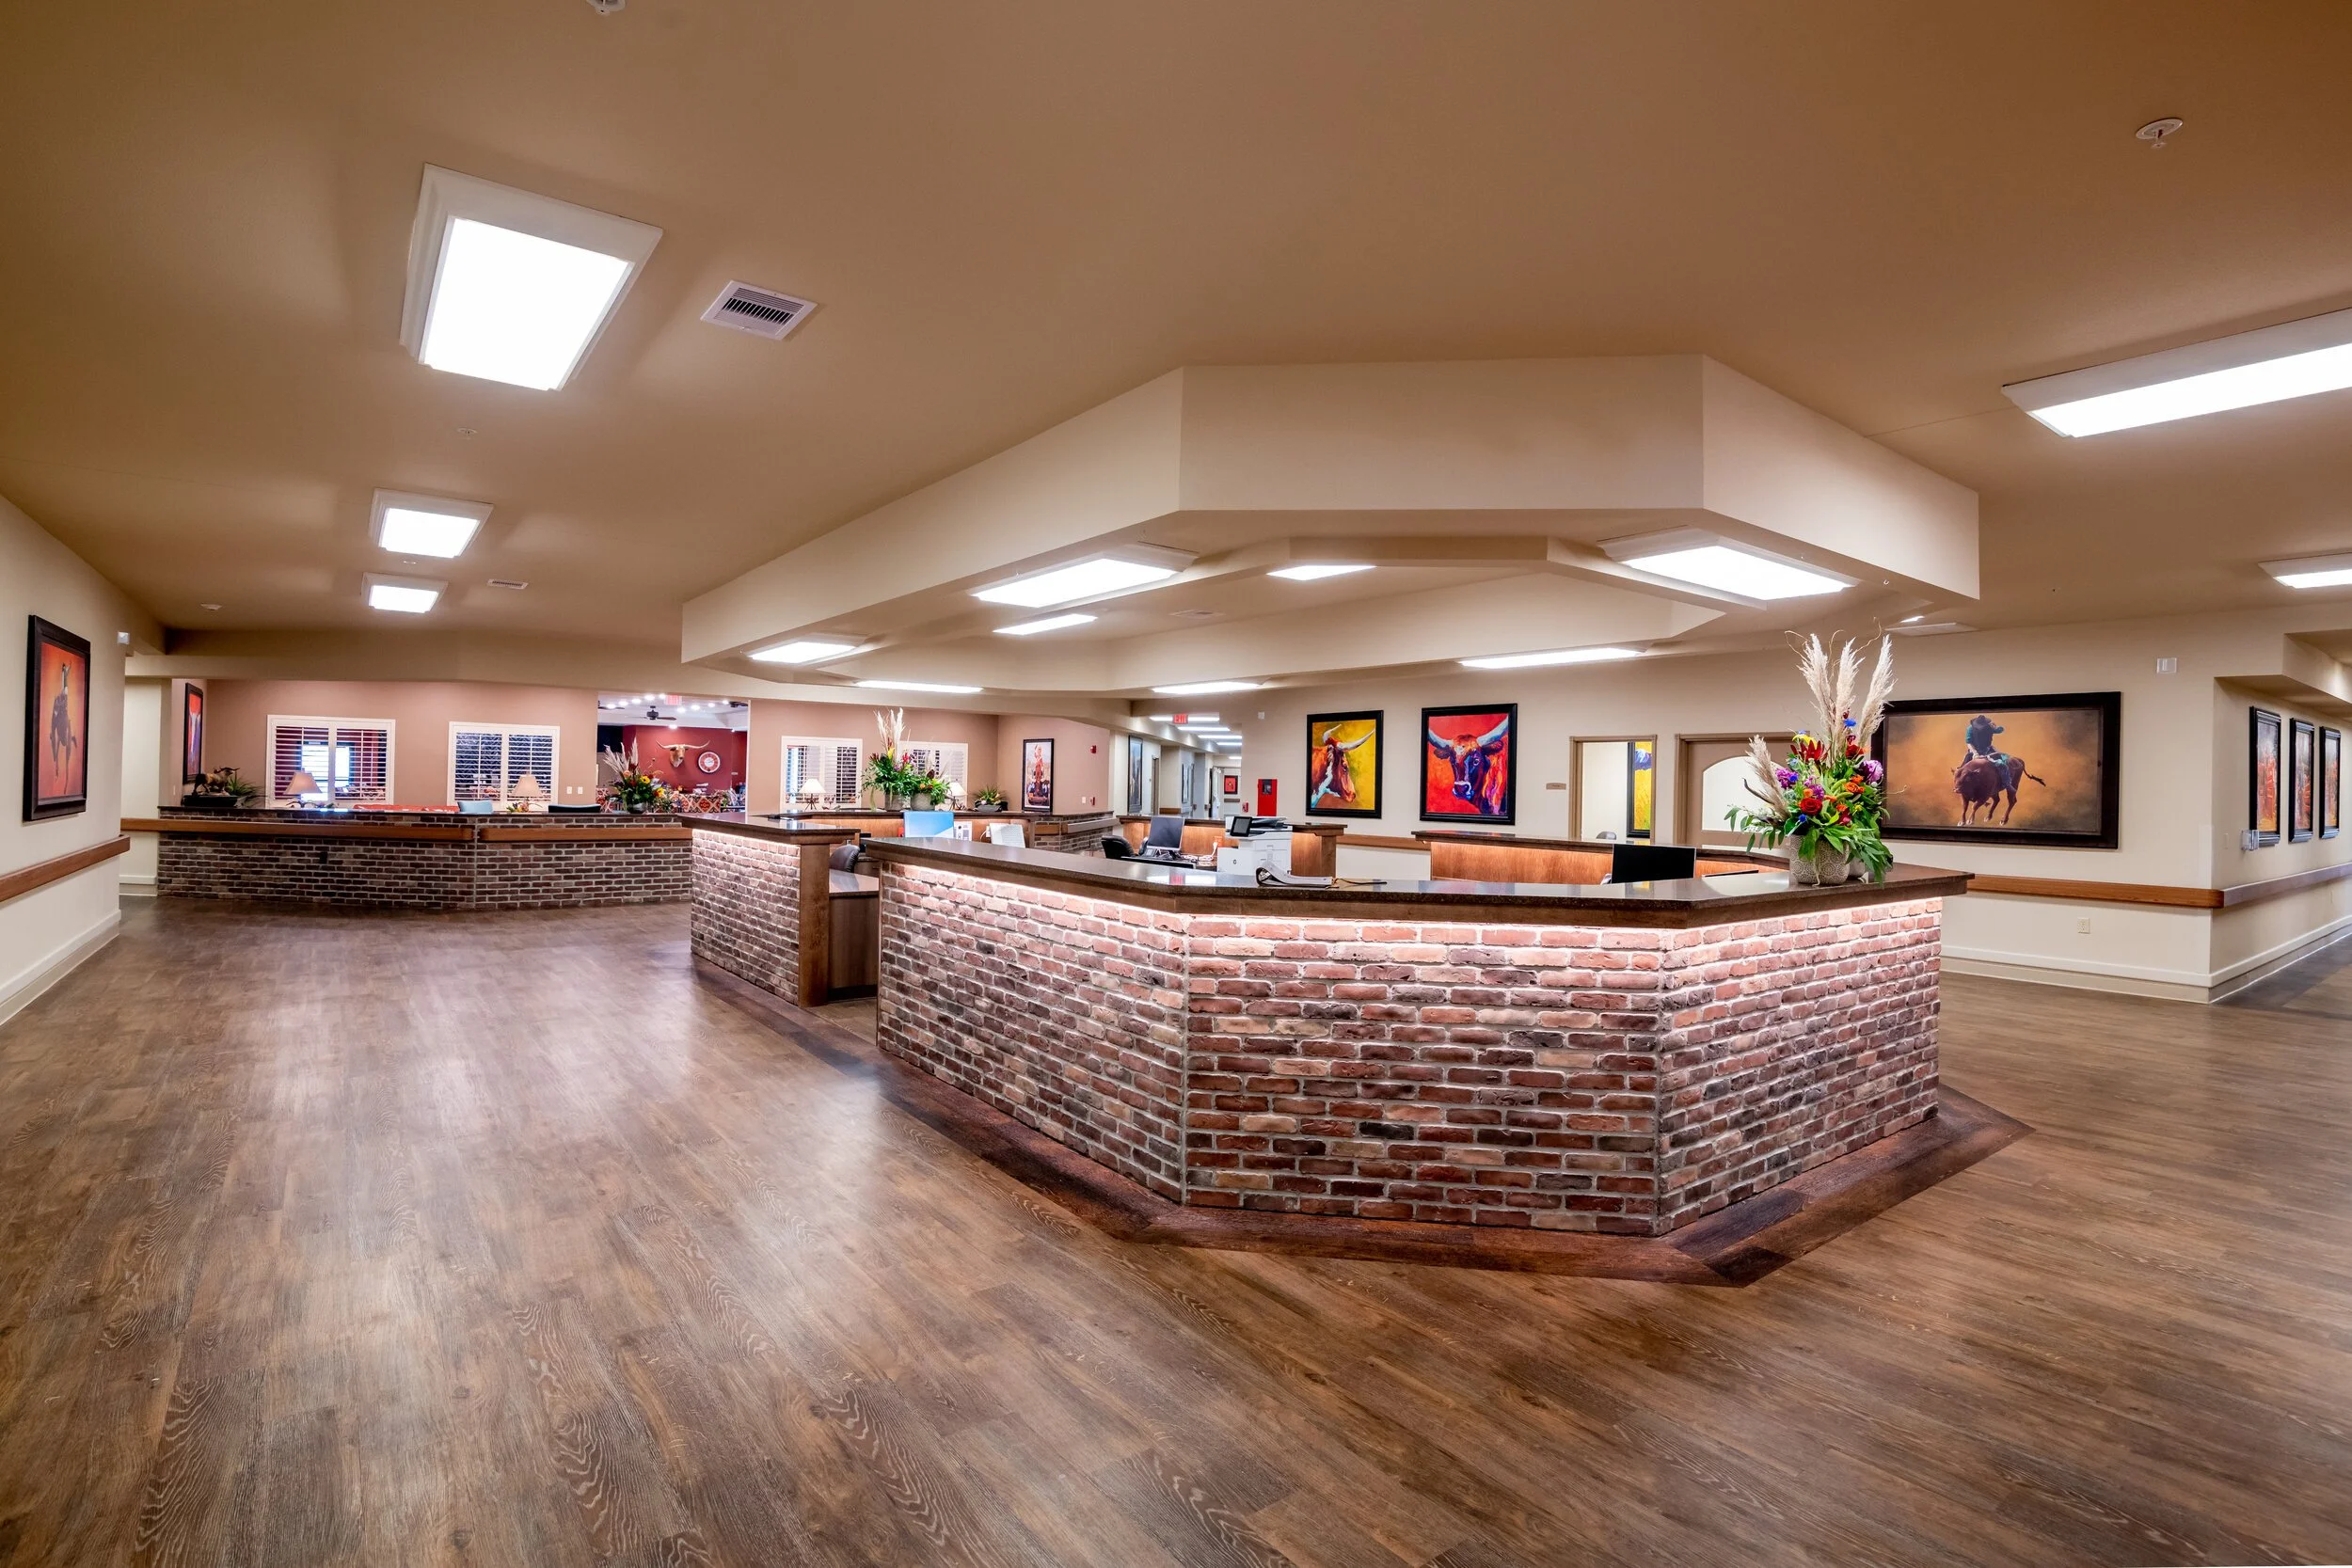
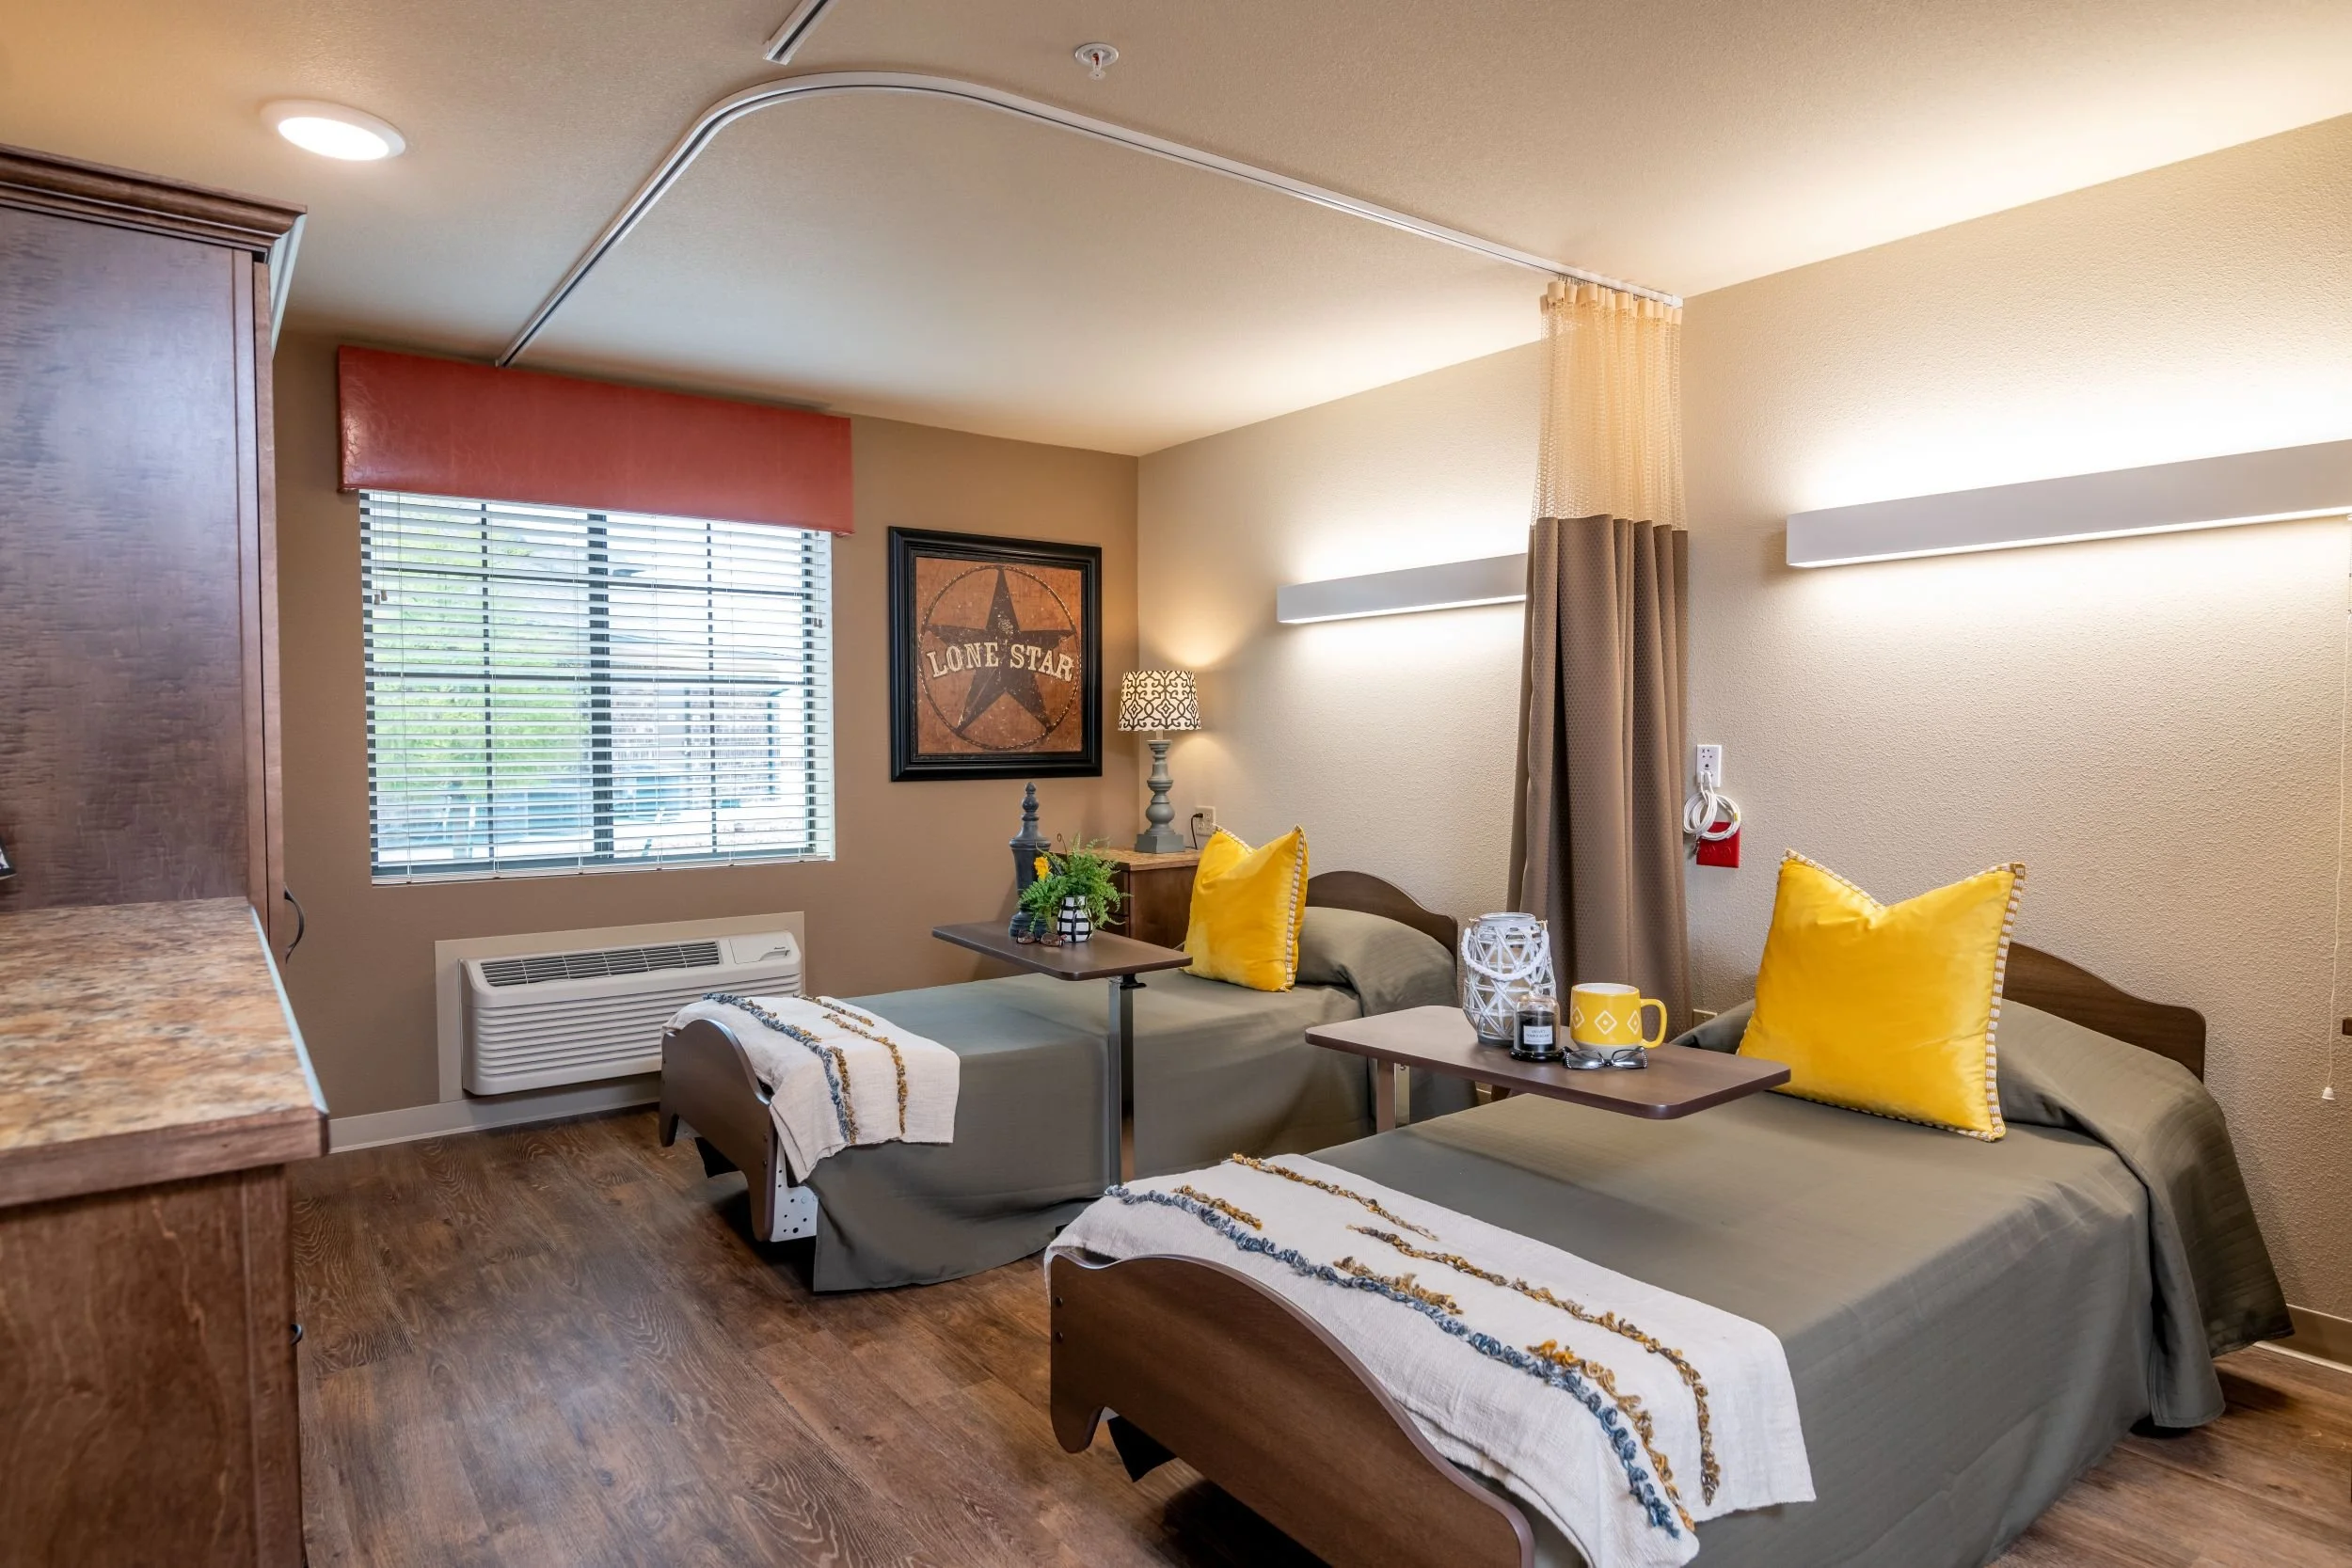
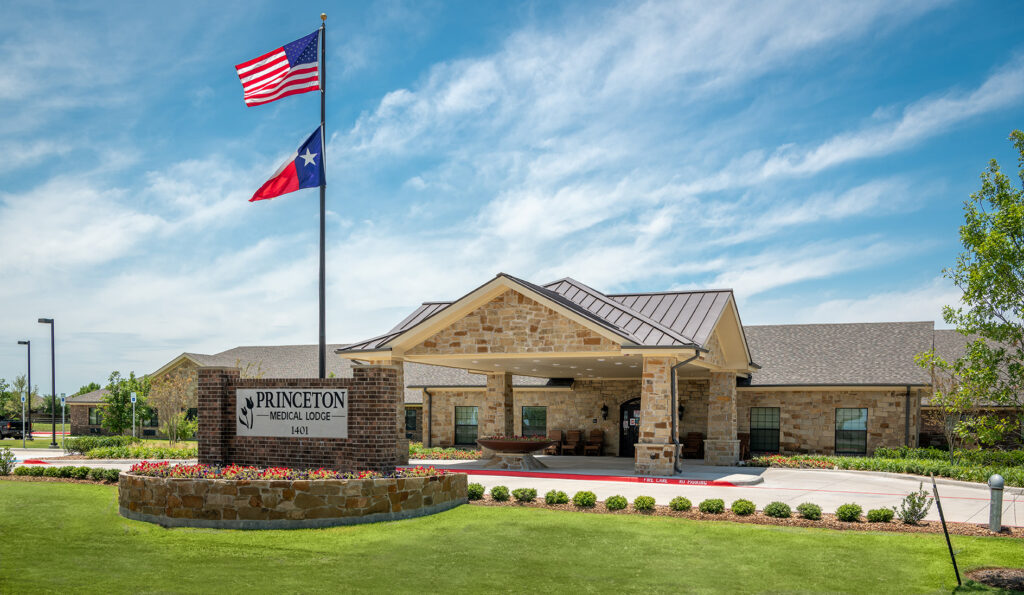
Ideally situated in the vibrant neighborhood of Princeton, TX, Princeton Medical Lodge is an outstanding community that offers skilled nursing and rehabilitation. Featuring newly-furnished and sophisticated accommodations, alongside comprehensive care from a respectful and highly trained team available 24/7, residents’ comfort and safety are guaranteed. The community also promotes a nurturing and welcoming environment for residents to feel a sense of belonging while they recover or as they spend their later years within its spaces.

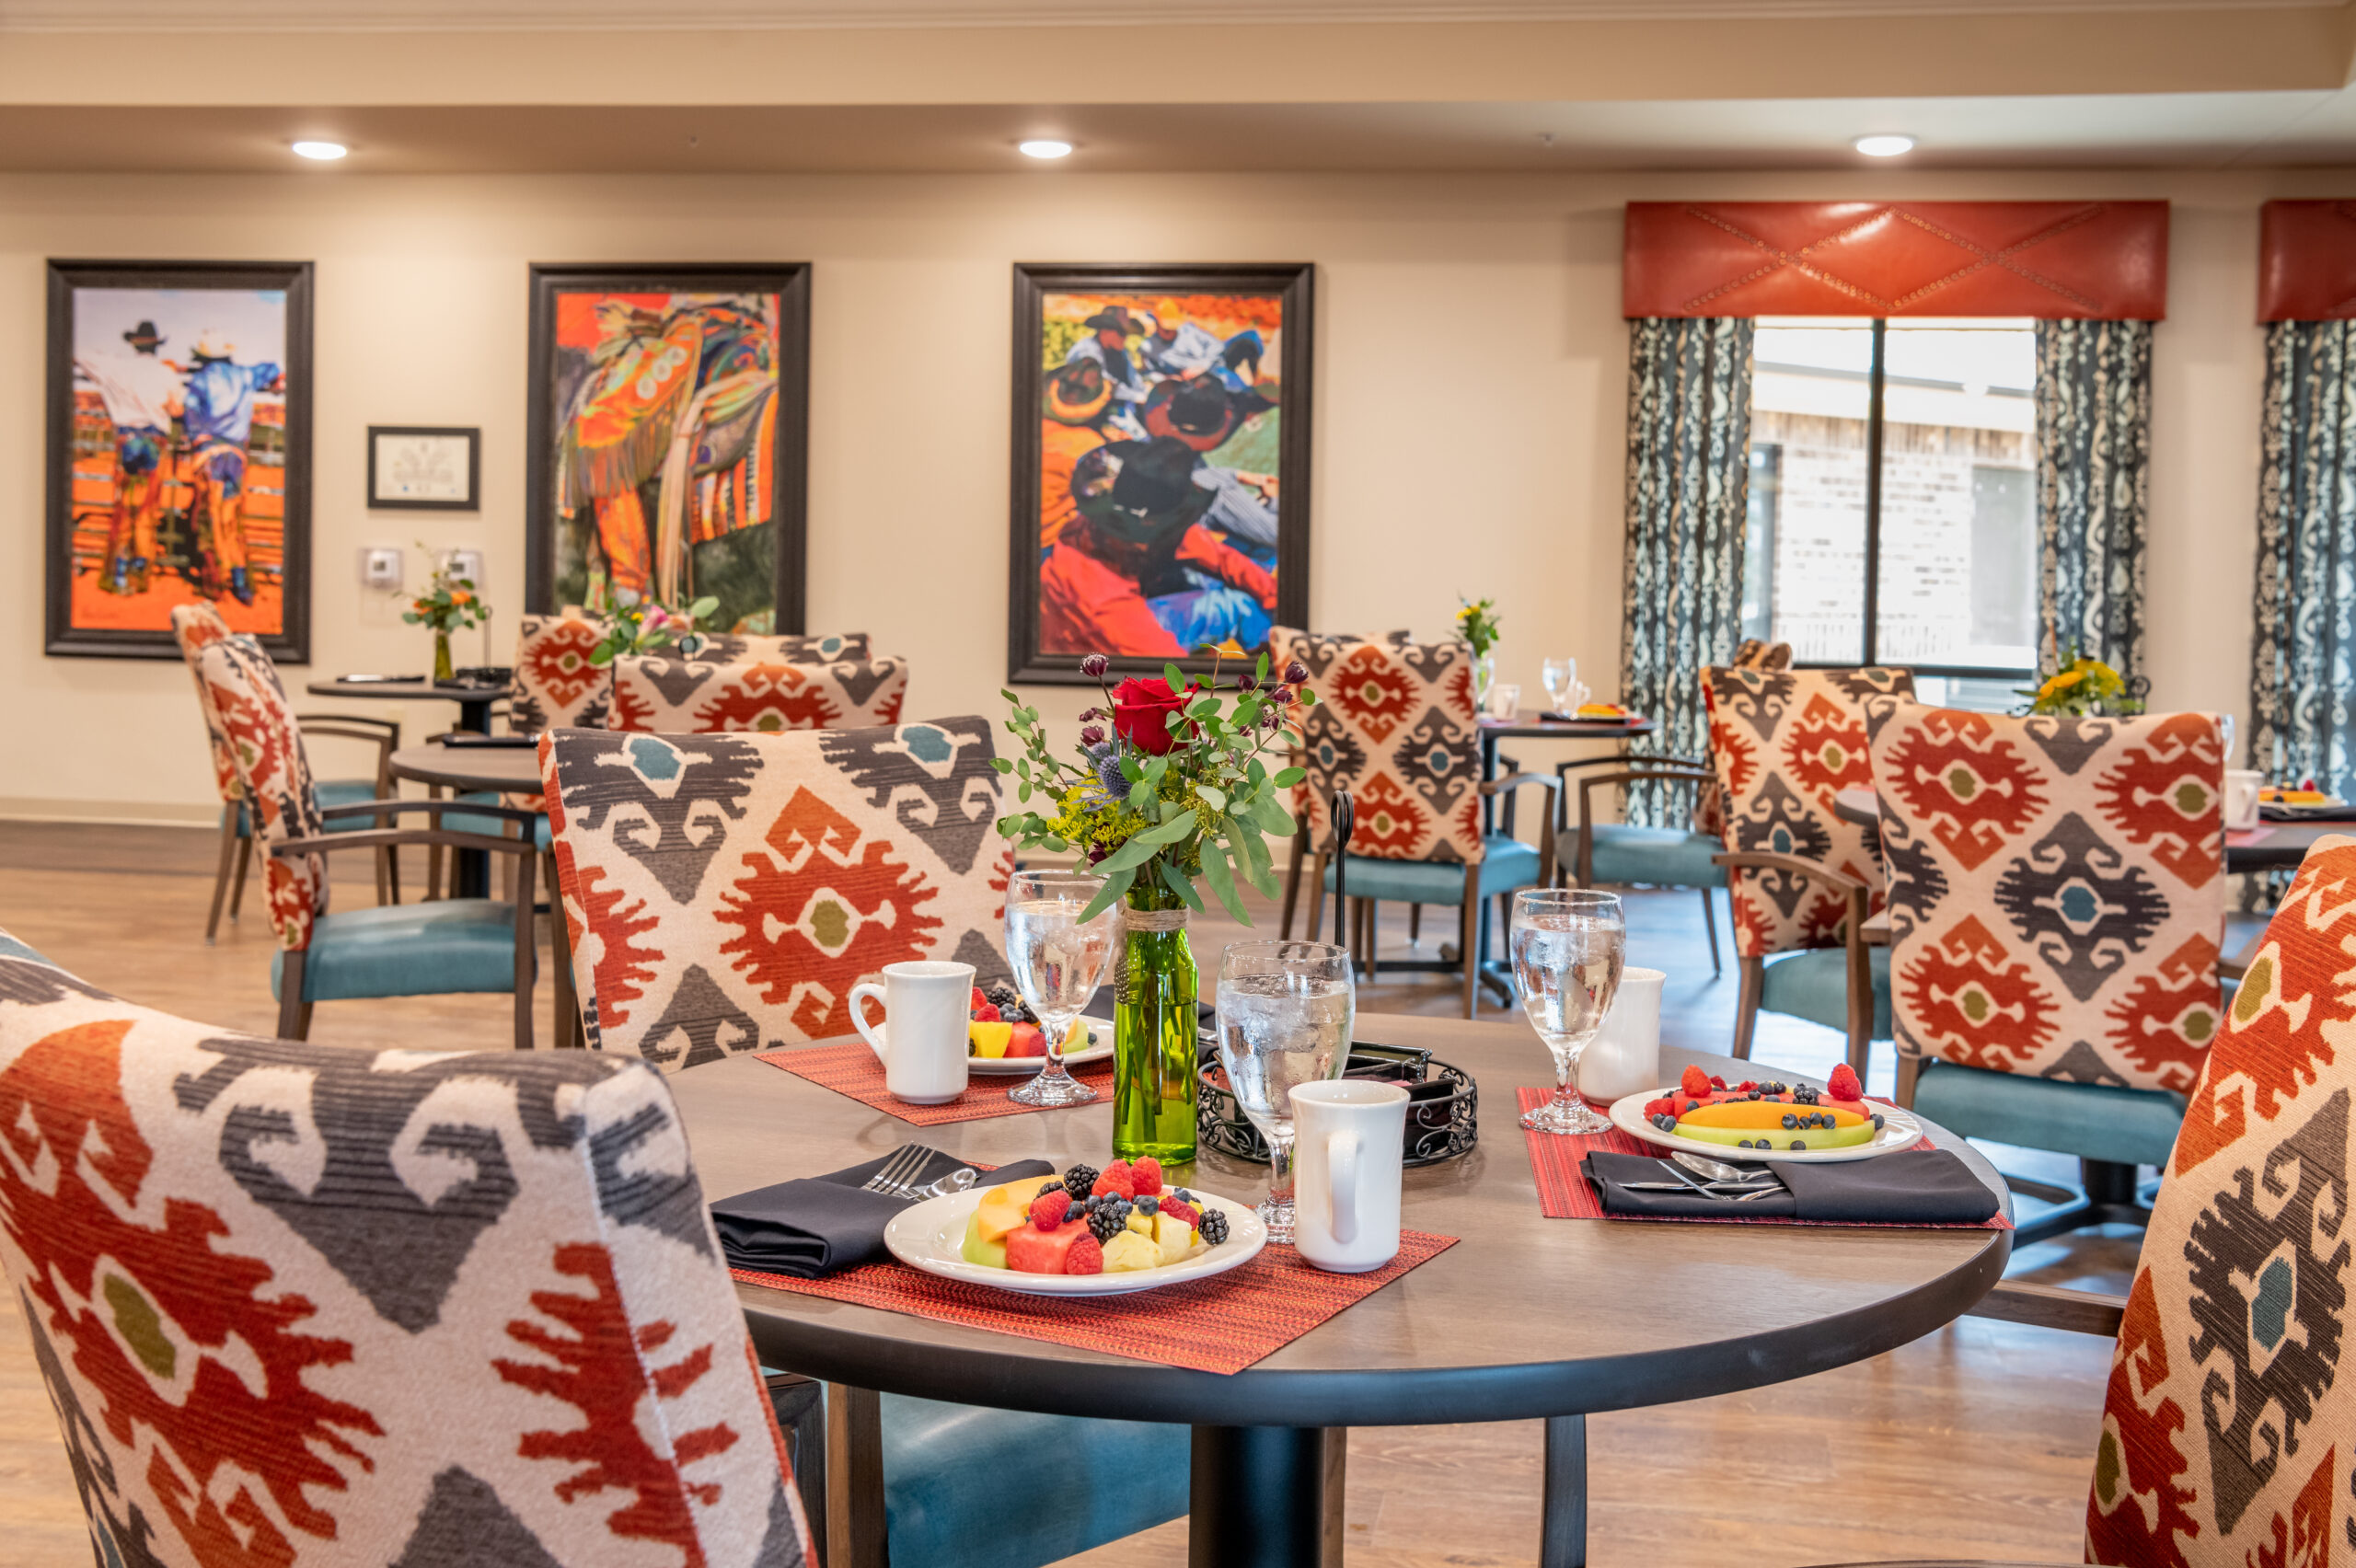
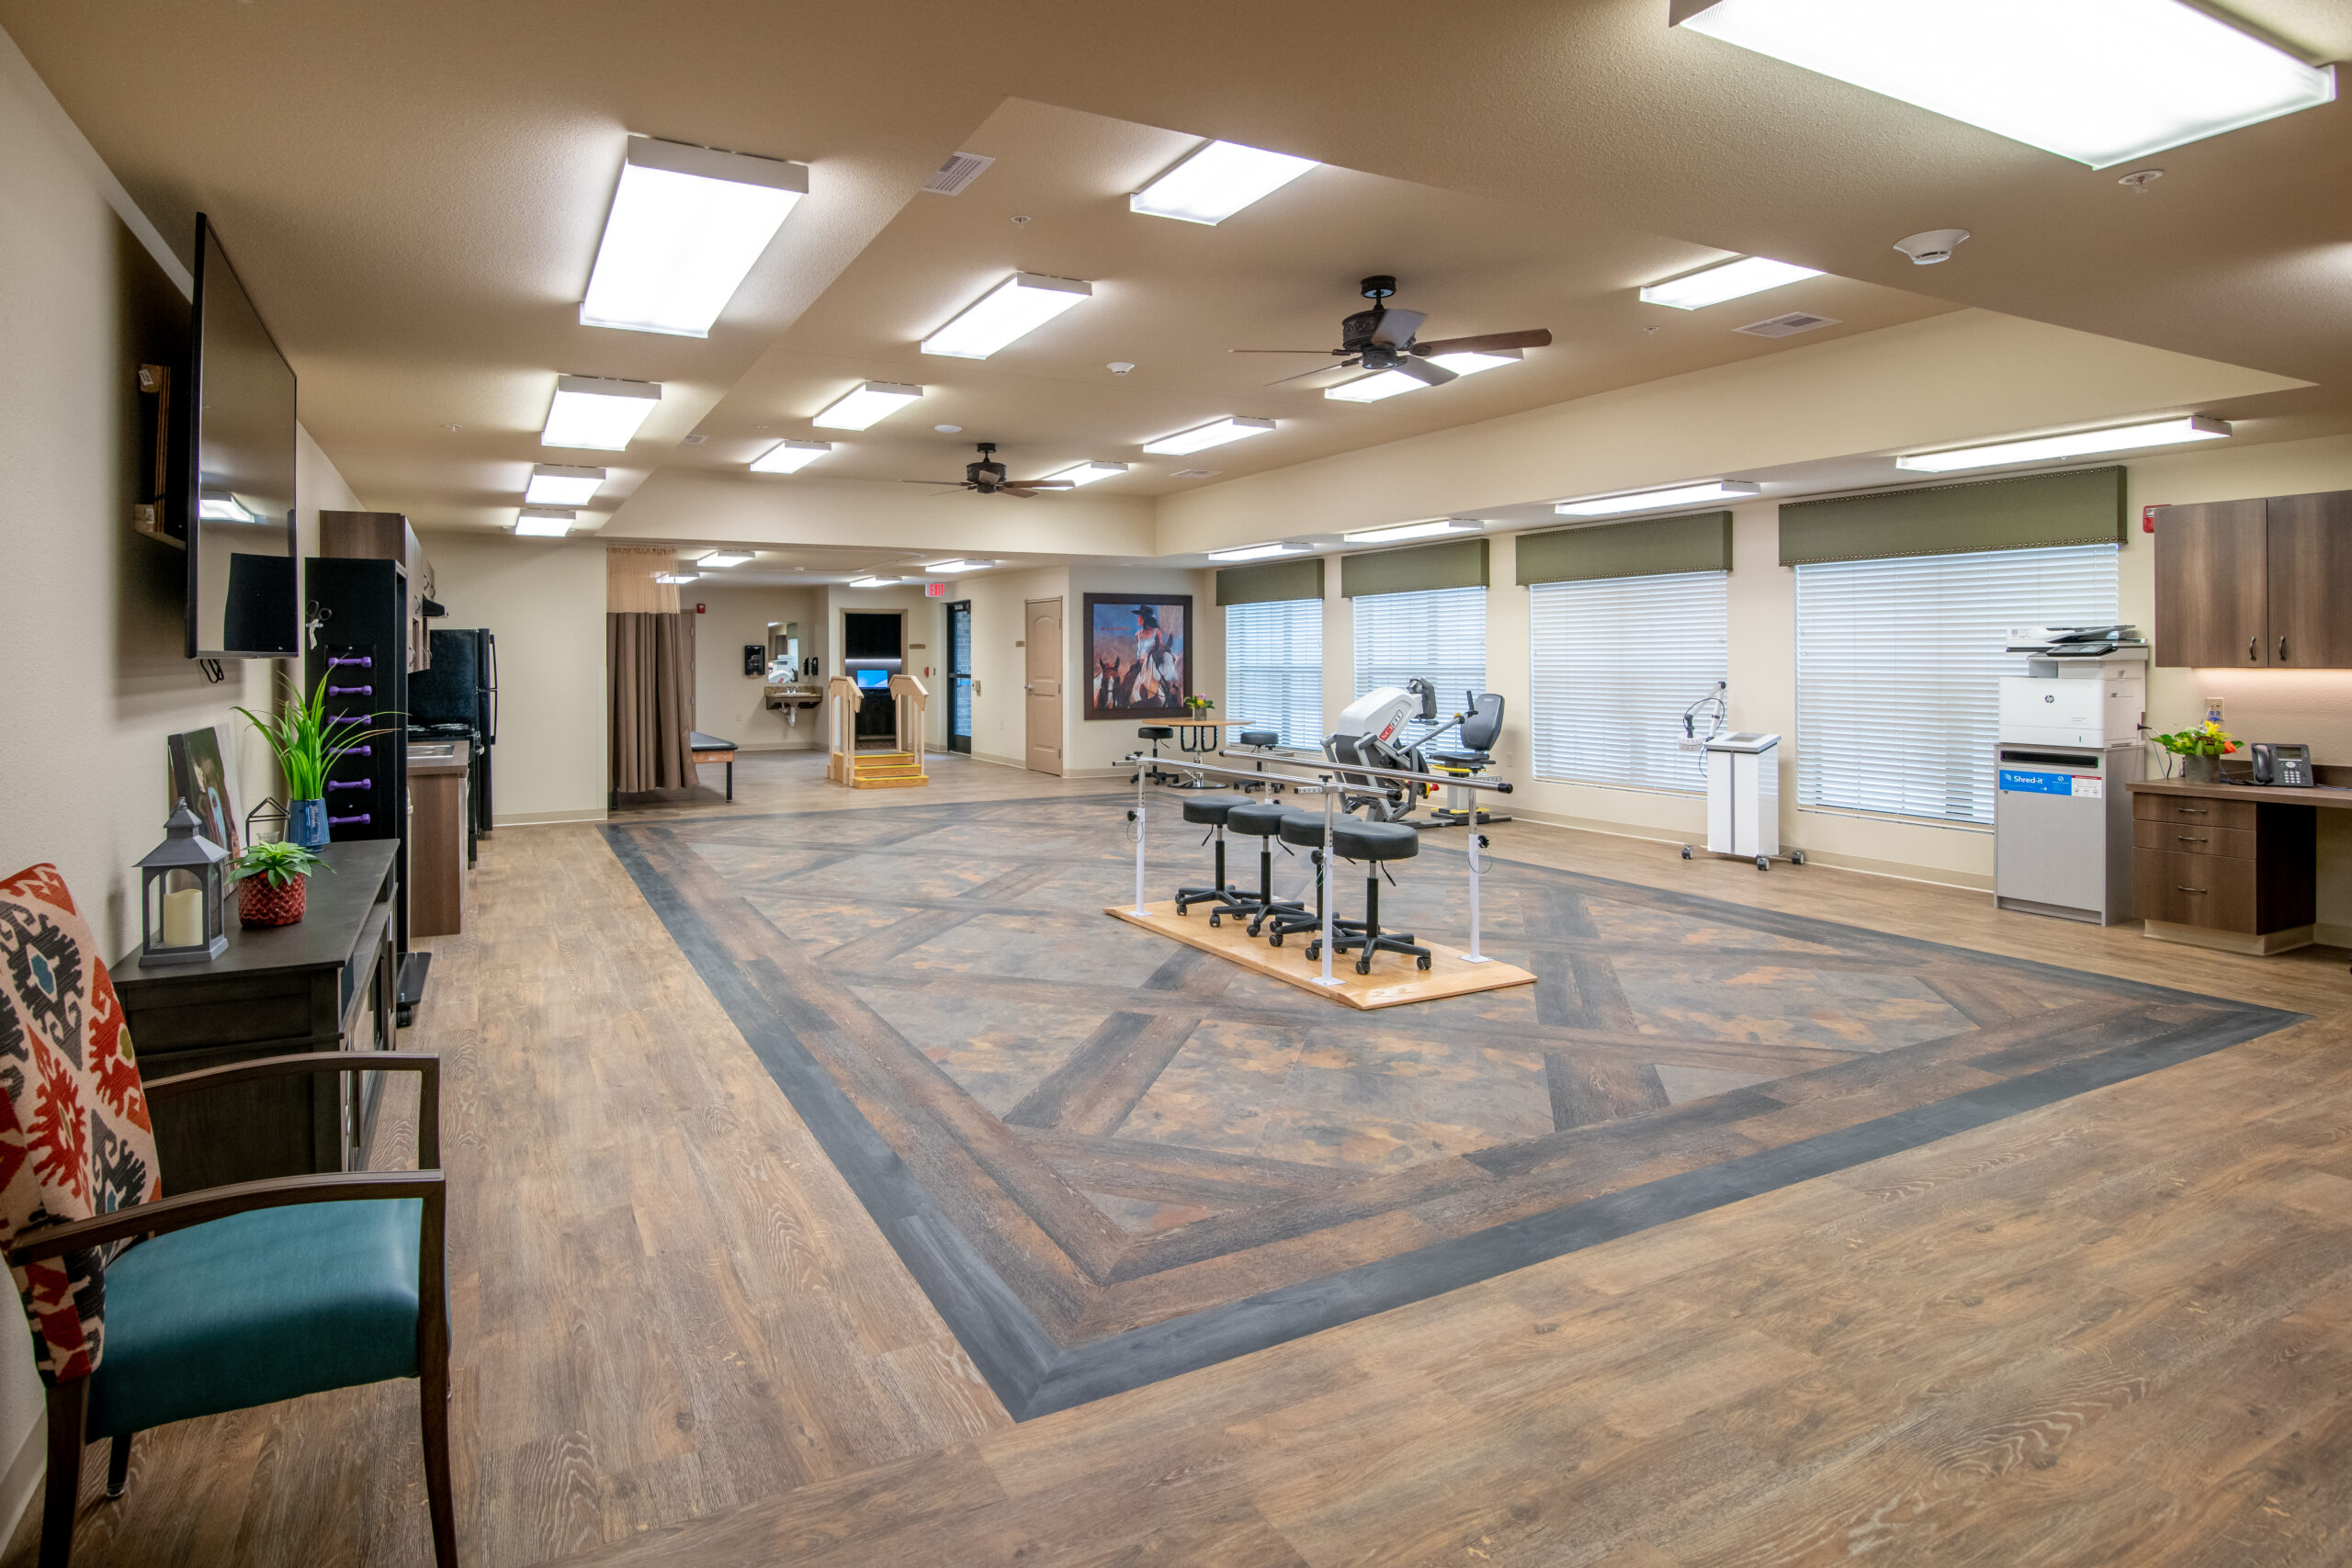
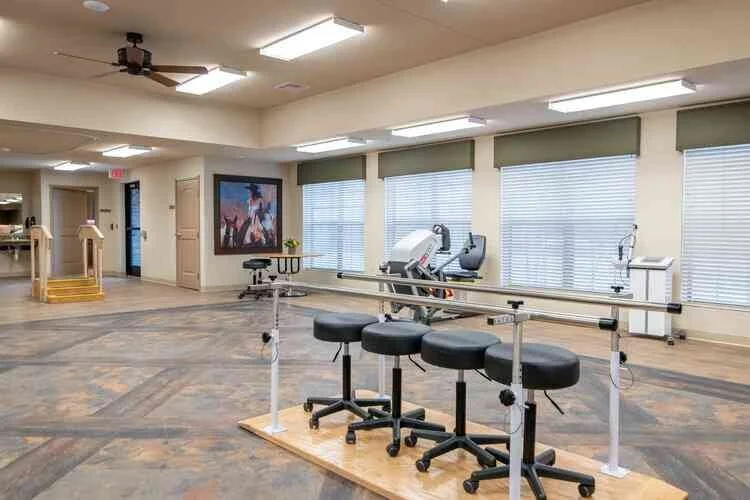
Enriching activities and engaging programs are also conducted for residents to remain active and meet new friends. Delightful dining options are also served to meet residents’ dietary needs and preferences. With the Rapid Recovery Rehab Program, residents undergo intense care to help them recover as soon as they can. Here, residents can rest assured of receiving the highest quality of care to live their golden years without worries.

Quality ratings

Measured by Centers for Medicare & Medicaid Services (CMS)

Overall rating Info Official CMS rating based on health inspections, staffing and quality measures.
4/5
Texas average: 3.0/5
Health Inspection Info Official CMS rating based on deficiencies found during state health inspections.
5/5
Texas average: 2.9/5
Staffing Info Official CMS rating based on nurse staffing hours per resident per day.
1/5
Texas average: 2.4/5
Quality Measures Info Official CMS rating based on clinical outcomes for residents.
3/5
Texas average: 4.0/5

Nursing care per resident

Info Average daily nursing hours per resident (adjusted for acuity). Higher values indicate more nursing time per resident.
2h 27m per day

This home provides 35% less nursing time per resident than the Texas average.

Texas average: 3h 46m per day

Staffing hours breakdown

Info Hours of care per resident per day, broken down by staff type. Data from CMS Medicare.
Staff type Facility State avg National avg
Registered Nurse (RN) Info Registered nurse hours per resident per day. 18m per day 21m per day 29m per day

Capacity and availability

Medium-capacity home

Offers a balance of services and community atmosphere.

Total beds 138

This home usually has limited availability

Occupancy is moderate, suggesting balanced demand.

Similar demand to the Texas average
Occupancy rate 88.3%
Residents per day (avg) 119
Occupancy rate
88.3%
Residents per day (avg)
119

Who this home usually serves

TYPE OF STAY

Mix of rehab and long-term care

This home supports both short-term rehab and long-term care, with residents staying for a wide range of durations.

Breakdown by payment type

Medicare

35% of new residents, usually for short-term rehab.

Typical stay 2 - 3 months

Private pay

55% of new residents, often for short stays.

Typical stay 1 - 2 months

Medicaid

11% of new residents, often for long-term daily care.

Typical stay 3 years

Finances and operations

Privately-owned community
Operated by a business corporation.
Home revenue
$25.4M
Profit
$1.5M
Privately-owned community Operated by a business corporation.
Home revenue
$25,393,354.00
Profit
$1,518,681.00
Payroll costs Info The portion of the home's budget spent on staff, including nurses, caregivers, and other employees who support care and operations.
$5.9M
23.2% of revenue
Other operating costs Info All remaining costs needed to run the home, such as food, utilities, building maintenance, supplies and administrative expenses.
$18.0M
Total costs $23.9M
Bed community size
138-bed community
A larger shared setting that may offer more common spaces and organized community services.
Years in operation
5 years in operation
An established community with some operational experience and growing routines.
Walk Score
Walk Score: 24 / 100
Car-dependent. Most errands require a car, with limited nearby walkable options.

Services

Medicare/medicaid

About this community

Occupancy

Occupancy rate
88%
In line with Texas average
Occupied beds
122 / 138
Average residents 75 per day

License details

Facility type
Nursing
Status Active
Issuance January 1, 2024
Expiration January 1, 2027
County: COLLIN

Additional licensing details

License number: 311739
Year opened: 4/14/2020
CMS Certification Number: 676485

Ownership & operating entity

Princeton Medical Lodge is administrated by JORDAN MOON.

Management company: FOURSQUARE TEXAS 16, LLC
Owner: NOCONA HOSPITAL DISTRICT
Ownership type: HOSPITAL DISTRICT/AUTHORITY

Type Of Units

Medicare
18 units
Medicaid and Medicare
120 units
Total beds
138 units

Staffing

Key information about the people who lead and staff this community.

Leadership

Contact: Brett Moon, Administrator
Administrator email: [email protected]

Care Services

Nursing Services
Rehabilitation Services
Respite Care
Skilled Nursing
Licensed Nurses/CNAs
Short-Term Rehab

All Levels of Care

Long Term Care
Short Term Care
Palliative Care
Respite Care

Programs & Activities

Specific Programs
Long Term Care, Short Term Care, Luxury Senior Care, Respite Care, Palliative Care
Operating Hours
Mo-Su: 24 hours

What does this home offer?

Housing options icon

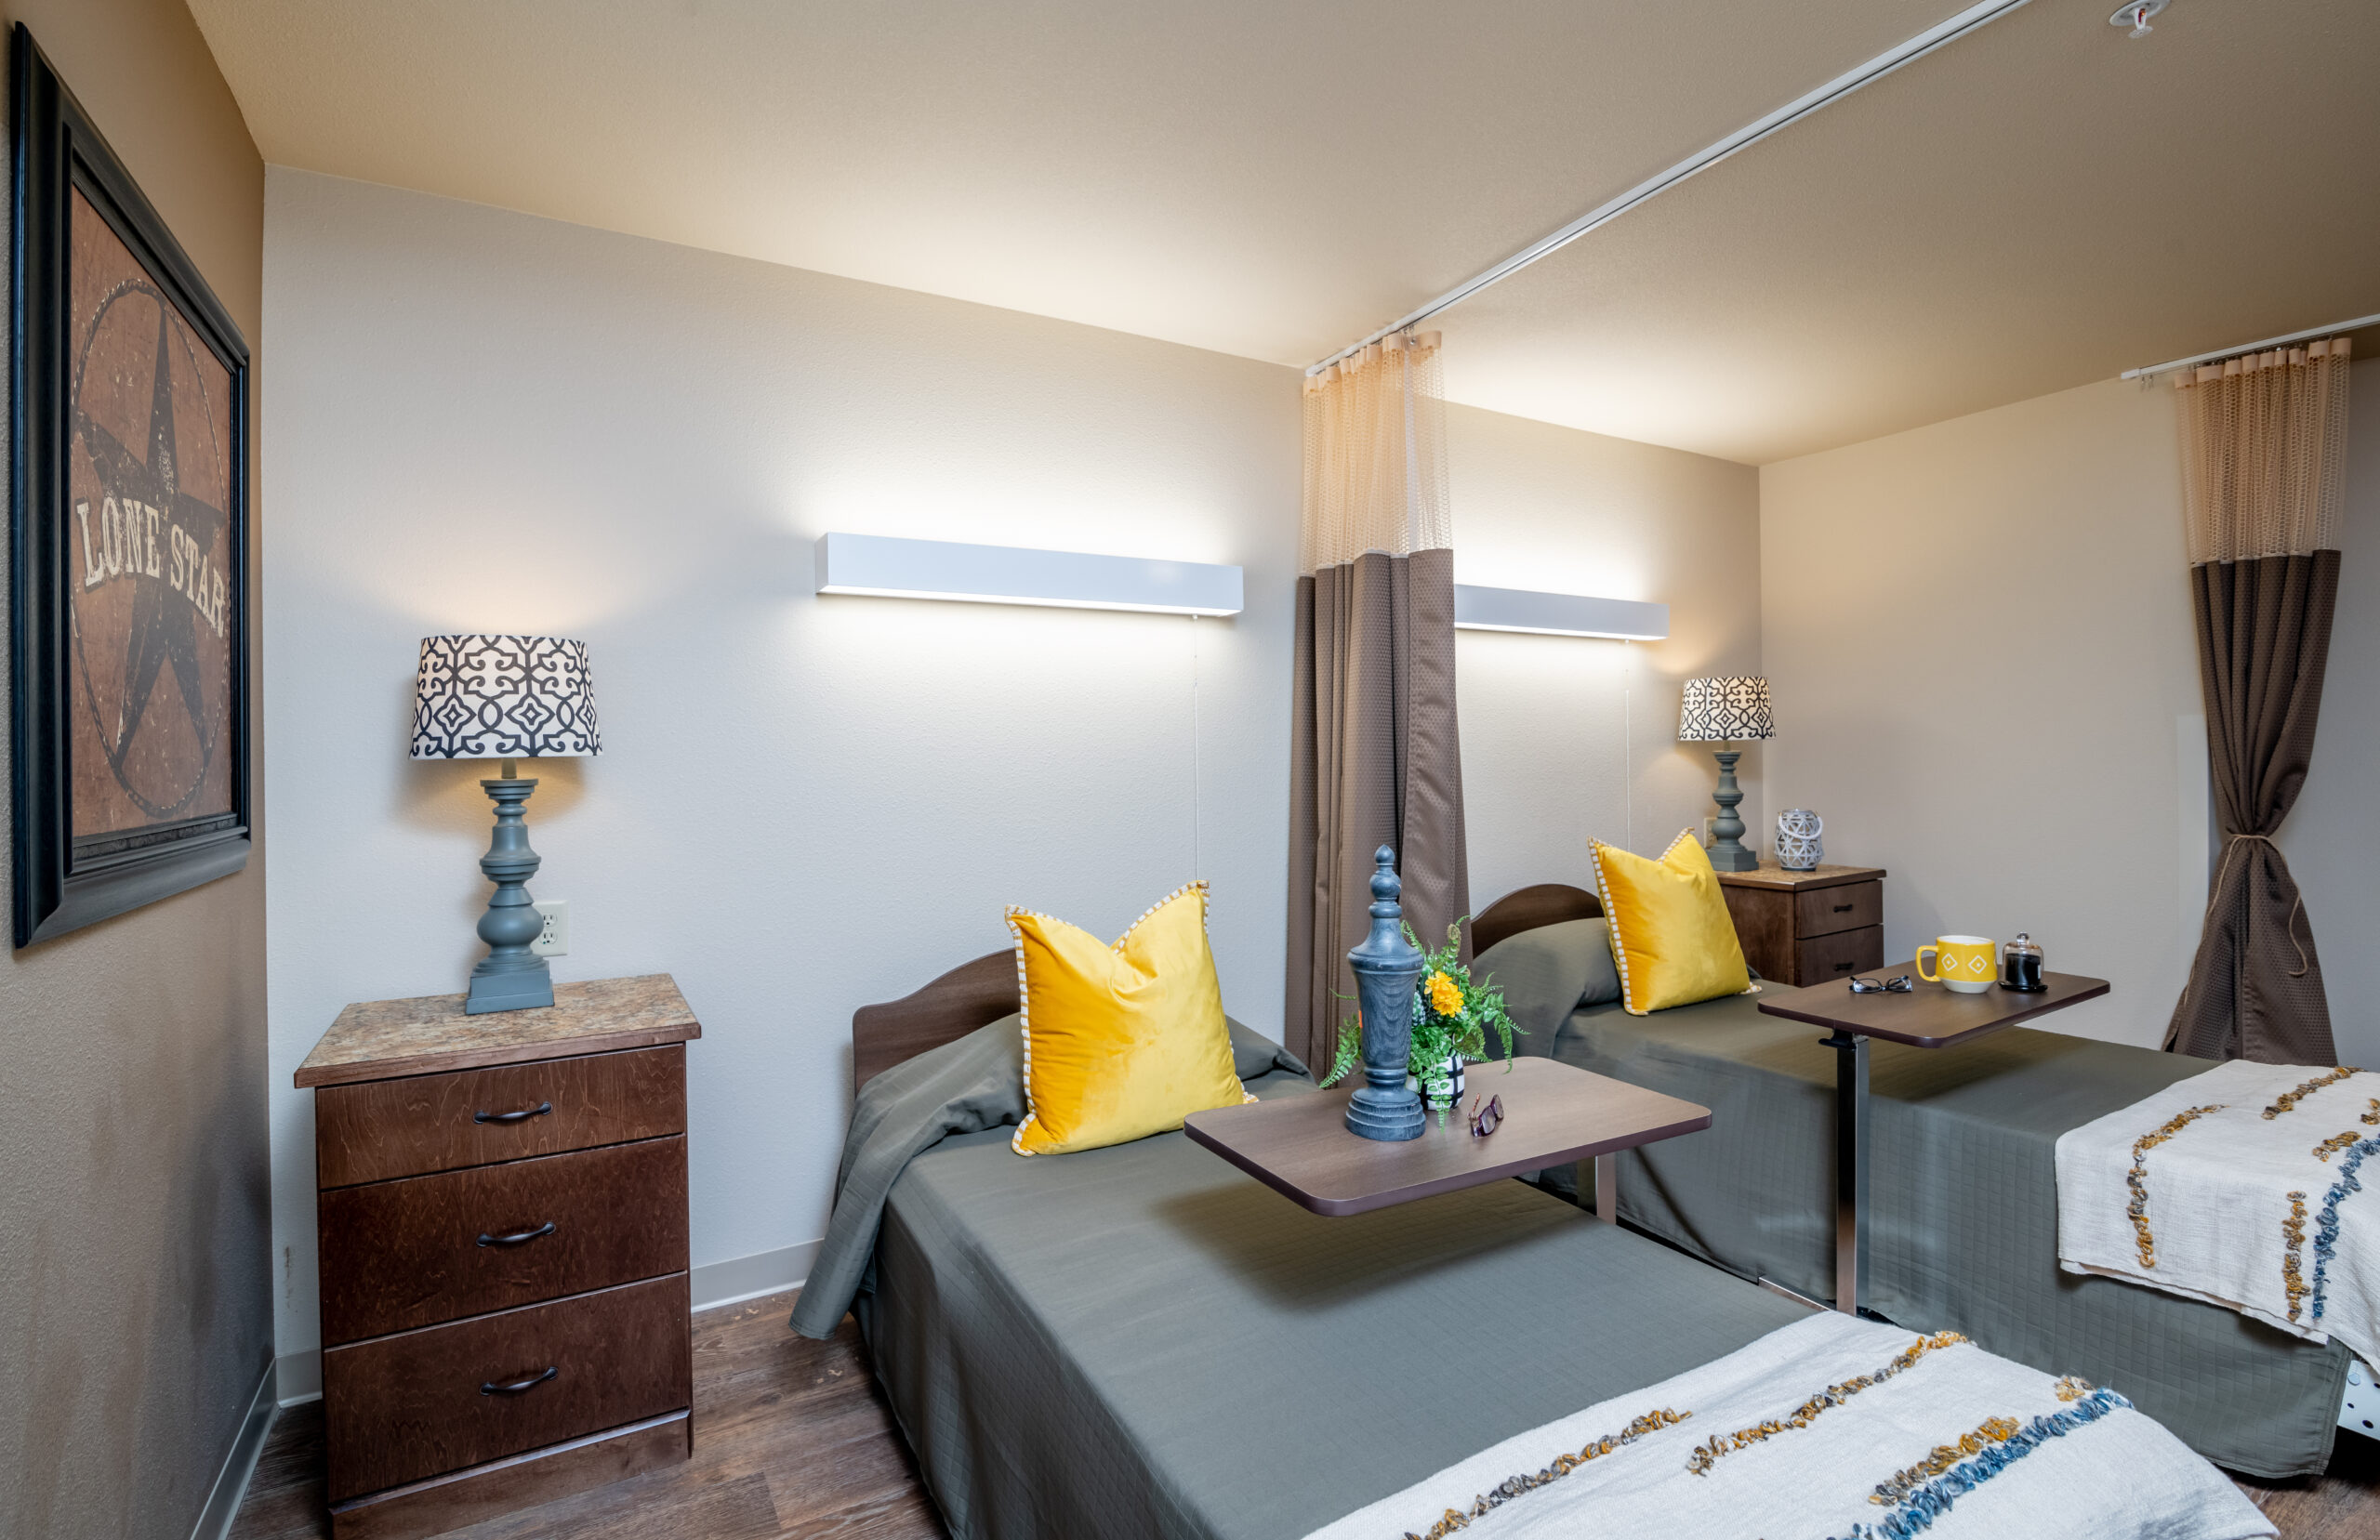
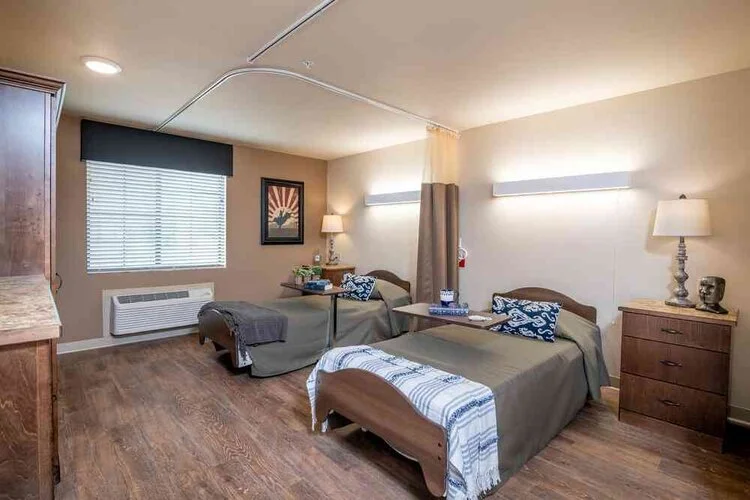
Housing Options: Private Suites

Building type icon
Building type icon

Building Type: Single-story

Dining services icon

Dining Services

Beauty services icon

Beauty Services

Transportation services icon

Transportation Services

Recreational activities icon

Recreational Activities

Exercise program icon

Exercise Programs

Types of Care at Princeton Medical Lodge

Nursing Home Respite Care
Contact Princeton Medical Lodge

Health Inspection History

Inspections
Total health inspections 3

Texas average 7.4


Last Health inspection on Jan 2025

Total health citations 15
Citations per inspection
5

Health citations are formal notices following inspections when they fail to comply with safety and care standards.

12 of 15 citations resulted from standard inspections; and 3 of 15 came from combined inspections (standard and complaint).

Breakdown of citation severity (last 3 years)
Critical Health citations More info 0
100% better than Texas average

Texas average: 2


Serious Health citations More info 0
100% better than Texas average

Texas average: 0.4

0 critical citations More info Texas average: 2

0 serious citations More info Texas average: 0.4

15 moderate citations More info Texas average: 23

0 minor citations More info Texas average: 0.4
Citations history (last 3 years)
Infection Control moderate citation Jan 13, 2025
Corrected

Care Planning moderate citation Jan 13, 2025
Corrected

Care Planning moderate citation Jan 13, 2025
Corrected

Nutrition moderate citation Dec 14, 2023
Corrected

Compare Nursing Homes around Collin County

The information below is reported by the Texas Health and Human Services Commission.
Princeton Medical Lodge
SNF

Nursing Homes 24/7 care needed

RC

Respite Care

Princeton
138
-
24
MOON, JORDAN
88.3%
$24,613,090.00
$5,879,608.00
23.9%
119
4/5
2.4501
5/5
1/5
3/5
-
15
-
-68%
-33%
+39%
Private Suites
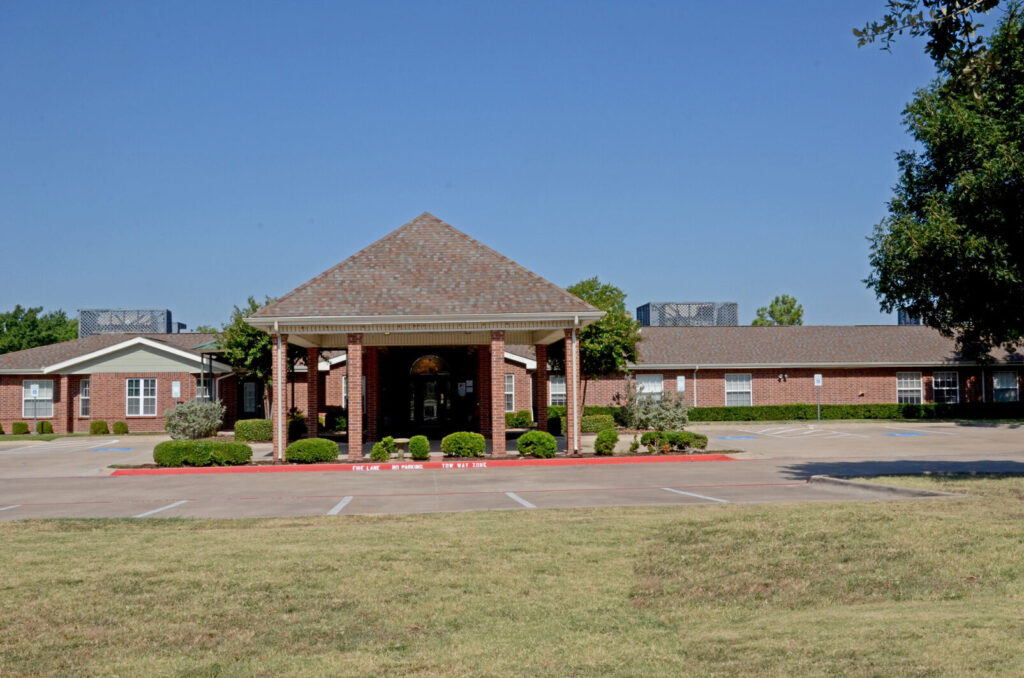
Victoria Gardens of Allen
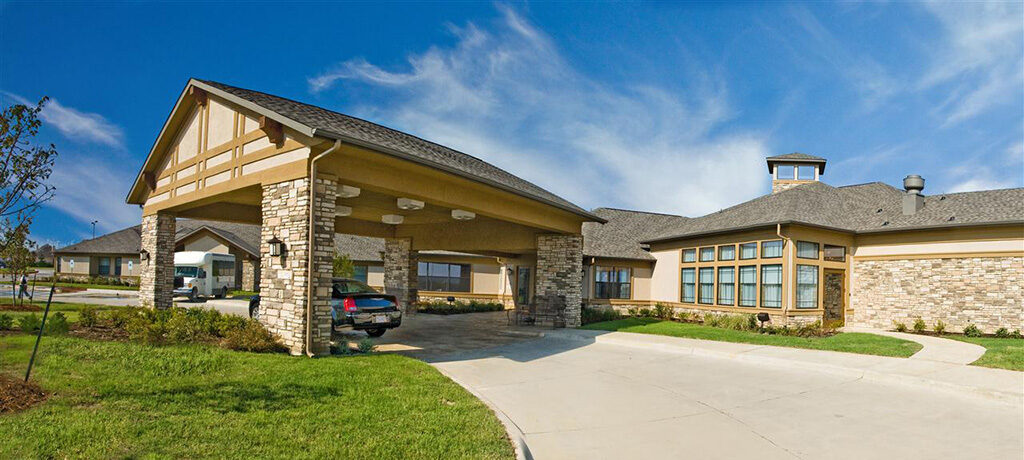
HC

Hospice Care

MC

Memory Care Specialized care for those with Memory Loss, Alzheimer's, or dementia, ensuring safety and support.

SNF

Nursing Homes 24/7 care needed

RC

Respite Care

Allen
120
-
71
HARDEN NON-HUD HOLDCO, LLC
81.2%
$13,805,713.00
$5,515,140.00
39.9%
73
4/5
3.3867
4/5
2/5
4/5
-
20
-
-29%
-7%
+28%
Private / Semi-Private Suites
Prairie Estates
SNF

Nursing Homes 24/7 care needed

Frisco (Meadow Creek)
180
-
22
SUTTON HEALTH CARE CENTER LTD CO
79.6%
$15,358,421.00
$7,111,921.00
46.3%
144
4/5
-
4/5
1/5
5/5
2
20
2
+9%
-
+25%
Private / Semi-Private Rooms
The Collinwood Care Center
SNF

Nursing Homes 24/7 care needed

Plano
120
A+
55
DSJ HEALTHCARE INC
52.5%
$3,246,955.00
$1,723,086.00
53.1%
62.40
1/5
3.8346
1/5
3/5
4/5
1
22
3
-19%
+6%
-17%
Private / Semi-Private Rooms

Places of interest near Princeton Medical Lodge

Address 2 miles from city center

Address 1401 W Princeton Dr, Princeton, TX 75407

Calculate Travel Distance to Princeton Medical Lodge

Add your location

Address

Staffing Data

Source: CMS Payroll-Based Journal (Q2 2025)

125
Total Staff
125
Employees
0
Contractors
40,859
Total Hours (Quarter)
50
Avg Staff/Day
9
Avg Shift (hrs)
Nursing Staff Breakdown
Role Count Avg Shift (hrs) Uses Contractors?
Registered Nurse39.4 No
Licensed Practical Nurse1810 No
Certified Nursing Assistant599.4 No
Staff by Category
Administration
1 staff
8hs shift avg
Nursing Staff
95 staff
9.5hs shift avg
Physicians & Practitioners
5 staff
7.7hs shift avg
Therapy Services
17 staff
6.7hs shift avg
Activities & Recreation
1 staff
6.4hs shift avg
Social Services
3 staff
6.3hs shift avg
Dietary Services
2 staff
7.7hs shift avg
Other Services
1 staff
7.8hs shift avg
Role Employees Contractors Total Staff Total Hours Days Worked % of Days Avg Shift (hrs)
Certified Nursing Assistant5905919,42991100%9.4
Licensed Practical Nurse180188,02791100%10
Medication Aide/Technician120122,94191100%9.5
Registered Nurse3031,57791100%9.4
RN Director of Nursing3031,5327178%8.3
Clinical Nurse Specialist2021,0127481%9.1
Speech Language Pathologist6068807077%6.8
Physical Therapy Aide5058736673%7.4
Physical Therapy Assistant4047407380%7.2
Dietitian1015456976%7.9
Qualified Social Worker3035266268%6.3
Administrator1015126470%8
Mental Health Service Worker1014936369%7.8
Other Dietary Services Staff1014826470%7.5
Respiratory Therapy Technician2024757582%5.1
Nurse Practitioner3034317582%5.8
Therapeutic Recreation Specialist1013866066%6.4

Facility Characteristics

Source: CMS Long-Term Care Facility Characteristics (Data as of Jan 2026)

Total census
111 residents
Residents by payment source
Medicare
20 residents (18%)
Medicaid
74 residents (66.7%)
Private pay or other
17 residents (15.3%)
Programs & Services
Residents' Group

Residents meet regularly to discuss policies, care quality, and activities

Nurse Aide Training

State-approved Nurse Aide Training and Competency Evaluation Program on-site

Active Resident Council

Organized group of residents that meets regularly to discuss facility policies, quality of life, and activities.

Quality of care over time

These measures show how residents usually do over time at this home, based on health outcomes and preventive care.

High-risk clinical events score Info A composite score based on pressure ulcers, falls with injury, weight loss, walking ability decline, and activities of daily living decline. 10.0
16% worse than Texas average

Texas average: 8.6

Functional decline score Info A composite score based on activities of daily living decline, walking ability decline, and incontinence. 23.0
43% worse than Texas average

Texas average: 16.0

Long-stay resident measures
Above average Texas avg: 4.2 Info CMS star rating based on long-stay quality measure performance. 5 stars = significantly above average, 1 star = significantly below average.
Need for Help with Daily Activities Increased Info Percent of long-stay residents whose need for help with daily activities has increased 12.8%
21% better than Texas average

Texas average: 16.2%

Walking Ability Worsened Info Percent of long-stay residents whose ability to move independently worsened 24.9%
54% worse than Texas average

Texas average: 16.2%

Low Risk Residents with Bowel/Bladder Incontinence Info Percent of low risk long-stay residents who lose control of their bowels or bladder 31.1%
99% worse than Texas average

Texas average: 15.7%

Falls with Major Injury Info Percent of long-stay residents experiencing one or more falls with major injury 4.5%
40% worse than Texas average

Texas average: 3.2%

High Risk Residents with Pressure Ulcers Info Percent of long-stay high risk residents with pressure ulcers 4.2%
6% better than Texas average

Texas average: 4.4%

Urinary Tract Infection Info Percent of long-stay residents with a urinary tract infection 1.3%
56% worse than Texas average

Texas average: 0.8%

Lost Too Much Weight Info Percent of long-stay residents who lose too much weight 3.5%
In line with Texas average

Texas average: 3.5%

Depressive Symptoms Info Percent of long-stay residents who have depressive symptoms 73.1%
2449% worse than Texas average

Texas average: 2.9%

Antipsychotic Use Info Percent of long-stay residents who received an antipsychotic medication 9.7%
23% worse than Texas average

Texas average: 7.9%

Pneumococcal Vaccine Info Percent of long-stay residents assessed and appropriately given the pneumococcal vaccine 99.8%
In line with Texas average

Texas average: 97.3%

Influenza Vaccine Info Percent of long-stay residents assessed and appropriately given the seasonal influenza vaccine 100.0%
In line with Texas average

Texas average: 97.9%

Hospitalizations per 1,000 days Info Number of hospitalizations per 1,000 long-stay resident days. 2.67
25% worse than Texas average

Texas average: 2.13

ED visits per 1,000 days Info Number of outpatient emergency department visits per 1,000 long-stay resident days. 1.22
41% better than Texas average

Texas average: 2.07

Short-stay resident measures
Above average Texas avg: 2.9 Info CMS star rating based on short-stay quality measure performance. 5 stars = much above average, 1 star = much below average.
Pneumococcal Vaccine Info Percent of short-stay residents assessed and appropriately given the pneumococcal vaccine 93.5%
In line with Texas average

Texas average: 90.4%

Antipsychotic medication increase Info Percent of short-stay residents who newly received an antipsychotic medication 1.2%
16% better than Texas average

Texas average: 1.4%

Influenza Vaccine Info Percent of short-stay residents assessed and appropriately given the seasonal influenza vaccine 91.1%
In line with Texas average

Texas average: 88.0%

Re-hospitalized after SNF stay Info Percentage of short-stay residents who were re-hospitalized after their nursing home admission. 27.3%
5% worse than Texas average

Texas average: 25.9%

Emergency department visits Info Percentage of short-stay residents who had an outpatient emergency department visit. 5.1%
58% better than Texas average

Texas average: 12.0%

Falls with major injury Info Percentage of SNF residents who experience falls with major injury during their stay. 1.7%
114% worse than Texas average

Texas average: 0.8%

Ability to care for self at discharge Info Percentage of residents at or above expected ability to care for themselves at discharge. 49.1%
9% worse than Texas average

Texas average: 53.7%

Successful return to home or community Info Rate of successful return to home or community from a skilled nursing facility. 52.5%
In line with Texas average

Texas average: 50.6%

Guides for Better Senior Living

Care Cost Calculator: See Prices in Your Area

Nursing Home Data Explorer

Don’t Wait Too Long: 7 Red Flag Signs Your Parent Needs Assisted Living Now

The True Cost of Assisted Living in 2025 – And How Families Are Paying For It

Understanding Senior Living Costs: Pricing Models, Discounts & Financial Assistance

Financial Aid for Texas Seniors

Get financial aid guidance

Community Care for the Aged and Disabled (CCAD)

TX Medicaid CCAD

Age 65+ or disabled, Texas resident, Medicaid-eligible, care need (not always nursing home level).

~$2,829/month (300% FBR, individual).

$2,000 (individual), $3,000 (couple).

Large state; rural access challenges.

Texas Community Care Services

TX CCS

Age 60+, Texas resident, at risk of decline.

~$2,000/month (individual, varies).

$5,000 (individual).

Limited funding; high demand in urban areas.

Area Agency on Aging (AAA) Services

Texas AAA Services

Age 60+, TX resident; no income/asset limits.

None; donations encouraged.

Not assessed.

28 AAAs; includes Meals on Wheels in some areas.

Medicare Savings Program (MSP)

Texas Medicare Savings Program

Age 65+ or disabled, TX resident, Medicare Part A/B.

~$2,510/month (QMB), ~$3,380/month (SLMB), ~$3,598/month (QI)—individual.

$9,430 (individual), $14,130 (couple).

Includes Extra Help for Part D; no waitlist.

Low-Income Home Energy Assistance Program (LIHEAP)

Texas Comprehensive Energy Assistance Program (CEAP)

Age 60+ prioritized, TX resident, low-income.

~$3,970/month (185% FPL).

Not assessed.

Priority for elderly/disabled; covers gas, electric, propane.

Family Caregiver Support Program (FCSP)

Texas Family Caregiver Support Program

Caregivers of 60+ needing care or 55+ caregivers of others; TX resident; 2+ ADLs.

No strict cap; prioritizes low-income (~$24,980/year).

Not assessed.

High rural demand; includes grandparent caregivers.

Senior Community Service Employment Program (SCSEP)

Texas SCSEP

Age 55+, unemployed, low-income, TX resident.

~$1,983/month (125% FPL).

Not specified.

Priority for veterans, rural residents; AARP partnership.

VA Aid and Attendance (A&A) and Housebound Benefits

Texas VA Aid and Attendance/Housebound

Age 65+ or disabled veteran/spouse, TX resident, wartime service, ADL help (A&A) or homebound.

Net income < ~$1,984/month (veteran with dependent, A&A); pension offsets income.

~$155,356 (net worth).

High veteran population; supports rural/urban needs.

Property Tax Exemption for Seniors

Texas Senior Property Tax Exemption

Age 65+, TX resident, homeowner (homestead).

None; tax-based eligibility.

Not assessed.

$25,000+ exemption; optional freeze in some counties; saves ~$500-$1,000/year.

Senior Farmers’ Market Nutrition Program (SFMNP)

Texas SFMNP

Age 60+, TX resident, low-income.

~$2,322/month (185% FPL).

Not assessed.

Vouchers (~$50/season); serves ~20,000 via 28 AAAs.

Tour Icon
Planning a tour? Check our touring checklist.
Chat Icon
Thinking of living here? We can help you speak to a current resident