Explore Open Rooms

1 Contact details
2 What type of senior care service are you looking for?
3 What budget do you have in mind for senior care?
4 How soon do you need to find care?
5 Additional details

Thank you for your interest!

Our team will be in touch shortly to help with next steps.

Nursing Home

Quitman County Health and Rehab Center

Nursing Home

Quitman County Health and Rehab Center

350 Getwell Drive, Marks, MS 38646 View map
Overview of Quitman County Health and Rehab Center

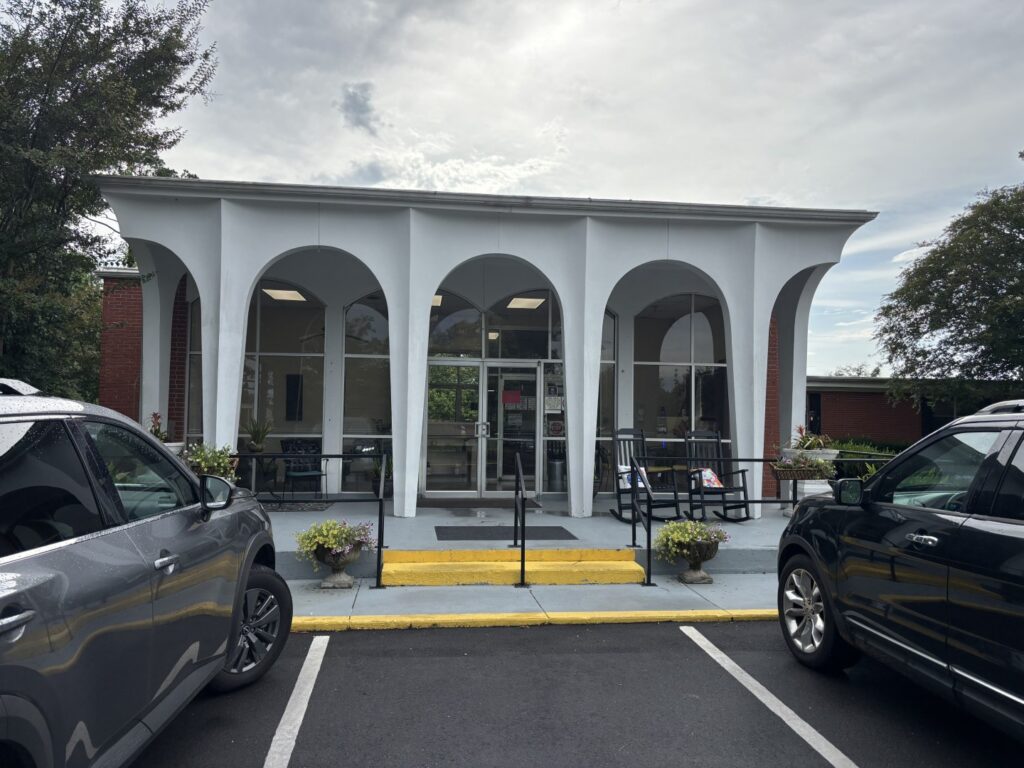
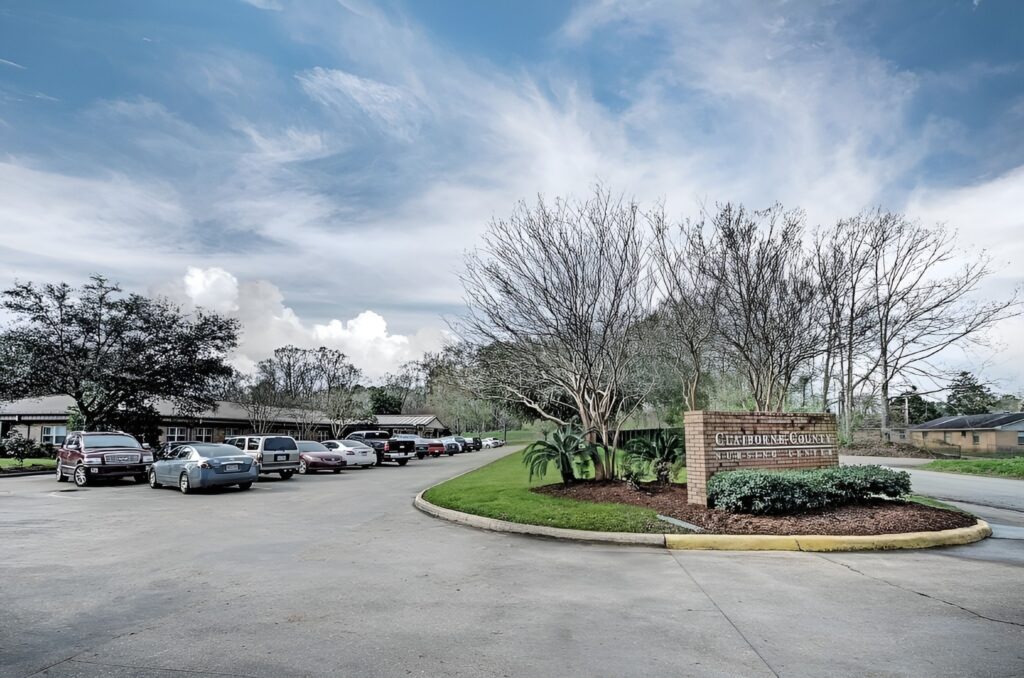
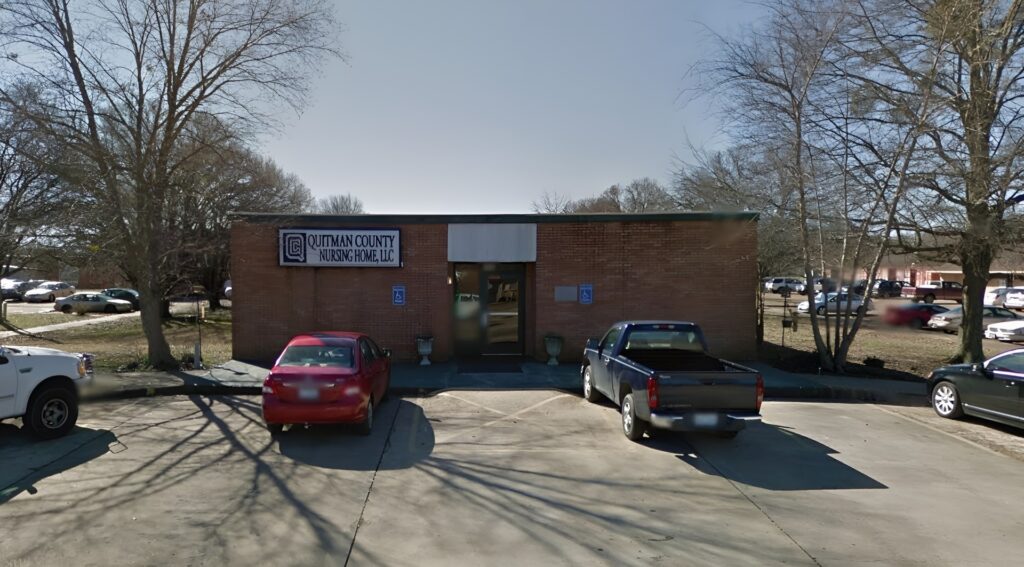
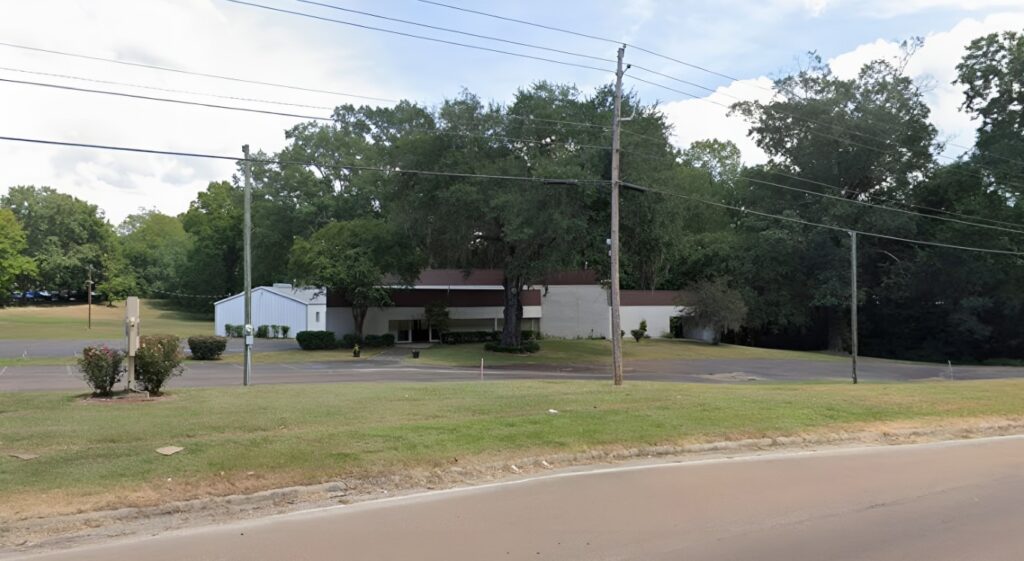
Quitman County Health and Rehab Center is a dedicated nursing home in Marks, MS, that offers rehabilitaiton and skilled nursing. Here, residents do not have to worry about their healthcare needs with a wide range of care options available around the clock. This nursing home also participates in Medicare and Medicaid to ease financial burdens.

To improve residents’ living experiences, therapeutic services, including physical, occupational, and speech therapy, are provided. With fun social events and engaging recreational programs, residents are encouraged to participate nad connect with their peers. This pet-friendly nursing home is a good option for older adults seeking a wide range of care to reach their potential in retirement.

(662) 326-3690

Quality ratings

Measured by Centers for Medicare & Medicaid Services (CMS)

Overall rating Info The Overall CMS Rating combines results from health inspections, staffing levels and quality measures. Health inspections carry the most weight. Staffing and quality scores can increase or decrease the final rating based on performance compared to state and national standards.
4/5
Mississippi average: 2.6/5
Health Inspection Info Based on the results of the facility's three most recent standard inspections and any complaint investigations. CMS reviews the number, scope, and severity of deficiencies, with more recent findings weighted more heavily.
4/5
Mississippi average: 2.9/5
Staffing Info Measures average nursing staff hours per resident per day, including Registered Nurses (RNs) and total nursing staff. Ratings are adjusted based on the level of care residents require and are compared to state and national benchmarks.
3/5
Mississippi average: 3.3/5
Quality Measures Info Based on clinical and physical health indicators reported to CMS, such as hospital readmissions, falls, pressure ulcers, and improvements in mobility. These measures reflect how well residents' health needs are being managed.
3/5
Mississippi average: 2.2/5

Nursing care per resident

Info This shows how many total hours of nursing staff time are available per resident each day. Higher numbers usually mean more staff support.
5h 18m per day

This home provides 21% more nursing time per resident than the Mississippi average.

Mississippi average: 4h 23m per day

Staffing hours breakdown

Info Hours of care per resident per day, broken down by staff type. Data from CMS Medicare.
Staff type Facility State avg National avg
Registered Nurse (RN) Info Registered nurse hours per resident per day. 24m per day 38m per day 41m per day
Nurse Aide Info Nurse aide hours per resident per day. 2h 36m per day 2h 29m per day 2h 21m per day
Total Nursing (Weekend) Info Total number of nurse staff hours per resident per day on weekends. 3h 33m per day 3h 31m per day 3h 26m per day
RN (Weekend) Info Registered nurse hours per resident per day on weekends. 13m per day 22m per day 29m per day

Capacity and availability

Smaller home

May offer a more intimate, personalized care environment.

Total beds 60

This home usually has availability

Lower occupancy suggests more openings may be available.

Lower demand than the Mississippi average
Occupancy rate 83.3%
Residents per day (avg) 45
Occupancy rate
83.3%
Residents per day (avg)
45

Who this home usually serves

TYPE OF STAY

Mostly short-term rehab stays

Most residents typically stay for a few weeks or months before returning home or moving on.

Might be optimal for
Short stays Recovery Medicare-covered care

Breakdown by payment type

Medicare

54% of new residents, usually for short-term rehab.

Typical stay 7 days

Private pay

46% of new residents, often for short stays.

Typical stay 6 - 7 months

Finances and operations

Privately-owned community
Home revenue
$7.4M
Profit
$1.6M
Privately-owned community
Home revenue
$7,409,541.00
Profit
$1,623,719.00
Payroll costs Info The portion of the home's budget spent on staff, including nurses, caregivers, and other employees who support care and operations.
$2.3M
30.5% of revenue
Other operating costs Info All remaining costs needed to run the home, such as food, utilities, building maintenance, supplies and administrative expenses.
$3.5M
Total costs $5.8M
Bed community size
60-bed community
A moderately sized community that may balance personal attention with shared amenities and social activities.
Walk Score
Walk Score: 22 / 100
Car-dependent. Most errands require a car, with limited nearby walkable options.

About this community

Occupancy

Occupancy rate
83%
In line with Mississippi average
Occupied beds
50 / 60
Average residents 74 per day

License details

Facility type
Nursing Home Facility
County: Quitman

Ownership & operating entity

Quitman County Health and Rehab Center is administrated by Ashley Campbell.

Care Services

Provides Assisted Living
Offers Alzheimer's Care

What does this home offer?

Accepts Medicaid icon

Accept Medicaid: Yes

Building type icon
Building type icon

Building Type: Single-story

Dining services icon

Dining Services

On-site medical care and health services icon

On-site Medical Care and Health Services

Types of Care at Quitman County Health and Rehab Center

Nursing Home
Contact Quitman County Health and Rehab Center

Access & Eligibility

Ways to qualify for care at this community, including accepted programs and payment options.

Medicaid Accepted

This facility is certified for eligible Medicaid services.

Payment & Funding Options

Medicaid

Inspection History

In Mississippi, the State Department of Health, Bureau of Health Facilities Licensure conducts unannounced surveys to monitor facility compliance with health, safety, and resident rights laws.

18 visits/inspections

6 visits/inspections triggered by complaints

6 routine inspections

3 life safety inspections

Results

9 with issues

9 without issues

Latest inspection

Date:November 5, 2025
Type:Complaint Investigation

34 deficiencies

Deficiencies indicate regulatory issues. A higher number implies the facility had several areas requiring improvement.

Health Inspection History

Inspections
Total health inspections 3

Mississippi average 4.4


Last Health inspection on Aug 2024

Total health citations 10

Mississippi average 16.9

Citations per inspection
3.33

Mississippi average 3.83


Health citations are formal notices following inspections when they fail to comply with safety and care standards.

All 10 citations resulted from standard inspections.

Breakdown of citation severity (last 3 years)
Critical Health citations More info 0
100% better than Mississippi average

Mississippi average: 1


Serious Health citations More info 0
100% better than Mississippi average

Mississippi average: 1.1

0 critical citations More info Mississippi average: 1

0 serious citations More info Mississippi average: 1.1

10 moderate citations More info Mississippi average: 14.6

0 minor citations More info Mississippi average: 0.3
Citations history (last 3 years)
Quality of Care moderate citation Info Issues related to how well residents receive appropriate treatment and support for their medical and daily care needs. Aug 29, 2024
Corrected

Care Planning moderate citation Info Issues related to creating and updating personalized care plans for residents based on their needs and conditions. Aug 29, 2024
Corrected

Resident Rights moderate citation Info Issues related to resident's rights, including dignity, privacy, and the ability to make decisions about their care. Aug 29, 2024
Corrected

Infection Control moderate citation Info Issues related to preventing and controlling infections, including hygiene practices and safety protocols. Jul 13, 2023
Corrected

Compare Nursing Homes around Mississippi The information below is reported by the Mississippi State Department of Health, Bureau of Health Facilities Licensure.

5 facilities compared · CMS & MS Dept. of Health data · Updated Mar 2026

Glen Oaks Nursing Center
NH

Nursing Home Licensed facility providing 24/7 skilled nursing care for residents with complex, ongoing medical needs. Staffed by RNs, LPNs, and CNAs. Inspected and star-rated annually by CMS. Accepts Medicare (short-term rehab) and Medicaid (long-term care).

Lucedale
45
73.1%
-11%
-
-
-
0
0
0
40
42
Gonc Ltc, Llc
$4,8M
$1,7M
36.8%
255181
Claiborne County Senior Care
NH

Nursing Home Licensed facility providing 24/7 skilled nursing care for residents with complex, ongoing medical needs. Staffed by RNs, LPNs, and CNAs. Inspected and star-rated annually by CMS. Accepts Medicare (short-term rehab) and Medicaid (long-term care).

Port Gibson
75
89.3%
+8%
5.78
-44%
+25%
0
9
0
65
0
Claiborne County Senior Care Llc
$8,7M
$2,9M
33.2%
255192
Quitman County Health and Rehab Center
NH

Nursing Home Licensed facility providing 24/7 skilled nursing care for residents with complex, ongoing medical needs. Staffed by RNs, LPNs, and CNAs. Inspected and star-rated annually by CMS. Accepts Medicare (short-term rehab) and Medicaid (long-term care).

Marks
60
80.5%
-2%
5.30
-23%
+14%
0
10
0
45
22
Campbell, Ashley
$6,2M
$2,3M
36.7%
255344
Adams County Nursing Center
NH

Nursing Home Licensed facility providing 24/7 skilled nursing care for residents with complex, ongoing medical needs. Staffed by RNs, LPNs, and CNAs. Inspected and star-rated annually by CMS. Accepts Medicare (short-term rehab) and Medicaid (long-term care).

Natchez
100
56.6%
-31%
4.66
-55%
+1%
2
23
3
61
15
Elton G Beebe Sr Irrv Grndchildrens Tr
$5,8M
$3,0M
51.1%
255169
Glen Burney Nursing Home
NH

Nursing Home Licensed facility providing 24/7 skilled nursing care for residents with complex, ongoing medical needs. Staffed by RNs, LPNs, and CNAs. Inspected and star-rated annually by CMS. Accepts Medicare (short-term rehab) and Medicaid (long-term care).

Natchez
96
68.7%
-17%
4.72
-33%
+2%
2
34
3
61
17
Borum, Charles
$9,9M
$2,0M
20%
255173

Places of interest near Quitman County Health and Rehab Center

Address 1 miles from city center

Address 350 Getwell Drive, Marks, MS 38646

Calculate Travel Distance to Quitman County Health and Rehab Center

Add your location

Address

Staffing Data (Q2 2025)

This data corresponds to Q2 2025 and is based on CMS Payroll-Based Journal.

Total staff 69
Employees 46
Contractors 23
Staff to resident ratio 1.53:1
10% worse than Mississippi average

Mississippi average ratio: 1.69:1

Avg staff/day 25
Average shift 8.8 hours
10% better than Mississippi average

Mississippi average: 8 hours

Total staff hours (quarter) 20,087
Nursing staff breakdown
Registered Nurse

Manages medical care and health needs.

Total count 5
Average shift length Info Average shift length. Calculated as total hours divided by days worked and average staff per day. 8 hours

No contractors work on this role.

Licensed Practical Nurse

Assists with medical care and medications.

Total count 19
Average shift length Info Average shift length. Calculated as total hours divided by days worked and average staff per day. 9 hours

This role is partially covered by contractors.

Certified Nursing Assistant

Helps with daily care and mobility.

Total count 30
Average shift length Info Average shift length. Calculated as total hours divided by days worked and average staff per day. 9.7 hours

This role is partially covered by contractors.

Contractor staffing

Total hours from contractors

13.9%

2,795 contractor hours this quarter

Certified Nursing Assistant: 10 Licensed Practical Nurse: 3 Occupational Therapy Assistant: 2 Qualified Social Worker: 2 Physical Therapy Aide: 1 Speech Language Pathologist: 1 Medical Director: 1 Physical Therapy Assistant: 1 Respiratory Therapy Technician: 1 Occupational Therapy Aide: 1
Staff by category
Certified Nursing Assistant20103010,15391100%9.7
Licensed Practical Nurse163196,32591100%9
Registered Nurse5051,20291100%8
Dental Services Staff1014686167%7.7
Other Dietary Services Staff1014636167%7.6
Administrator1014405560%8
Nurse Practitioner2024005055%8
Physical Therapy Aide0112396268%3.9
Physical Therapy Assistant0111512831%5.4
Speech Language Pathologist0111225965%2.1
Medical Director0113833%12.7
Occupational Therapy Aide0113667%6
Occupational Therapy Assistant0222433%4
Qualified Social Worker022221314%1.7
Respiratory Therapy Technician011422%2.2
30 Certified Nursing Assistant
% of Days 100%
19 Licensed Practical Nurse
% of Days 100%
5 Registered Nurse
% of Days 100%
1 Dental Services Staff
% of Days 67%
1 Other Dietary Services Staff
% of Days 67%
1 Administrator
% of Days 60%
2 Nurse Practitioner
% of Days 55%
1 Physical Therapy Aide
% of Days 68%
1 Physical Therapy Assistant
% of Days 31%
1 Speech Language Pathologist
% of Days 65%
1 Medical Director
% of Days 3%
1 Occupational Therapy Aide
% of Days 7%
2 Occupational Therapy Assistant
% of Days 3%
2 Qualified Social Worker
% of Days 14%
1 Respiratory Therapy Technician
% of Days 2%

Facility Characteristics

Source: CMS Long-Term Care Facility Characteristics (Data as of Jan 2026)

Total census
45 residents
Residents by payment source
Medicare
3 residents (6.7%)
Medicaid
40 residents (88.9%)
Private pay or other
2 residents (4.4%)
Programs & Services
Residents' Group

Residents meet regularly to discuss policies, care quality, and activities

Family Member Group

Family members meet regularly to discuss policies, care quality, and activities

Active Family Council

Organized group of family members that meets regularly to discuss facility policies, resident care, and activities.

Active Resident Council

Organized group of residents that meets regularly to discuss facility policies, quality of life, and activities.

Quality of care over time

These measures show how residents usually do over time at this home, based on health outcomes and preventive care.

High-risk clinical events score Info A composite score based on pressure ulcers, falls with injury, weight loss, walking ability decline, and activities of daily living decline. 8.3
33% better than Mississippi average

Mississippi average: 12.4

Functional decline score Info A composite score based on activities of daily living decline, walking ability decline, and incontinence. 21.0
6% better than Mississippi average

Mississippi average: 22.3

Long-stay resident measures
Above average Mississippi avg: 1.9 Info CMS star rating based on long-stay quality measure performance. 5 stars = significantly above average, 1 star = significantly below average.
Need for Help with Daily Activities Increased Info Percent of long-stay residents whose need for help with daily activities has increased 22.1%
5% worse than Mississippi average

Mississippi average: 21.2%

Walking Ability Worsened Info Percent of long-stay residents whose ability to move independently worsened 8.8%
64% better than Mississippi average

Mississippi average: 24.5%

Low Risk Residents with Bowel/Bladder Incontinence Info Percent of low risk long-stay residents who lose control of their bowels or bladder 32.1%
50% worse than Mississippi average

Mississippi average: 21.4%

Falls with Major Injury Info Percent of long-stay residents experiencing one or more falls with major injury 2.2%
30% better than Mississippi average

Mississippi average: 3.2%

High Risk Residents with Pressure Ulcers Info Percent of long-stay high risk residents with pressure ulcers 3.2%
55% better than Mississippi average

Mississippi average: 7.1%

Urinary Tract Infection Info Percent of long-stay residents with a urinary tract infection 0.6%
78% better than Mississippi average

Mississippi average: 2.6%

Lost Too Much Weight Info Percent of long-stay residents who lose too much weight 4.8%
22% better than Mississippi average

Mississippi average: 6.2%

Depressive Symptoms Info Percent of long-stay residents who have depressive symptoms 2.8%
82% worse than Mississippi average

Mississippi average: 1.5%

Antipsychotic Use Info Percent of long-stay residents who received an antipsychotic medication 27.9%
32% worse than Mississippi average

Mississippi average: 21.2%

Pneumococcal Vaccine Info Percent of long-stay residents assessed and appropriately given the pneumococcal vaccine 100.0%
In line with Mississippi average

Mississippi average: 95.9%

Influenza Vaccine Info Percent of long-stay residents assessed and appropriately given the seasonal influenza vaccine 98.0%
In line with Mississippi average

Mississippi average: 97.0%

Hospitalizations per 1,000 days Info Number of hospitalizations per 1,000 long-stay resident days. 1.36
44% better than Mississippi average

Mississippi average: 2.44

ED visits per 1,000 days Info Number of outpatient emergency department visits per 1,000 long-stay resident days. 2.60
10% better than Mississippi average

Mississippi average: 2.88

Short-stay resident measures
Pneumococcal Vaccine Info Percent of short-stay residents assessed and appropriately given the pneumococcal vaccine 77.3%
12% worse than Mississippi average

Mississippi average: 87.9%

Guides for Better Senior Living

Care Cost Calculator: See Prices in Your Area

Nursing Home Data Explorer

Don’t Wait Too Long: 7 Red Flag Signs Your Parent Needs Assisted Living Now

The True Cost of Assisted Living in 2025 – And How Families Are Paying For It

Understanding Senior Living Costs: Pricing Models, Discounts & Financial Assistance

Financial Aid for Mississippi Seniors

Get financial aid guidance

Elderly and Disabled Waiver

Mississippi Medicaid E&D Waiver

Age 65+ or disabled, Mississippi resident, Medicaid- eligible, nursing home-level care need.

~$2,829/month (300% FBR, individual).

$4,000 (individual, higher than most states).

Higher asset limit; rural focus.

Mississippi Caregiver Respite Program

MS NFCSP Respite

Caregiver of someone 60+, Mississippi resident.

No strict limit; prioritizes low-income.

Not applicable.

Limited slots; rural emphasis.

Assisted Living (AL) Waiver

Mississippi Assisted Living Waiver

Age 65+ or disabled, Mississippi resident, Medicaid-eligible, NFLOC, living in approved AL facility.

~$2,829/month (300% FBR, individual); QIT required.

$4,000 (individual), $6,000 (couple).

Only for AL facilities with waiver contracts; small program size.

Independent Living (IL) Waiver

Mississippi Independent Living Waiver

Age 16+ (65+ for seniors), Mississippi resident, Medicaid-eligible, NFLOC but capable of self-direction.

~$2,829/month (300% FBR, individual); QIT required.

$4,000 (individual), $6,000 (couple).

Self-directed care; limited to in-home settings.

Medicare Savings Program (MSP)

Mississippi Medicare Savings Program

Age 65+ or disabled, Mississippi resident, Medicare Part A/B.

~$2,510/month (QMB), ~$3,380/month (SLMB), ~$3,598/month (QI)—individual.

$9,430 (individual), $14,130 (couple).

Three tiers; no waitlist; includes Extra Help for Part D.

Mississippi Homemaker Program

Mississippi Homemaker Program (via Area Agencies on Aging)

Age 60+, Mississippi resident, not Medicaid-eligible, needs assistance with daily living.

~$1,063/month (100% FPL, individual); prioritizes low-income.

Not strictly assessed; need-based focus.

10 AAAs; waitlist possible due to funding caps.

Senior Community Service Employment Program (SCSEP)

Mississippi SCSEP

Age 55+, unemployed, low-income, Mississippi resident.

~$1,983/month (125% FPL).

Not specified; income-focused.

Priority for veterans, rural residents; MDES oversees.

VA Aid and Attendance (A&A) and Housebound Benefits

Mississippi VA Aid and Attendance/Housebound

Age 65+ or disabled veteran/spouse, Mississippi resident, wartime service, need for ADL help (A&A) or homebound.

Net income < ~$1,984/month (veteran with dependent, A&A); pension offsets income.

~$155,356 (net worth limit).

High veteran population in rural areas.