Total health inspections
5
Minnesota average 6
Last Health inspection on Jun 2025

We arrange tours, appointments, and even moving support so you don’t have to
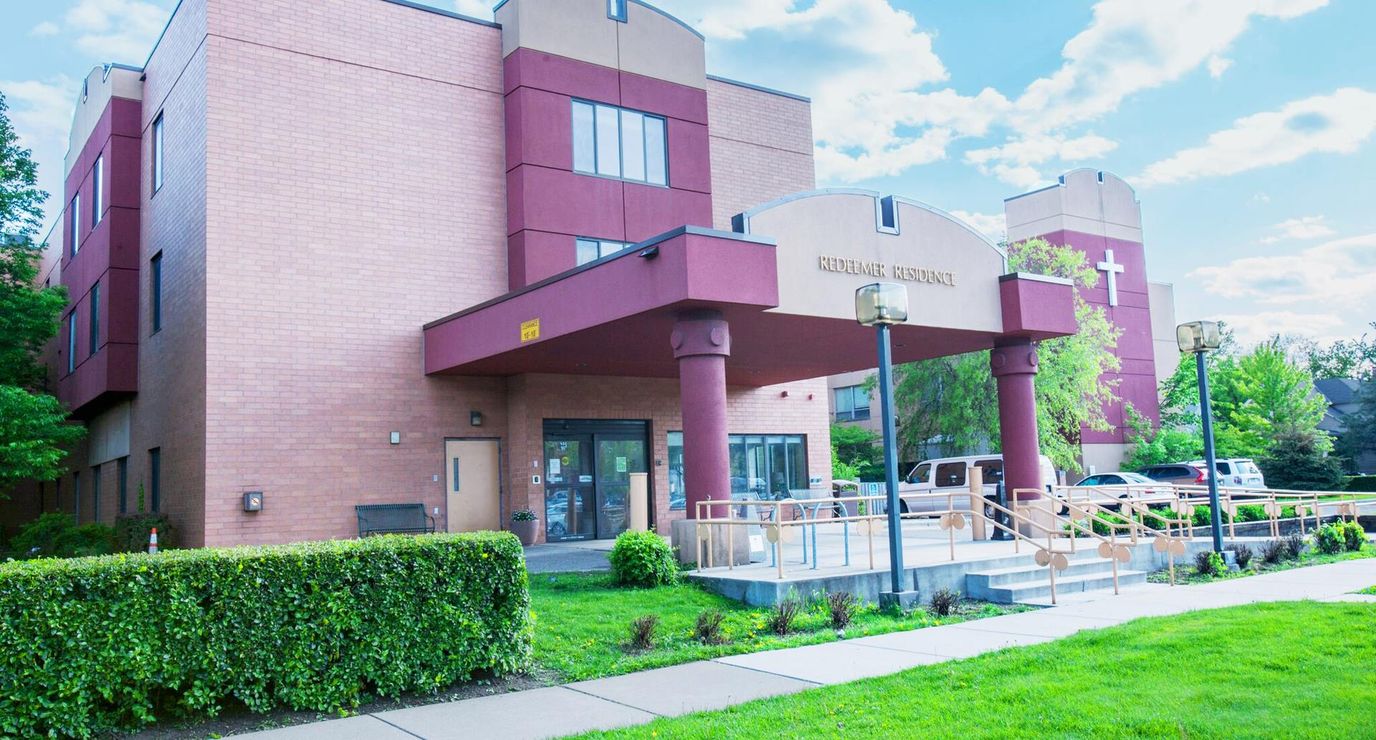
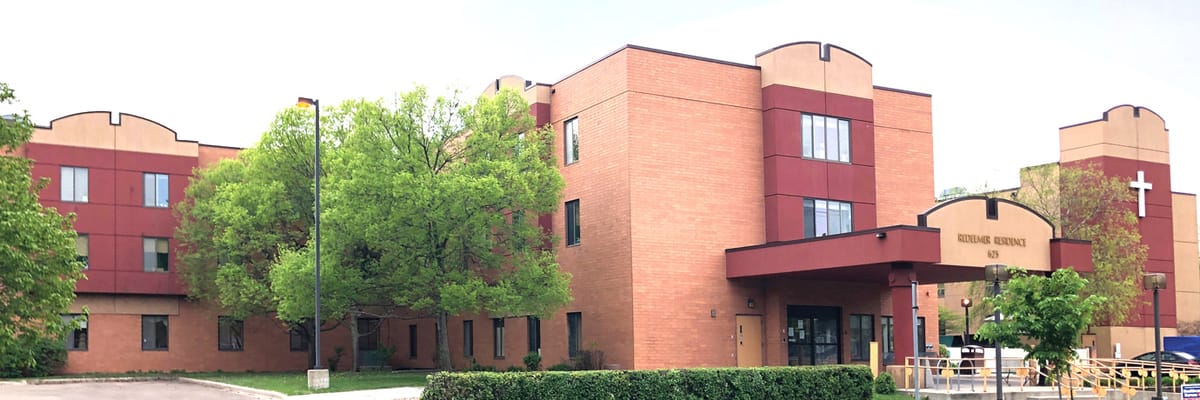


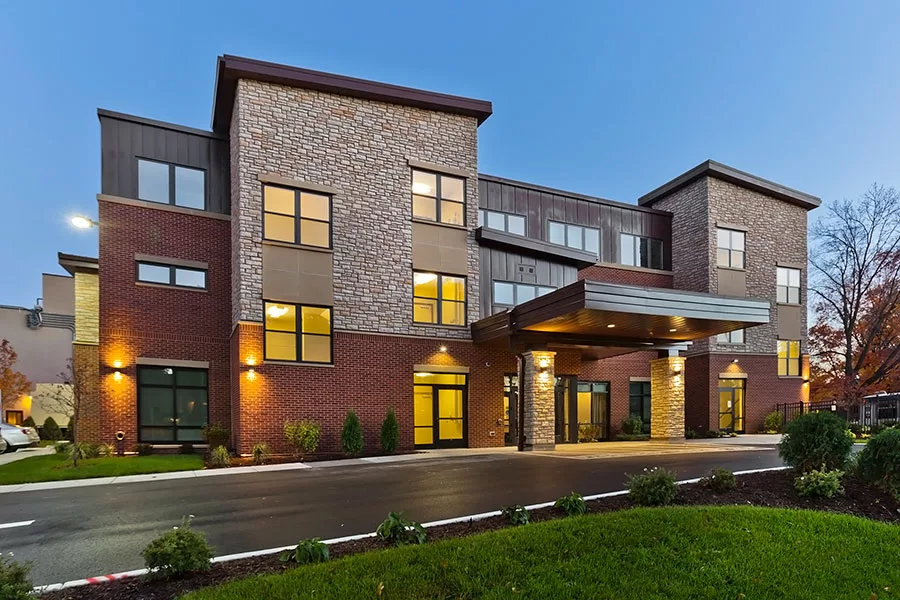
Located in the charming Lyn-Lake neighborhood lies the Redeemer Health Care Center, serving the community since 1946. Its enviable location places it within easy reach of local restaurants, places of worship, and medical professionals, making it an ideal choice for those seeking skilled nursing, transitional care, long-term care, hospice care, respite care, and spiritual guidance.
As a testament to its unwavering devotion to the Almighty, the center stands as a symbol of hope and comfort for those who are in need. Redeemer Health Care Center promotes the spiritual and emotional well-being of all residents through bible studies and chapel services. What sets Redeemer Health Care Center apart is the unique and meaningful interactions between residents and the children of Grandma’s House Children’s Center. This intergenerational connection brings joy and vitality to both groups and creates an extraordinary bond that transcends age.
| Staff type | Hours / day | vs state avg |
|---|---|---|
|
Registered Nurse (RN)
| 50m per day | ▼ 22% State avg: 1h 4m per day · National avg: 41m per day |
|
LPN / LVN
| 53m per day | ▲ 43% State avg: 37m per day · National avg: 52m per day |
|
Nurse Aide
| 2h 44m per day | ▲ 7% State avg: 2h 33m per day · National avg: 2h 21m per day |
|
Total Nursing (Weekend)
| 3h 59m per day | ▲ 8% State avg: 3h 41m per day · National avg: 3h 26m per day |
|
Physical Therapist
| 4m per day | ■ Avg State avg: 4m per day · National avg: 4m per day |
|
RN (Weekend)
| 28m per day | ▼ 32% State avg: 41m per day · National avg: 29m per day |
Occupancy between 85% and 95% suggests balanced demand.
Residents typically stay for brief periods, with frequent admissions and discharges throughout the year.
32% of new residents, usually for short-term rehab.
62% of new residents, often for short stays.
6% of new residents, often for long-term daily care.
Minnesota average 6
Last Health inspection on Jun 2025
Minnesota average 23.2
Minnesota average 3.76
Health citations are formal notices following inspections when they fail to comply with safety and care standards.
19 of 25 citations resulted from standard inspections; 2 of 25 resulted from complaint investigations; and 4 of 25 came from combined inspections (standard and complaint).
Minnesota average: 0.7
Minnesota average: 0.5
Data sourced from CMS Health Deficiencies reports. Citation severity codes range from A (least serious) to L (most serious). Immediate Jeopardy (J-L) citations indicate situations where the facility's noncompliance has placed residents at risk of death or serious harm.
Redeemer Health Care Center is located in Minneapolis, Minnesota.
Here are the financial assistance programs available to residents in Minnesota.
![]() 2.4 miles from city center
2.4 miles from city center
![]() Estimated distance in miles from Minneapolis's city center to Redeemer Health Care Center's address, calculated via Google Maps.
— 1.33 miles to nearest hospital (Abbott Northwestern's Joint Replacement Center)
Estimated distance in miles from Minneapolis's city center to Redeemer Health Care Center's address, calculated via Google Maps.
— 1.33 miles to nearest hospital (Abbott Northwestern's Joint Replacement Center)
Add your location
This data corresponds to Q2 2025 and is based on CMS Payroll-Based Journal.
Minnesota average ratio: 2.22:1
Minnesota average: 7.5 hours
Manages medical care and health needs.
No contractors work on this role.
Assists with medical care and medications.
No contractors work on this role.
Helps with daily care and mobility.
No contractors work on this role.
Total hours from contractors
2,892 contractor hours this quarter
| Certified Nursing Assistant | 81 | 0 | 81 | 23,092 | 91 | 100% | 7.4 |
| Registered Nurse | 23 | 0 | 23 | 7,152 | 91 | 100% | 8.3 |
| Licensed Practical Nurse | 25 | 0 | 25 | 7,150 | 91 | 100% | 7.6 |
| Medication Aide/Technician | 12 | 0 | 12 | 4,252 | 91 | 100% | 7.7 |
| RN Director of Nursing | 3 | 0 | 3 | 1,446 | 62 | 68% | 8.2 |
| Other Dietary Services Staff | 4 | 0 | 4 | 1,201 | 75 | 82% | 7.8 |
| Speech Language Pathologist | 0 | 5 | 5 | 1,014 | 67 | 74% | 7.3 |
| Clinical Nurse Specialist | 4 | 0 | 4 | 1,005 | 61 | 67% | 7.6 |
| Occupational Therapy Aide | 2 | 0 | 2 | 944 | 62 | 68% | 8 |
| Dental Services Staff | 2 | 0 | 2 | 829 | 63 | 69% | 7.6 |
| Nurse Aide in Training | 11 | 0 | 11 | 751 | 49 | 54% | 7.8 |
| Respiratory Therapy Technician | 0 | 5 | 5 | 576 | 68 | 75% | 7.6 |
| Physical Therapy Assistant | 0 | 8 | 8 | 526 | 74 | 81% | 6.5 |
| Physical Therapy Aide | 0 | 5 | 5 | 515 | 70 | 77% | 6.5 |
| Nurse Practitioner | 1 | 0 | 1 | 488 | 61 | 67% | 8 |
| Mental Health Service Worker | 1 | 0 | 1 | 464 | 58 | 64% | 8 |
| Administrator | 1 | 0 | 1 | 456 | 57 | 63% | 8 |
| Dietitian | 1 | 0 | 1 | 405 | 52 | 57% | 7.8 |
| Qualified Social Worker | 0 | 3 | 3 | 202 | 60 | 66% | 3.1 |
| Occupational Therapy Assistant | 0 | 1 | 1 | 57 | 35 | 38% | 1.6 |
| Medical Director | 0 | 1 | 1 | 3 | 3 | 3% | 1 |
Source: CMS Long-Term Care Facility Characteristics (Data as of Jan 2026)
Residents meet regularly to discuss policies, care quality, and activities
Family members meet regularly to discuss policies, care quality, and activities
Organized group of family members that meets regularly to discuss facility policies, resident care, and activities.
Organized group of residents that meets regularly to discuss facility policies, quality of life, and activities.
Data sourced from CMS Long-Term Care Facility Characteristics quarterly report. Payer mix reflects the current resident census by primary payment source.
These measures show how residents usually do over time at this home, based on health outcomes and preventive care.
Minnesota average: 11.1
Minnesota average: 22.6
Minnesota average: 18.9%
Minnesota average: 23.8%
Minnesota average: 25.0%
Minnesota average: 3.7%
Minnesota average: 5.4%
Minnesota average: 2.7%
Minnesota average: 4.1%
Minnesota average: 4.4%
Minnesota average: 17.2%
Minnesota average: 97.3%
Minnesota average: 96.0%
Minnesota average: 1.67
Minnesota average: 1.99
Minnesota average: 88.9%
Minnesota average: 1.9%
Minnesota average: 82.6%
Minnesota average: 23.1%
Minnesota average: 14.0%
Minnesota average: 0.8%
Minnesota average: 53.7%
Minnesota average: 50.6%
Quality measures are calculated from Minimum Data Set (MDS) assessments. For most measures, lower percentages indicate better care quality.
Federal penalties imposed by CMS for regulatory violations, including civil money penalties (fines) and denials of payment for new Medicare/Medicaid admissions.
Source: CMS Penalties Database (Data as of Jan 2026)
Minnesota average: $44K
Minnesota average: 2.0
Minnesota average: 0.4
Penalties are imposed by CMS for violations of federal nursing home regulations.
No penalties in the past 3 years
No civil money penalties or payment denials were reported in the last 3 years.
| Redeemer Health Care Center |
NH Nursing Home Licensed facility providing 24/7 skilled nursing care for residents with complex, ongoing medical needs. Staffed by RNs, LPNs, and CNAs. Inspected and star-rated annually by CMS. Accepts Medicare (short-term rehab) and Medicaid (long-term care).
AL Assisted Living A licensed, long-term care setting for seniors or individuals with disabilities who need help with daily activities — like bathing, dressing, and medication management — but not 24-hour skilled nursing. Offers housing, meals, and around-the-clock support while aiming to maximize resident independence. | Minneapolis (Powderhorn) | 119 | 93.9% | +18% | 5.23 | -15% | +10% | 1 | 25 | 5.0 | 0 | 109 | 95 | Colgan, Danny | $17.2M | $8.1M | 47.2% | 245520 | ||||
| Catholic Eldercare |
NH Nursing Home Licensed facility providing 24/7 skilled nursing care for residents with complex, ongoing medical needs. Staffed by RNs, LPNs, and CNAs. Inspected and star-rated annually by CMS. Accepts Medicare (short-term rehab) and Medicaid (long-term care).
AL Assisted Living A licensed, long-term care setting for seniors or individuals with disabilities who need help with daily activities — like bathing, dressing, and medication management — but not 24-hour skilled nursing. Offers housing, meals, and around-the-clock support while aiming to maximize resident independence. | Minneapolis (St. Anthony West) | 174 | 88.7% | +11% | 4.82 | +38% | +1% | 2 | 29 | 4.8 | 1 | 153 | 82 | Bauer, John | $22.9M | $12.0M | 52.4% | 245439 | ||||
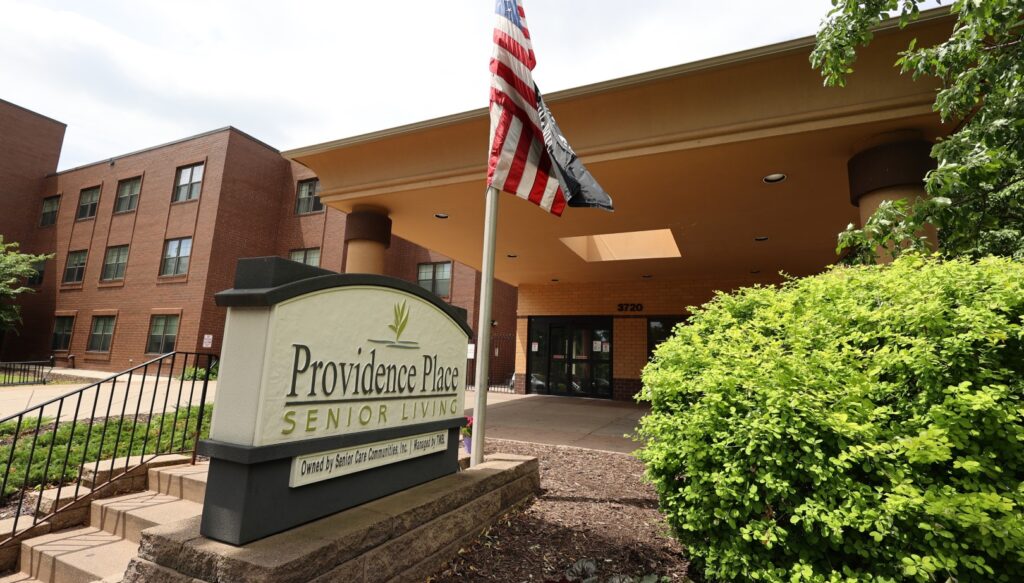
| Providence Place |
AL Assisted Living A licensed, long-term care setting for seniors or individuals with disabilities who need help with daily activities — like bathing, dressing, and medication management — but not 24-hour skilled nursing. Offers housing, meals, and around-the-clock support while aiming to maximize resident independence.
IL Independent Living Lifestyle-focused communities for older adults offering dining, activities, and transportation with minimal personal care. Best for active, independent seniors who want community without medical support.
MC Memory Care Secured, specialized care for people living with Alzheimer's or dementia. Staff trained in cognitive impairment, with higher staff-to-resident ratios and an environment designed to reduce confusion and wandering risk.
NH Nursing Home Licensed facility providing 24/7 skilled nursing care for residents with complex, ongoing medical needs. Staffed by RNs, LPNs, and CNAs. Inspected and star-rated annually by CMS. Accepts Medicare (short-term rehab) and Medicaid (long-term care). | Minneapolis (Standish) | 190 | 78.6% | -1% | 3.79 | -37% | -21% | 5 | 46 | 3.8 | 4 | 150 | 72 | Brooks, Michael | $20.1M | $8.6M | 42.7% | 245271 | ||||
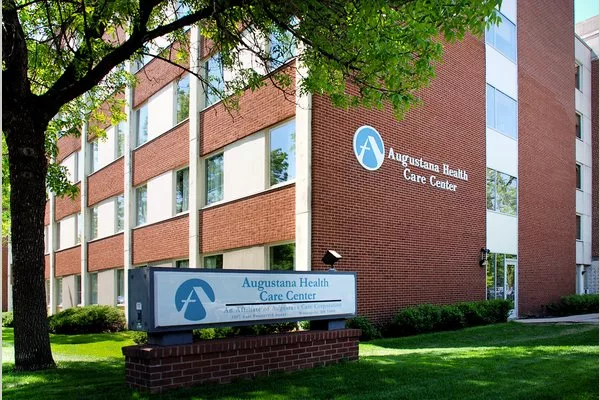
| Augustana Health Care Center of Minneapolis | - |
NH Nursing Home Licensed facility providing 24/7 skilled nursing care for residents with complex, ongoing medical needs. Staffed by RNs, LPNs, and CNAs. Inspected and star-rated annually by CMS. Accepts Medicare (short-term rehab) and Medicaid (long-term care).
AL Assisted Living A licensed, long-term care setting for seniors or individuals with disabilities who need help with daily activities — like bathing, dressing, and medication management — but not 24-hour skilled nursing. Offers housing, meals, and around-the-clock support while aiming to maximize resident independence. | Minneapolis (Calhoun Isles) | - | - | - | - | - | - | - | - | - | 0 | 0 | 0.0 | 0 | - | 96 | - | - | - | - | - |
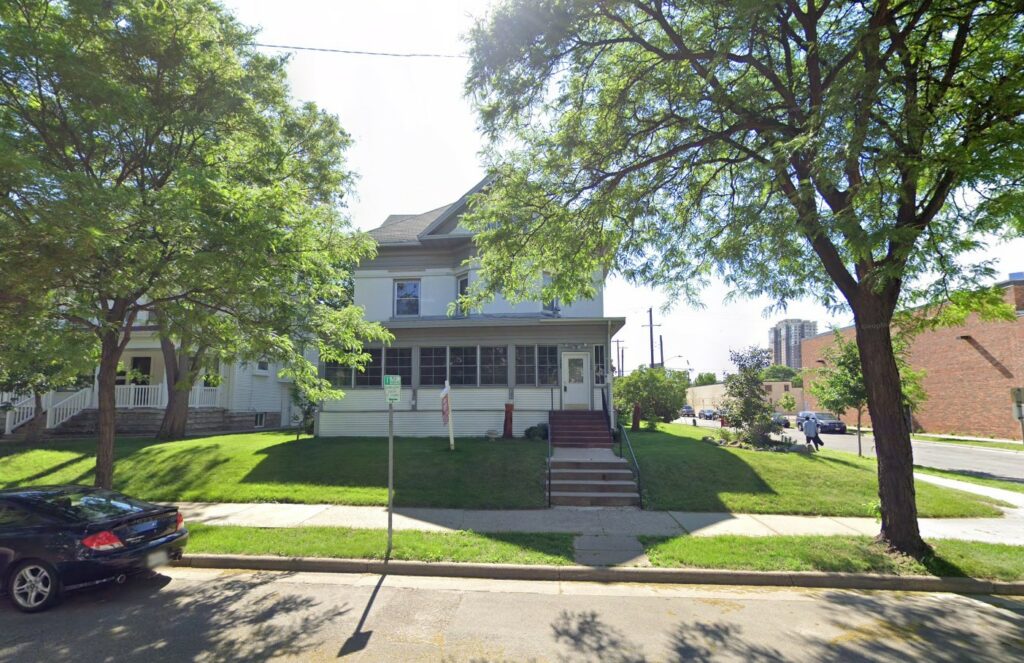
| Elliot Care Home | - |
NH Nursing Home Licensed facility providing 24/7 skilled nursing care for residents with complex, ongoing medical needs. Staffed by RNs, LPNs, and CNAs. Inspected and star-rated annually by CMS. Accepts Medicare (short-term rehab) and Medicaid (long-term care).
AL Assisted Living A licensed, long-term care setting for seniors or individuals with disabilities who need help with daily activities — like bathing, dressing, and medication management — but not 24-hour skilled nursing. Offers housing, meals, and around-the-clock support while aiming to maximize resident independence. | Minneapolis (Central Minneapolis) | - | - | - | - | - | - | - | - | - | 0 | 0 | 0.0 | 0 | - | 82 | - | - | - | - | - |
Historical financial and operational data for Redeemer Health Care Center based on CMS SNF Cost Reports.
Loading trend charts...
Care Cost Calculator: See Prices in Your Area
Nursing Home Data Explorer
Don’t Wait Too Long: 7 Red Flag Signs Your Parent Needs Assisted Living Now
The True Cost of Assisted Living in 2025 – And How Families Are Paying For It
Understanding Senior Living Costs: Pricing Models, Discounts & Financial Assistance


Thank you for your interest!
Our team will be in touch shortly to help with next steps.