Providence Place
Nursing Home, Hospice Care & Memory Care · Minneapolis, MN
CMS overall rating Info CMS (the Centers for Medicare & Medicaid Services) is the federal agency that rates nursing home quality. Its Overall Rating runs from 1 to 5 stars, combining health inspections, staffing, and quality measures, with inspections weighted most heavily.

Providence Place

Nursing Home, Hospice Care & Memory Care · Minneapolis, MN
CMS overall rating Info CMS (the Centers for Medicare & Medicaid Services) is the federal agency that rates nursing home quality. Its Overall Rating runs from 1 to 5 stars, combining health inspections, staffing, and quality measures, with inspections weighted most heavily.
Calculator: See prices in your area
Providence Place accepts Medicare, Medicaid, and private pay.

Overview of Providence Place

Start your healing journey with the trusted senior living community of Providence Place in 23rd Avenue South, Minneapolis, MN, specializing in memory care, transitional care, and skilled nursing. With a wide array of therapy services including physical, occupational, speech, and cognitive therapy, the community ensures seniors get better every day. A team of experienced and highly trained professionals lends extra hands for seniors to thrive and live to their potential.

The community fosters a bright and welcoming environment, empowering residents to enjoy every moment of their best years. Focusing on residents’ preferences, the community works hard to provide care and assistance tailored to their every need. Providence Place is a safe place for relaxation and security with its top-notch services and specially designed amenities.

(612) 724-5495

Quality ratings

Measured by Centers for Medicare & Medicaid Services (CMS)

Overall rating Info The Overall CMS Rating combines results from health inspections, staffing levels and quality measures. Health inspections carry the most weight. Staffing and quality scores can increase or decrease the final rating based on performance compared to state and national standards.
▼ 68.6% Below MN avg. ▼ 68.6% Below MN avg.MN average: 3.2Click the badge to see the full State ranking.Click here to see the full State ranking.
Health Inspection Info Based on the results of the facility's three most recent standard inspections and any complaint investigations. CMS reviews the number, scope, and severity of deficiencies, with more recent findings weighted more heavily.
▼ 64.4% Below MN avg. ▼ 64.4% Below MN avg.MN average: 2.8Click the badge to see the full State ranking.Click here to see the full State ranking.
Staffing Info Measures average nursing staff hours per resident per day, including Registered Nurses (RNs) and total nursing staff. Ratings are adjusted based on the level of care residents require and are compared to state and national benchmarks.
▼ 51.2% Below MN avg. ▼ 51.2% Below MN avg.MN average: 4.1Click the badge to see the full State ranking.Click here to see the full State ranking.
Quality Measures Info Based on clinical and physical health indicators reported to CMS, such as hospital readmissions, falls, pressure ulcers, and improvements in mobility. These measures reflect how well residents' health needs are being managed.
▼ 4.1% Below MN avg. ▼ 4.1% Below MN avg.MN average: 3.1Click the badge to see the full State ranking.Click here to see the full State ranking.

Staffing hours breakdown

Info Daily nursing hours per resident by staff type, reported to CMS. Higher is generally better — compare this facility to state and national averages to see where staffing stands.

Hours per resident per day — compared to Minnesota state averages

Total nursing care / resident Info This home is ranked 78th out of 89 homes in Minnesota for nurse hours. Total adjusted nursing hours per resident per day, combining RN, LPN, and aide time. CMS adjusts this for case-mix so facilities can be fairly compared.
3h 47m per day
Rank #78 / 89Nurse hours — State benchmarkedThis home is ranked 78th out of 89 homes in Minnesota. Shows adjusted nurse hours per resident per day benchmarked to the Minnesota average, with a ranking across 89 Minnesota facilities. More hours mean more direct care. The national average is about 3.5 hrs; below 3.0 is a red flag.Ranking totals vary by category as each rank only includes facilities that report data for that metric. Homes missing that data point aren't included in the ranking.Click the rank badge to see the full State ranking.Click here to see the full State ranking.
This facility Minnesota avg (4h 46m per day)
vs Minnesota avg
-21%

5 of 6 metrics below state avg

Standout metric Weekend RN is +4% above state avg
Staff typeHours / Day / Residentvs state avg
Registered Nurse (RN) Info RNs hold the highest nursing license and can assess residents, interpret test results, and direct care plans. More RN hours per day often signals stronger clinical oversight and faster response to health changes. 43m per day ▼ 33% State avg: 1h 4m per day · National avg: 41m per day
LPN / LVN Info Licensed Practical Nurses (LPNs) or Licensed Vocational Nurses (LVNs) deliver routine hands-on care — medication administration, wound dressing, and monitoring vital signs. They work under RN supervision and make up a large share of daily bedside care. 2m per day ▼ 94% State avg: 37m per day · National avg: 52m per day
Nurse Aide Info Certified Nurse Aides (CNAs) provide the most direct day-to-day assistance: bathing, dressing, feeding, and mobility. Nurse aide hours are typically the largest staffing category and directly affect residents' quality of life. 10m per day ▼ 93% State avg: 2h 33m per day · National avg: 2h 21m per day
Weekend Total Nursing Info Combined nursing hours (RN + LPN + Nurse Aide) per resident per day on weekends. Staffing often drops on weekends — this figure reveals whether the facility maintains adequate coverage outside of weekday hours. 48m per day ▼ 78% State avg: 3h 41m per day · National avg: 3h 26m per day
Physical Therapist Info Hours per resident per day provided by licensed Physical Therapists (PTs) or PT Assistants. PT services help residents recover mobility after injury or illness and are especially important for post-acute (short-stay) rehabilitation. 3m per day ▼ 31% State avg: 4m per day · National avg: 4m per day
Weekend RN Info Registered nurse hours specifically on weekends. Facilities sometimes reduce RN presence on Saturdays and Sundays — a low weekend RN figure compared to weekday hours can indicate reduced clinical oversight when most administrative staff are absent. 42m per day ▲ 4% State avg: 41m per day · National avg: 29m per day

Capacity and availability

This home usually has availability

Higher occupancy than the Minnesota average: 79.7%
Occupancy rate
81.6% Rank #137 / 331Occupancy rate — State benchmarkedThis home is ranked 137th out of 331 homes in Minnesota. Shows this facility's occupancy rate versus the Minnesota average, with its Statewide rank out of 331. Higher occupancy signals strong local demand and financial stability.Ranking totals vary by category as each rank only includes facilities that report data for that metric. Homes missing that data point aren't included in the ranking.Click the rank badge to see the full State ranking.Click here to see the full State ranking.
Avg. Length of Stay
298 days
Bed community size
190-bed community Rank #12 / 532Bed count — State benchmarkedThis home is ranked 12th out of 532 homes in Minnesota. Shows this facility's certified or reported bed count compared to other Minnesota facilities. Larger communities may offer more amenities, programs, and on-site services for residents and families.Ranking totals vary by category as each rank only includes facilities that report data for that metric. Homes missing that data point aren't included in the ranking.Click the rank badge to see the full State ranking.Click here to see the full State ranking.
A large-scale community that may provide a wide range of amenities, services, and structured programs.
Walk Score
Walk Score: 72 / 100 Rank #102 / 632Walk Score — State benchmarkedThis home is ranked 102nd out of 632 homes in Minnesota. Shows how walkable this facility's neighborhood is compared to the average Walk Score across Minnesota facilities. Higher scores benefit residents, families, and staff.Ranking totals vary by category as each rank only includes facilities that report data for that metric. Homes missing that data point aren't included in the ranking.Click the rank badge to see the full State ranking.Click here to see the full State ranking.
Very walkable. Most errands can be accomplished on foot, and many essentials are within a short walk.

About this community

License Details

CMS Certification Number245271

Contact Providence Place

Inspection History

In Minnesota, the Department of Health, Health Regulation Division is the primary authority for conducting onsite inspections and reporting on the quality of care in residential facilities.

Since 2023 · 3 years of data 58 deficiencies

Inspection Scorecard Info This scorecard compares key inspection, citation, and complaint metrics at this facility against the Minnesota state average. Metrics rated ≥15% worse than average are highlighted in red; those ≥15% better are highlighted in green.

Since 2023 vs. Minnesota state average
Overall vs. MN average 2 Worse Metrics worse than Minnesota average:
• Total deficiencies (480% above)
• Deficiencies per year (485% above)
0 Better No metrics in this bucket.
Latest Inspection May 23, 2025 Other An inspection that falls outside standard annual surveys and formal complaint investigations. May include administrative compliance checks, documentation reviews, focused surveys on specific concerns, or revisit surveys to verify prior corrections.

Deficiencies Info Deficiencies are formal regulatory issues recorded during state inspections.

This FacilityMN Averagevs. MN Avg
Total deficiencies Info Formal regulatory issues recorded by inspectors across all inspection types. 5810 This facility has 480% more total deficiencies than a typical Minnesota nursing home (58 vs. MN avg 10).↑ 480% worse
Deficiencies per year Info Average deficiencies per year since 2023. 19.33.3 This facility has 485% more deficiencies per year than a typical Minnesota nursing home (19.3 vs. MN avg 3.3).↑ 485% worse

Inspection Reports Summary Info An editor-reviewed summary of the themes and findings across this facility's recent inspection reports.

  • May 23, 2025 inspection found one deficiency for failing to include speech therapy recommendations for safe eating and swallowing in a resident’s care plan.
  • February 27, 2025 routine survey identified nine deficiencies including immediate jeopardy from inaccurate advance directive documentation and failures in dignified dining, fall prevention, and infection control.
  • Multiple complaint investigations from October 2023 to April 2025 documented substantiated abuse, inadequate behavioral health plans, unsupervised residents leaving facility, and failure to provide ordered oxygen therapy causing harm.

Health Inspection History

Inspections since 2023
Total health inspections 12

Minnesota average 6


Last Health inspection on May 2025
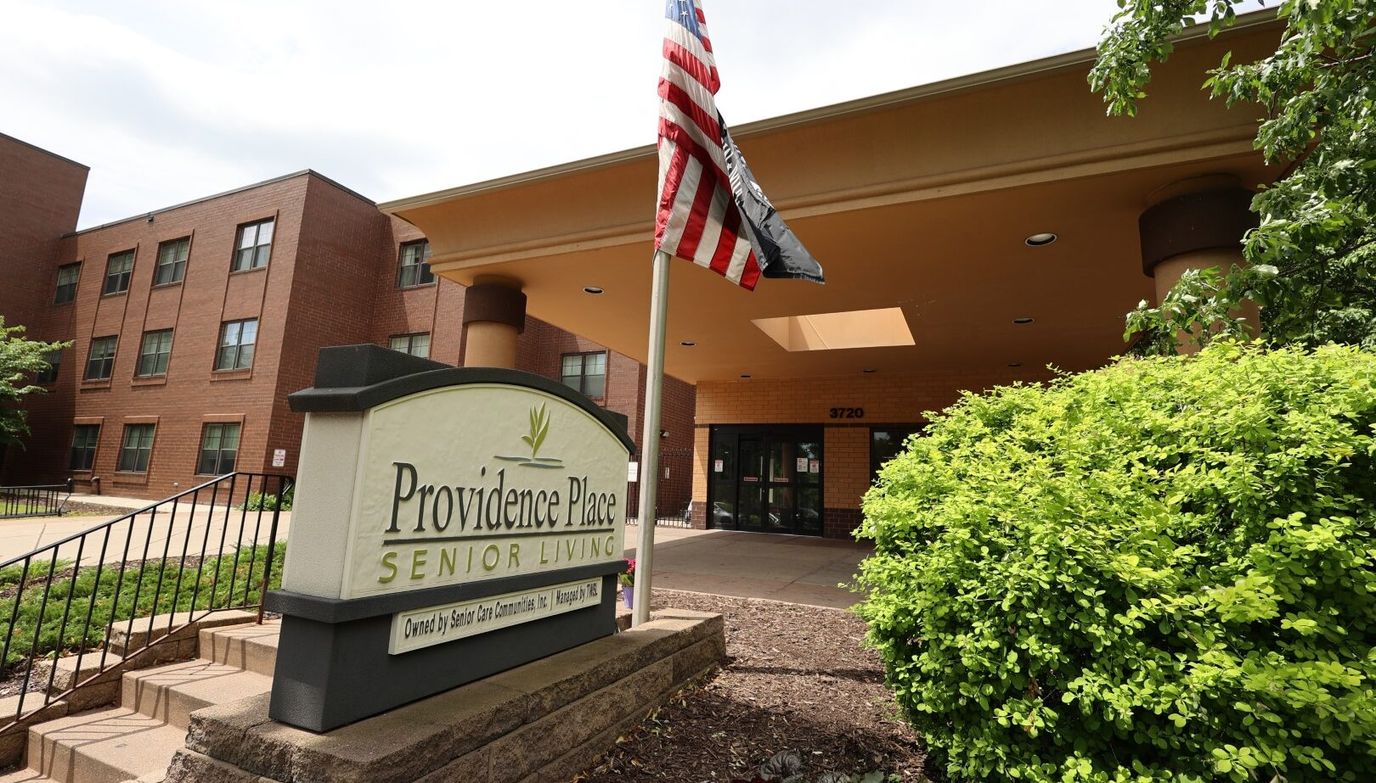
Total health citations
46 Rank #78 / 90Health citations — State benchmarkedThis home is ranked 78th out of 90 homes in Minnesota. Shows this facility's total health deficiency citations benchmarked to the Minnesota State average, with a ranking across all 90 MN facilities. Lower citation counts earn a better rank.Ranking totals vary by category as each rank only includes facilities that report data for that metric. Homes missing that data point aren't included in the ranking.Click the rank badge to see the full State ranking.Click here to see the full State ranking.

Minnesota average 23.2

Citations per inspection
3.83 Rank #45 / 90Citations per inspection — State benchmarkedThis home is ranked 45th out of 90 homes in Minnesota. Shows average deficiency citations per CMS inspection for this facility versus the Minnesota mean across 90 facilities with citation data. Lower is better.Ranking totals vary by category as each rank only includes facilities that report data for that metric. Homes missing that data point aren't included in the ranking.Click the rank badge to see the full State ranking.Click here to see the full State ranking.

Minnesota average 3.76


Health citations are formal notices following inspections when they fail to comply with safety and care standards.

27 of 46 citations resulted from standard inspections; 15 of 46 resulted from complaint investigations; and 4 of 46 came from combined inspections (standard and complaint).

Breakdown of citation severity (last 3 years)
Critical health citations
2
186% worse than Minnesota average

Minnesota average: 0.7


Serious health citations
2
300% worse than Minnesota average

Minnesota average: 0.5

2 critical citations Minnesota average: 0.7

2 serious citations Minnesota average: 0.5

39 moderate citations Minnesota average: 21.2

3 minor citations Minnesota average: 0.8
Citations history (last 3 years)
Care Planning moderate citation May 23, 2025
Corrected

Quality of Care moderate citation Apr 30, 2025
Corrected

Quality of Care critical citation Apr 14, 2025
Corrected

Infection Control moderate citation Feb 27, 2025
Corrected

Staffing Data

Reporting period: October 1 – December 31, 2025 (Q4 2025). Source: CMS Payroll-Based Journal report.

Total staff 65
Employees 43
Contractors 22
Staff to resident ratio 0.47 : 1
78% fewer staff per resident than Minnesota average
Minnesota average ratio: 2.19 : 1 Minnesota average ratio: 2.19 : 1See full Minnesota ranking
Avg staff/day 26
Average shift 8.9 hours
19% better than Minnesota average
Minnesota average: 7.5 hours Minnesota average shift: 7.5 hoursSee full Minnesota ranking
Total staff hours (quarter) 21,338

Nursing staff breakdown

Q4 2025 · Oct 1 – Dec 31 More info This data comes from the CMS Payroll-Based Journal report covering October 1 – December 31, 2025.
Registered Nurse

Manages medical care and health needs.

RN Staff Info All 20 RN Staff are full-time employees. No contractors work on this role. 20
Average shift length Info Average shift length. Calculated as total hours divided by days worked and average staff per day. 11 hours
Licensed Practical Nurse

Assists with medical care and medications.

LPN Staff Info All 1 LPN Staff are full-time employees. No contractors work on this role. 1
Average shift length Info Average shift length. Calculated as total hours divided by days worked and average staff per day. 9.7 hours
Certified Nursing Assistant

Helps with daily care and mobility.

CNA Staff Info 6 total: 5 full-time employees and 1 contractor. 6
Average shift length Info Average shift length. Calculated as total hours divided by days worked and average staff per day. 10 hours

Contractor staffing

Q4 2025 · Oct 1 – Dec 31 More info This data comes from the CMS Payroll-Based Journal report covering October 1 – December 31, 2025.

Total hours from contractors

15.7%

3,348 contractor hours this quarter

Respiratory Therapy Technician: 6 Physical Therapy Assistant: 5 Physical Therapy Aide: 4 Speech Language Pathologist: 3 Qualified Social Worker: 2 Certified Nursing Assistant: 1 Clinical Nurse Specialist: 1

Staff by category

Q4 2025 · Oct 1 – Dec 31 More info This data comes from the CMS Payroll-Based Journal report covering October 1 – December 31, 2025.
Registered Nurse200208,58692100%11
Other Dietary Services Staff7072,9918896%7.7
Certified Nursing Assistant5162,4539199%10
Clinical Nurse Specialist3141,7156470%7.9
Dental Services Staff4041,3286975%8.6
Speech Language Pathologist0337536470%6.6
Respiratory Therapy Technician0666636672%6.4
Licensed Practical Nurse1015435661%9.7
Qualified Social Worker0225006166%8
Physical Therapy Assistant0554686368%7.1
Administrator1014285762%7.5
Mental Health Service Worker1014285762%7.5
Physical Therapy Aide0444255863%7.2
Nurse Practitioner1016089%7.5
20 Registered Nurse
% of Days 100%
7 Other Dietary Services Staff
% of Days 96%
6 Certified Nursing Assistant
% of Days 99%
4 Clinical Nurse Specialist
% of Days 70%
4 Dental Services Staff
% of Days 75%
3 Speech Language Pathologist
% of Days 70%
6 Respiratory Therapy Technician
% of Days 72%
1 Licensed Practical Nurse
% of Days 61%
2 Qualified Social Worker
% of Days 66%
5 Physical Therapy Assistant
% of Days 68%
1 Administrator
% of Days 62%
1 Mental Health Service Worker
% of Days 62%
4 Physical Therapy Aide
% of Days 63%
1 Nurse Practitioner
% of Days 9%

Penalties and fines

Includes penalties issued in 2023-2025

Federal penalties imposed by CMS for regulatory violations, including civil money penalties (fines) and denials of payment for new Medicare/Medicaid admissions.

Source: CMS Penalties Database (Data as of Jan 2026)

Total fines amount $152K Rank #86 / 90Federal fines — State benchmarkedThis home is ranked 86th out of 90 homes in Minnesota. Shows this facility's cumulative CMS federal fine dollars versus the Minnesota average among facilities with fines, and where it ranks among 90 facilities in the pool. Lower total dollars mean a better rank.Ranking totals vary by category as each rank only includes facilities that report data for that metric. Homes missing that data point aren't included in the ranking.Click the rank badge to see the full State ranking.Click here to see the full State ranking.
241% higher than Minnesota average

Minnesota average: $44K

Number of fines 5
149% more fines than Minnesota average

Minnesota average: 2.0

Payment Denials Info Serious action where Medicare and/or Medicaid temporarily stops payments for new residents until issues are fixed. 0
100% fewer payment denials than Minnesota average

Minnesota average: 0.4

Fines amount comparison
This facility $152K
Minnesota average $44K
Penalty History

Penalties are imposed by CMS for violations of federal nursing home regulations.

4 penalties in the past 3 years

Multiple penalties were reported in the last 3 years.

Civil Money Penalty Info Fines imposed for noncompliance, which can be assessed per day or per instance of violation. Apr 14, 2025
$75K
Civil Money Penalty Info Fines imposed for noncompliance, which can be assessed per day or per instance of violation. Feb 27, 2025
$19K
Civil Money Penalty Info Fines imposed for noncompliance, which can be assessed per day or per instance of violation. Oct 2, 2023
$22K
Civil Money Penalty Info Fines imposed for noncompliance, which can be assessed per day or per instance of violation. Aug 3, 2023
$20K

Last updated: Jan 2026

Quality of care over time

These measures show how residents usually do over time at this home, based on health outcomes and preventive care.

High-risk clinical events score Info A composite score based on pressure ulcers, falls with injury, weight loss, walking ability decline, and activities of daily living decline. 8.2
27% better than Minnesota average

Minnesota average: 11.1

Functional decline score Info A composite score based on activities of daily living decline, walking ability decline, and incontinence. 17.7
22% better than Minnesota average

Minnesota average: 22.6

Long-stay resident measures
Average Minnesota avg: 2.6 Info CMS star rating based on long-stay quality measure performance. 5 stars = significantly above average, 1 star = significantly below average.
Need for Help with Daily Activities Increased Info Percent of long-stay residents whose need for help with daily activities has increased 14.0%
26% better than Minnesota average

Minnesota average: 18.9%

Walking Ability Worsened Info Percent of long-stay residents whose ability to move independently worsened 17.2%
28% better than Minnesota average

Minnesota average: 23.8%

Low Risk Residents with Bowel/Bladder Incontinence Info Percent of low risk long-stay residents who lose control of their bowels or bladder 21.8%
13% better than Minnesota average

Minnesota average: 25.0%

Falls with Major Injury Info Percent of long-stay residents experiencing one or more falls with major injury 3.5%
5% better than Minnesota average

Minnesota average: 3.7%

High Risk Residents with Pressure Ulcers Info Percent of long-stay high risk residents with pressure ulcers 3.0%
46% better than Minnesota average

Minnesota average: 5.4%

Urinary Tract Infection Info Percent of long-stay residents with a urinary tract infection 2.2%
18% better than Minnesota average

Minnesota average: 2.7%

Lost Too Much Weight Info Percent of long-stay residents who lose too much weight 3.1%
25% better than Minnesota average

Minnesota average: 4.1%

Depressive Symptoms Info Percent of long-stay residents who have depressive symptoms 2.4%
45% better than Minnesota average

Minnesota average: 4.4%

Antipsychotic Use Info Percent of long-stay residents who received an antipsychotic medication 14.7%
15% better than Minnesota average

Minnesota average: 17.2%

Pneumococcal Vaccine Info Percent of long-stay residents assessed and appropriately given the pneumococcal vaccine 97.6%
In line with Minnesota average

Minnesota average: 97.3%

Influenza Vaccine Info Percent of long-stay residents assessed and appropriately given the seasonal influenza vaccine 100.0%
In line with Minnesota average

Minnesota average: 96.0%

Hospitalizations per 1,000 days Info Number of hospitalizations per 1,000 long-stay resident days. 2.02
21% worse than Minnesota average

Minnesota average: 1.67

ED visits per 1,000 days Info Number of outpatient emergency department visits per 1,000 long-stay resident days. 2.12
7% worse than Minnesota average

Minnesota average: 1.99

Short-stay resident measures
Above average Minnesota avg: 3.1 Info CMS star rating based on short-stay quality measure performance. 5 stars = much above average, 1 star = much below average.
Pneumococcal Vaccine Info Percent of short-stay residents assessed and appropriately given the pneumococcal vaccine 75.1%
16% worse than Minnesota average

Minnesota average: 88.9%

Antipsychotic medication increase Info Percent of short-stay residents who newly received an antipsychotic medication 0.6%
67% better than Minnesota average

Minnesota average: 1.9%

Influenza Vaccine Info Percent of short-stay residents assessed and appropriately given the seasonal influenza vaccine 66.4%
20% worse than Minnesota average

Minnesota average: 82.6%

Re-hospitalized after SNF stay Info Percentage of short-stay residents who were re-hospitalized after their nursing home admission. 23.6%
In line with Minnesota average

Minnesota average: 23.1%

Emergency department visits Info Percentage of short-stay residents who had an outpatient emergency department visit. 12.3%
12% better than Minnesota average

Minnesota average: 14.0%

Falls with major injury Info Percentage of SNF residents who experience falls with major injury during their stay. 2.6%
232% worse than Minnesota average

Minnesota average: 0.8%

Ability to care for self at discharge Info Percentage of residents at or above expected ability to care for themselves at discharge. 51.6%
In line with Minnesota average

Minnesota average: 53.7%

Successful return to home or community Info Rate of successful return to home or community from a skilled nursing facility. 49.1%
In line with Minnesota average

Minnesota average: 50.6%

Breakdown by payment type

Medicare

22% of new residents, usually for short-term rehab.

Typical stay 1 - 2 months

Private pay

50% of new residents, often for short stays.

Typical stay 4 - 5 months

Medicaid

29% of new residents, often for long-term daily care.

Typical stay 2 years

Facility Characteristics

Source: CMS Long-Term Care Facility Characteristics (Data as of Jan 2026)

Total residents 138
Medicare
5
3.6% of residents
Medicaid
96
69.6% of residents
Private pay or other
37
26.8% of residents
Programs & Services
Residents Group

Residents meet regularly to discuss policies, care quality, and activities

Active Resident Council

Organized group of residents that meets regularly to discuss facility policies, quality of life, and activities.

Finances and operations

Based on CMS SNF Cost Report for fiscal year ending in 12/2023.

Governmental community
Operated by a subsidized facility district.
Net patient revenue Info Net patient revenue — what the home actually collects for resident care, after contractual allowances, bad debt and discounts are subtracted from its gross charges (CMS cost report, Worksheet G-3). It covers resident care only; money the home earns from other sources is shown separately as "Other income."
$19.4M
Net patient income Info Net patient income: net patient revenue minus the home's total operating expenses. A positive figure means it earns more from resident care than it spends to deliver it; a negative figure means the opposite. It excludes non-operating "other income."
$175.0K
Governmental community Operated by a subsidized facility district.
Net patient revenue Info Net patient revenue — what the home actually collects for resident care, after contractual allowances, bad debt and discounts are subtracted from its gross charges (CMS cost report, Worksheet G-3). It covers resident care only; money the home earns from other sources is shown separately as "Other income."
$19.4M Rank #25 / 89Revenue — State benchmarkedThis home is ranked 25th out of 89 homes in Minnesota. Shows this facility's annual revenue compared to the Minnesota average. Higher revenue generally means more resources for staffing and capital — read alongside Payroll %.Ranking totals vary by category as each rank only includes facilities that report data for that metric. Homes missing that data point aren't included in the ranking.Click the rank badge to see the full State ranking.Click here to see the full State ranking.
Net patient income Info Net patient income: net patient revenue minus the home's total operating expenses. A positive figure means it earns more from resident care than it spends to deliver it; a negative figure means the opposite. It excludes non-operating "other income."
$175.0K
Other income Info Money the home earns outside of resident care — such as investments, grants, rentals and other non-operating sources (CMS cost report, Worksheet G-3). It is tracked separately from net patient revenue: it is not part of that figure, and it is not included in net patient income.
$144.5K
Payroll costs Info Staff salaries plus wage-related costs — benefits such as payroll taxes, health insurance and retirement — from the home's own accounting records (CMS cost report, Worksheet A). Contract or agency labor is counted separately, under other operating costs. Rank #25 / 89Payroll — State benchmarkedThis home is ranked 25th out of 89 homes in Minnesota. Shows total annual staff payroll benchmarked to the Minnesota average. Higher payroll investment relative to peers often signals better staffing and less reliance on cheaper contract labor.Ranking totals vary by category as each rank only includes facilities that report data for that metric. Homes missing that data point aren't included in the ranking.Click the rank badge to see the full State ranking.Click here to see the full State ranking.
$9.6M 49.5% of net patient revenue Info Payroll as a share of revenue: staff salaries and wage-related benefits divided by net patient revenue. A higher figure means more of each revenue dollar goes to staff pay. Rank #70 / 89Payroll % — State benchmarkedThis home is ranked 70th out of 89 homes in Minnesota. Shows payroll as a percentage of revenue versus the Minnesota average. Well-run Minnesota facilities typically land around 61–68% — the top third Statewide. Below 25% may signal understaffing or heavy agency use — read with Staffing ratings.Ranking totals vary by category as each rank only includes facilities that report data for that metric. Homes missing that data point aren't included in the ranking.Click the rank badge to see the full State ranking.Click here to see the full State ranking.
Other operating costs Info Everything it costs to run the home apart from payroll — food, utilities, supplies, maintenance, contract labor and administration. Calculated as total operating expense minus payroll (staff salaries and wage-related benefits).
$9.6M
Total costs Info The home's total operating expense for the year — all the costs of running it, salaries included (CMS cost report, Worksheet G-3).
$19.3M

What does this home offer?

Building type icon
Building type icon

Building Type: 3-story

Who this home usually serves

TYPE OF STAY

Mostly long-term care residents

Most residents stay for extended periods and receive ongoing daily care.

Most new residents arrive under private pay (50% of admissions), and a typical private pay stay runs around 4 - 5 months.

Admissions
181 total

Coverage residents most often arrive under.

Medicare 22%
Private pay 50%
Medicaid 29%
Discharges
183 total

Coverage residents most often leave under.

Medicare 13%
Private pay 36%
Medicaid 51%

Managed by Galina Knop

Executive Director, Owner and Founder

30 years of experience

Galina Knop is the Executive Director, Owner, and Founder of Providence Place. She brings a deeply personal commitment to dementia care, shaped by her own experience as a family caregiver. Galina has dedicated nearly 30 years to providing individualized, compassionate care for elders with memory impairment, ensuring their needs and those of their families are met with respect and dignity.

Places of interest near Providence Place

Address 3.9 miles from city center Info Estimated distance in miles from Minneapolis's city center to Providence Place's address, calculated via Google Maps. — 1.65 miles to nearest hospital (Abbott Northwestern's Joint Replacement Center)

Calculate Travel Distance to Providence Place

Add your location

Address

Compare Nursing Home around Minneapolis

The information below is reported by the Minnesota Department of Health, Health Regulation Division.

5 facilities compared · CMS & MN Dept. of Health data

Redeemer Health Care Center
NH
HC
PC
RC
Minneapolis (Powderhorn)
119
Facility 119
MN AVG 61
Rank #78 / 532
93.9%
Facility 93.9%
MN AVG 79.7%
Rank #47 / 331
+18%
5.23
Facility 5.23
MN AVG 4.77
Rank #20 / 89
-28%+10%
$0
Facility $0
MN AVG $47.9k
Rank #1 / 90
25
Facility 25
MN AVG 23.2
Rank #45 / 90
5.0
Facility 5.0
MN AVG 3.8
Rank #67 / 90
-112-
95
Facility 95
MN AVG 43
Rank #3 / 632
Danny Colgan
$15.5M
Facility $15.5M
MN AVG $9.9M
Rank #31 / 89
$9.9M
Facility $9.9M
MN AVG $4.9M
Rank #21 / 89
63.5%
Facility 63.5%
MN AVG 50.7%
Rank #29 / 89
245520
Jones-Harrison Senior Living
NH
AL
MC
NC
Minneapolis (Calhoun Isles)
53
Facility 53
MN AVG 61
Rank #249 / 532
92.5%
Facility 92.5%
MN AVG 79.7%
Rank #59 / 331
+16%
5.11
Facility 5.11
MN AVG 4.77
Rank #26 / 89
+38%+7%
$0
Facility $0
MN AVG $47.9k
Rank #1 / 90
35
Facility 35
MN AVG 23.2
Rank #65 / 90
4.4
Facility 4.4
MN AVG 3.8
Rank #58 / 90
-49-
56
Facility 56
MN AVG 43
Rank #212 / 632
Marcia Diracles
$13.5M
Facility $13.5M
MN AVG $9.9M
Rank #26 / 89
$12.2M
Facility $12.2M
MN AVG $4.9M
Rank #15 / 89
90.4%
Facility 90.4%
MN AVG 50.7%
Rank #14 / 89
245460
The Villas at Bryn Mawr
NH
AL
Minneapolis (Harrison)
105
Facility 105
MN AVG 61
Rank #112 / 532
75.0%
Facility 75.0%
MN AVG 79.7%
Rank #188 / 331
-6%
3.73
Facility 3.73
MN AVG 4.77
Rank #81 / 89
-68%-22%
$35.3k
Facility $35.3k
MN AVG $47.9k
Rank #66 / 90
58
Facility 58
MN AVG 23.2
Rank #85 / 90
5.3
Facility 5.3
MN AVG 3.8
Rank #71 / 90
499-
55
Facility 55
MN AVG 43
Rank #217 / 632
-
$9.0M
Facility $9.0M
MN AVG $9.9M
Rank #59 / 89
$4.8M
Facility $4.8M
MN AVG $4.9M
Rank #52 / 89
53.8%
Facility 53.8%
MN AVG 50.7%
Rank #38 / 89
245203
Lakehouse Healthcare and Rehabilitation Center
NH
HC
MC
RC
Minneapolis (Southwest Minneapolis)
260
Facility 260
MN AVG 61
Rank #6 / 532
80.9%
Facility 80.9%
MN AVG 79.7%
Rank #139 / 331
+2%
3.91
Facility 3.91
MN AVG 4.77
Rank #69 / 89
-24%-18%
$0
Facility $0
MN AVG $47.9k
Rank #1 / 90
76
Facility 76
MN AVG 23.2
Rank #88 / 90
5.1
Facility 5.1
MN AVG 3.8
Rank #70 / 90
1224-
81
Facility 81
MN AVG 43
Rank #36 / 632
Lake Harriet Operator Holdings LLC
$20.0M
Facility $20.0M
MN AVG $9.9M
Rank #20 / 89
$10.7M
Facility $10.7M
MN AVG $4.9M
Rank #19 / 89
53.6%
Facility 53.6%
MN AVG 50.7%
Rank #62 / 89
245055
Providence Place
NH
HC
MC
Minneapolis (Standish)
190
Facility 190
MN AVG 61
Rank #12 / 532
81.6%
Facility 81.6%
MN AVG 79.7%
Rank #137 / 331
+2%
3.79
Facility 3.79
MN AVG 4.77
Rank #78 / 89
+117%-21%
$136.5k
Facility $136.5k
MN AVG $47.9k
Rank #86 / 90
46
Facility 46
MN AVG 23.2
Rank #78 / 90
3.8
Facility 3.8
MN AVG 3.8
Rank #45 / 90
4157-
72
Facility 72
MN AVG 43
Rank #102 / 632
Michael Brooks
$19.4M
Facility $19.4M
MN AVG $9.9M
Rank #25 / 89
$9.6M
Facility $9.6M
MN AVG $4.9M
Rank #25 / 89
49.5%
Facility 49.5%
MN AVG 50.7%
Rank #70 / 89
245271

Financial Assistance for
Nursing Home in Minnesota

Providence Place is located in Minneapolis, Minnesota.
Here are the financial assistance programs available to residents in Minnesota.

Get Financial aid guidance

Elderly Waiver

Minnesota Medicaid EW

Age 65+
General Minnesota resident, Medicaid-eligible, nursing home-level care need.
Income Limits (2025) ~$2,829/month 300% FBR, individual
Asset Limits $3,000 individual, higher than most states
MN

Higher asset limit; rural access focus.

Benefits
Personal care (5-7 hours/day) Respite (240 hours/year) Adult day care (~$70/day) Home aides

Essential Community Supports (ECS)

Minnesota ECS

Age 65+
General Minnesota resident, at risk of decline but not nursing home level.
Income Limits ~$1,732/month individual, varies
Asset Limits $3,000 individual
MN

Bridges gap for those ineligible for waivers.

Benefits
In-home support (2-4 hours/week) Respite (up to 5 days/year) Transportation (~5 trips/month)

Alternative Care (AC) Program

Minnesota Alternative Care Program

Age 65+
General Minnesota resident, NFLOC, not MA-eligible.
Income Limits (2025) ~$1,255-$2,829/month (100%-300% FPL); sliding scale copays.
Asset Limits $3,000 (individual); home equity limit $713,000.
MN

CDCS option; statewide via counties.

Benefits
Personal care (4-6 hours/day) Respite (~5 days/year) Home health Meals Home mods

Minnesota Senior Health Options (MSHO)

Minnesota Senior Health Options

Age 65+
General Minnesota resident, eligible for MA and Medicare Parts A/B.
Income Limits (2025) ~$1,255/month (100% FPL for MA); spenddown allowed.
Asset Limits $3,000 (individual), $6,000 (couple).
MN

7 health plans (e.g., UCare, HealthPartners); care coordinator assigned.

Benefits
Personal care (5-7 hours/day) Medical care Respite Adult day care Home mods $900/year groceries (some plans)

Minnesota Senior Care Plus (MSC+)

Minnesota Senior Care Plus

Age 65+
General Minnesota resident, MA-eligible, not on Medicare.
Income Limits (2025) ~$1,255/month (100% FPL); spenddown allowed.
Asset Limits $3,000 (individual), $6,000 (couple).
MN

Includes EW services; 7 health plans available.

Benefits
Personal care (5-7 hours/day) Respite Adult day care Home mods Limited nursing home care

Consumer Support Grant (CSG)

Minnesota Consumer Support Grant

Age 65+ or disabled
General Minnesota resident, eligible for MA personal care but opts for grant.
Income Limits (2025) ~$1,255/month (MA-eligible); spenddown allowed.
Asset Limits $3,000 individual
MN

Can hire family; statewide via counties.

Benefits
Cash (~$500-$1,500/month) for personal care Respite Home mods Assistive tech

Medicare Savings Program (MSP)

Minnesota Medicare Savings Program

Age 65+ or disabled
General Minnesota resident, Medicare Part A/B.
Income Limits (2025) ~$2,510/month (QMB), ~$3,380/month (SLMB), ~$3,598/month (QI)—individual.
Asset Limits $9,430 (individual), $14,130 (couple).
MN

Three tiers; no waitlist; includes Extra Help for Part D.

Benefits
Covers Part B premiums ($174.70/month) Deductibles ($240/year) Copays (~20%)

VA Aid and Attendance (A&A) and Housebound Benefits

Minnesota VA Aid and Attendance/Housebound

Age 65+ or disabled veteran/spouse
General Minnesota resident, wartime service, need for ADL help (A&A) or homebound.
Income Limits (2025) Net income < ~$1,984/month (veteran with dependent, A&A); pension offsets income.
Asset Limits ~$155,356 net worth limit
MN

High veteran demand in rural/urban areas.

Benefits
Cash (~$1,433-$2,642/month veteran, ~$951-$1,318 spouse) for care costs (e.g., in-home, assisted living)

Frequently Asked Questions about Providence Place

What neighborhood is Providence Place in?

Providence Place is in the Standish neighborhood of Minneapolis.

Is Providence Place in a walkable area?

Providence Place has a walk score of 72. Very walkable. Most errands can be accomplished on foot, and many essentials are within a short walk.

What is the occupancy rate at Providence Place?

Providence Place's occupancy is 78.6%.

Are there photos of Providence Place?

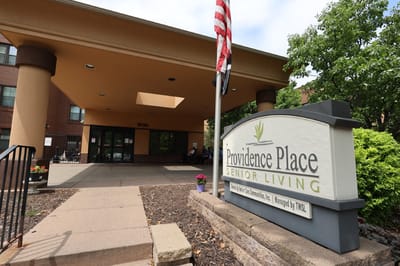
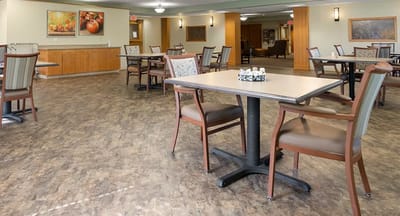
Yes — there are 5 photos of Providence Place in the photo gallery on this page.

What is the address of Providence Place?

Providence Place is located at 3720 23rd Ave S, Minneapolis, MN 55407, United States.

What is the phone number of Providence Place?

(612) 724-5495 will put you in contact with the team at Providence Place.

Is Providence Place Medicare or Medicaid certified?

Yes — Providence Place is a CMS-certified provider of Medicare and Medicaid.

Guides for Better Senior Living

Care Cost Calculator: See Prices in Your Area

Nursing Home Data Explorer

Don’t Wait Too Long: 7 Red Flag Signs Your Parent Needs Assisted Living Now

The True Cost of Assisted Living in 2025 – And How Families Are Paying For It

Understanding Senior Living Costs: Pricing Models, Discounts & Financial Assistance