Regency Retirement Village of Huntsville
Nursing Home, Assisted Living, Independent Living & Memory Care · Huntsville, AL
CMS overall rating Info CMS (the Centers for Medicare & Medicaid Services) is the federal agency that rates nursing home quality. Its Overall Rating runs from 1 to 5 stars, combining health inspections, staffing, and quality measures, with inspections weighted most heavily.

Regency Retirement Village of Huntsville

Nursing Home, Assisted Living, Independent Living & Memory Care · Huntsville, AL
CMS overall rating Info CMS (the Centers for Medicare & Medicaid Services) is the federal agency that rates nursing home quality. Its Overall Rating runs from 1 to 5 stars, combining health inspections, staffing, and quality measures, with inspections weighted most heavily.
Calculator: See prices in your area
Regency Retirement Village of Huntsville accepts Medicare, Medicaid, and private pay.

Overview of Regency Retirement Village of Huntsville

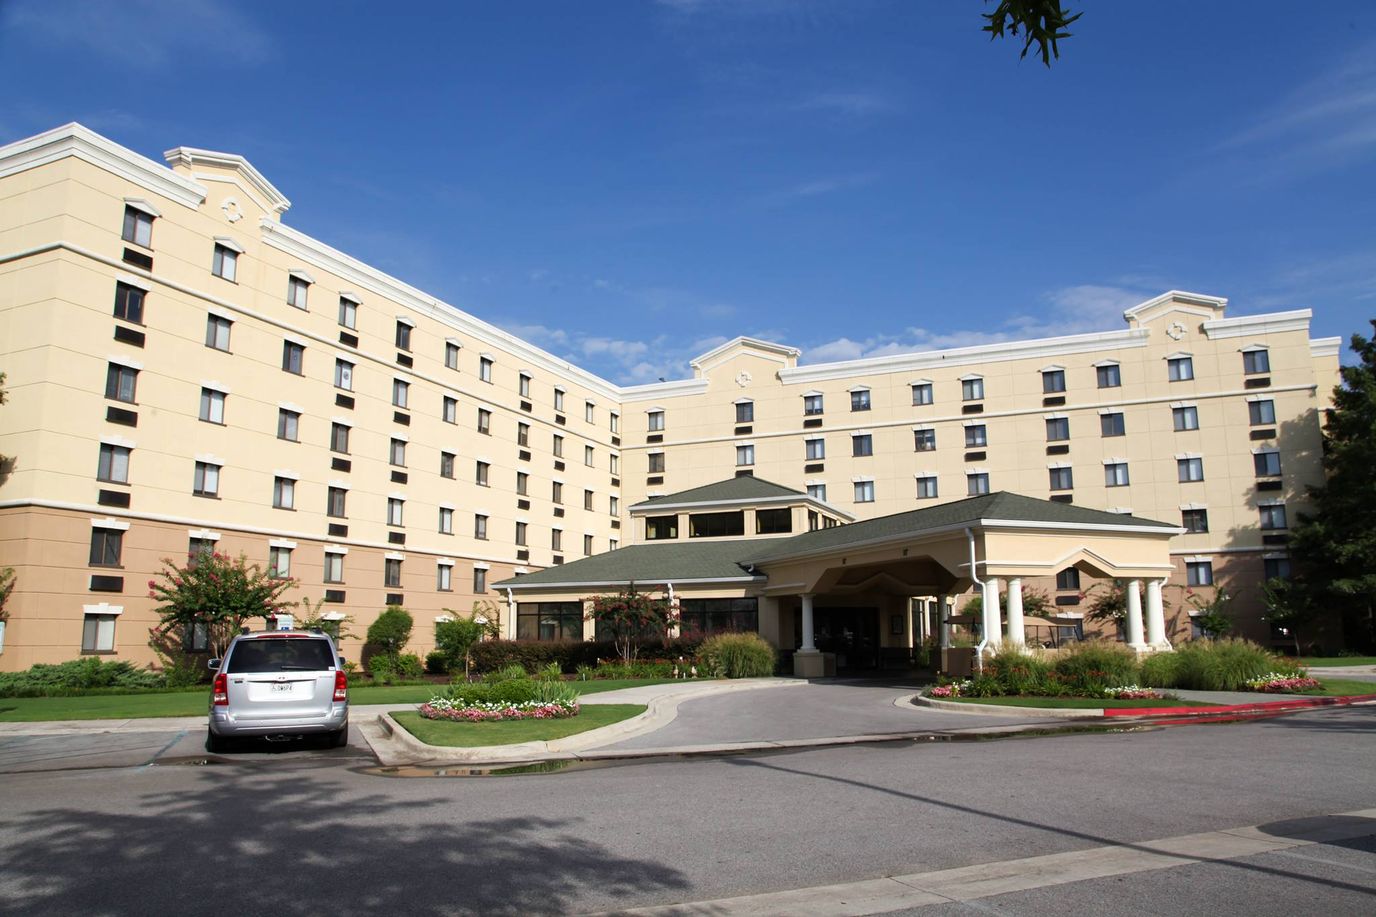
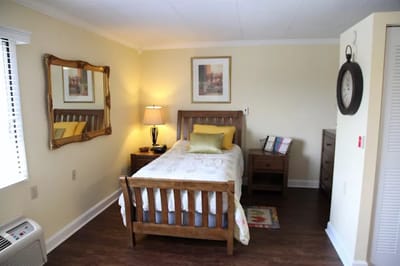
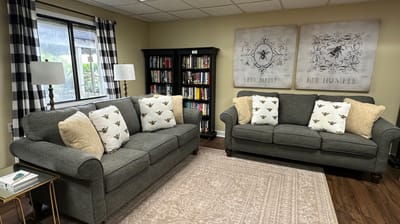
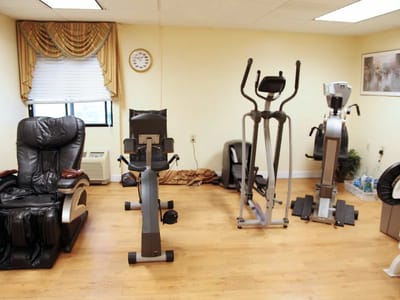
Regency Retirement Village of Huntsville is a senior home that offers a multitude of choices, ranging from assisted living to memory care services. Their exceptional caregivers, the backbone of their amazing service, ensure a supportive community and a secure environment for all residents. For those seeking personalized care and attention, memory care private homes are available within this remarkable facility. The building remains smoke-free, promoting a healthy and enjoyable living experience.

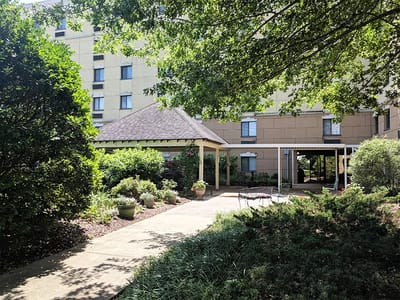
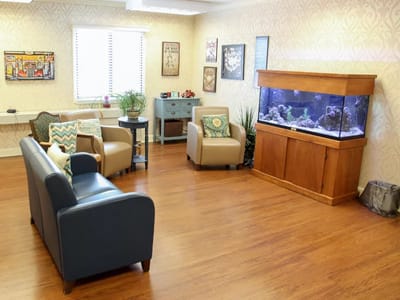
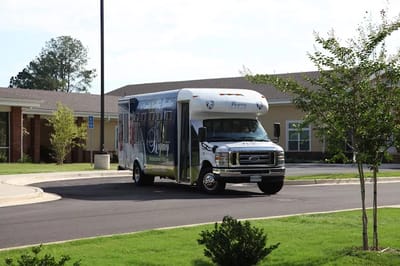
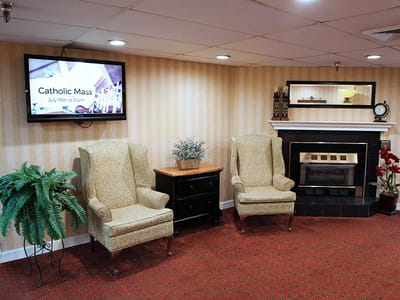
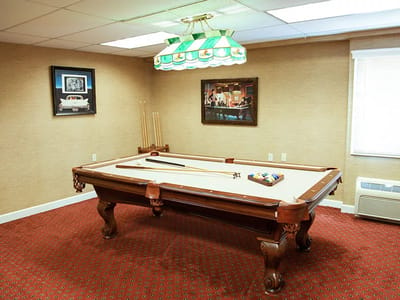
Alongside the 24-hour emergency response system, transportation services, and chef-prepared meals, this community also provides specialized memory care day programs, catering to the unique needs of individuals with memory-related challenges. Daily social activities and events also keep seniors engaged and connected, embracing the digital age while also enjoying outdoor relaxation areas. Most importantly, residents and their families can take comfort in knowing that Regency Retirement Village of Huntsville maintains stringent memory care qualifications to ensure the highest level of care and support.

Quality ratings

Measured by Centers for Medicare & Medicaid Services (CMS)

Overall rating Info The Overall CMS Rating combines results from health inspections, staffing levels and quality measures. Health inspections carry the most weight. Staffing and quality scores can increase or decrease the final rating based on performance compared to state and national standards.
Health Inspection Info Based on the results of the facility's three most recent standard inspections and any complaint investigations. CMS reviews the number, scope, and severity of deficiencies, with more recent findings weighted more heavily.
Staffing Info Measures average nursing staff hours per resident per day, including Registered Nurses (RNs) and total nursing staff. Ratings are adjusted based on the level of care residents require and are compared to state and national benchmarks.
Quality Measures Info Based on clinical and physical health indicators reported to CMS, such as hospital readmissions, falls, pressure ulcers, and improvements in mobility. These measures reflect how well residents' health needs are being managed.

Staffing hours breakdown

Info Daily nursing hours per resident by staff type, reported to CMS. Higher is generally better — compare this facility to state and national averages to see where staffing stands.

Hours per resident per day — compared to state averages

Total nursing care / resident Info Total adjusted nursing hours per resident per day, combining RN, LPN, and aide time. CMS adjusts this for case-mix so facilities can be fairly compared.
4h 29m per day
Rank #60 / 136Nurse hours — State benchmarkedThis home is ranked 60th out of 136 homes in Alabama. Shows adjusted nurse hours per resident per day benchmarked to the Alabama average, with a ranking across 136 Alabama facilities. More hours mean more direct care. The national average is about 3.5 hrs; below 3.0 is a red flag.Rankings are based only on facilities in Alabama that report data for that category. Facilities without available data are excluded from the ranking.Click the rank badge to see the full State ranking.Click here to see the full State ranking.
vs avg
Staff typeHours / Day / Residentvs state avg
Registered Nurse (RN) Info RNs hold the highest nursing license and can assess residents, interpret test results, and direct care plans. More RN hours per day often signals stronger clinical oversight and faster response to health changes. 33m per day
LPN / LVN Info Licensed Practical Nurses (LPNs) or Licensed Vocational Nurses (LVNs) deliver routine hands-on care — medication administration, wound dressing, and monitoring vital signs. They work under RN supervision and make up a large share of daily bedside care. 1h 13m per day
Nurse Aide Info Certified Nurse Aides (CNAs) provide the most direct day-to-day assistance: bathing, dressing, feeding, and mobility. Nurse aide hours are typically the largest staffing category and directly affect residents' quality of life. 2h 37m per day
Weekend Total Nursing Info Combined nursing hours (RN + LPN + Nurse Aide) per resident per day on weekends. Staffing often drops on weekends — this figure reveals whether the facility maintains adequate coverage outside of weekday hours. 3h 27m per day
Physical Therapist Info Hours per resident per day provided by licensed Physical Therapists (PTs) or PT Assistants. PT services help residents recover mobility after injury or illness and are especially important for post-acute (short-stay) rehabilitation. 4m per day
Weekend RN Info Registered nurse hours specifically on weekends. Facilities sometimes reduce RN presence on Saturdays and Sundays — a low weekend RN figure compared to weekday hours can indicate reduced clinical oversight when most administrative staff are absent. 19m per day

Capacity and availability

Avg. Length of Stay
46 days
Bed community size
104-bed community Rank #80 / 245Bed count — State benchmarkedThis home is ranked 80th out of 245 homes in Alabama. Shows this facility's certified or reported bed count compared to other Alabama facilities. Larger communities may offer more amenities, programs, and on-site services for residents and families.Rankings are based only on facilities in Alabama that report data for that category. Facilities without available data are excluded from the ranking.Click the rank badge to see the full State ranking.Click here to see the full State ranking.
A larger shared setting that may offer more common spaces and organized community services.
Years in operation
36 years in operation
A longer operating history, which may indicate experience navigating regulations and delivering ongoing care.
Walk Score
Walk Score: 44 / 100 Rank #170 / 418Walk Score — State benchmarkedThis home is ranked 170th out of 418 homes in Alabama. Shows how walkable this facility's neighborhood is compared to the average Walk Score across Alabama facilities. Higher scores benefit residents, families, and staff.Rankings are based only on facilities in Alabama that report data for that category. Facilities without available data are excluded from the ranking.Click the rank badge to see the full State ranking.Click here to see the full State ranking.
Somewhat walkable. A few nearby services may be reachable on foot, but most trips require transportation.

About this community

Occupancy

Occupancy rate
94%
Rank #18 / 138Occupancy rate — State benchmarkedThis home is ranked 18th out of 138 homes in Alabama. Shows this facility's occupancy rate versus the Alabama average, with its Statewide rank out of 138. Higher occupancy signals strong local demand and financial stability.Rankings are based only on facilities in Alabama that report data for that category. Facilities without available data are excluded from the ranking.Click the rank badge to see the full State ranking.Click here to see the full State ranking.
Higher than the Alabama average: 80.8%
Occupied beds
98 / 104
Average occupied beds in Alabama homes 97 beds

License Details

Facility TypeAssisted Living Facility (specialty Care)
StatusRegular
CountyMadison
Business TypeCorporation

Ownership & Operating Entity

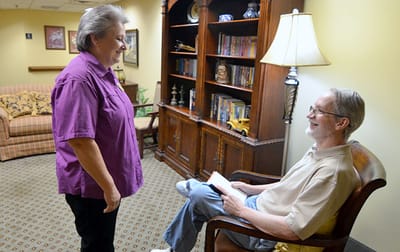
Regency Retirement Village of Huntsville is administered by Vicki Nesmith.

Type Of Units

Special Care
104 units
Total beds
104 units

Staffing

Key information about the people who lead and staff this community.

Leadership

ContactMs. Kay Pringle, Executive Director

Therapy & Rehabilitation

3 services
Rehabilitation Services
Respite Care
Short-Term Rehab

Staffing & Medical

1 service
24-Hour Staffing

Additional Services

1 service
Skilled Nursing & Rehab

Amenities & Lifestyle

Specific ProgramsShort-Term Stays, Financial Assistance, Move-in info, Employee Program

Pricing & Financial Information

Starting Price$1,995 per month

Contact Regency Retirement Village of Huntsville

Inspection History

In Alabama, the Department of Public Health, Bureau of Health Provider Standards conducts unannounced surveys to ensure facilities meet state licensing and federal certification safety standards.

Since 2018 · 8 years of data 50 deficiencies

Inspection Scorecard Info This scorecard compares key inspection, deficiency, and complaint metrics at this facility against the Alabama state average. Metrics rated ≥15% worse than average are highlighted in red; those ≥15% better are highlighted in green.

Since 2018 vs. Alabama state average
Overall vs. AL average 2 Worse Metrics worse than Alabama average:
• Total deficiencies (194% above)
• Deficiencies per year (200% above)
0 Better No metrics in this bucket.
Latest Inspection August 21, 2024 Complaint Investigation

Deficiencies Info Deficiencies are formal regulatory issues recorded during state inspections.

This FacilityAL Averagevs. AL Avg
Total deficiencies Info Formal regulatory issues recorded by inspectors across all inspection types. 5017 This facility has 194% more total deficiencies than a typical Alabama assisted living residence (50 vs. AL avg 17).↑ 194% worse
Deficiencies per year Info Average deficiencies per year since 2018. 6.32.1 This facility has 200% more deficiencies per year than a typical Alabama assisted living residence (6.3 vs. AL avg 2.1).↑ 200% worse

Inspection Reports Summary Info An editor-reviewed summary of the themes and findings across this facility's recent inspection reports.

  • August 21, 2024 complaint investigation found 13 deficiencies including delayed treatment of urinary tract infection causing hospitalization and death, medication errors, infection control breaches, and poor care planning.
  • Immediate jeopardy was identified for delayed UTI treatment for Resident #180 but was removed after corrective actions during the August 21, 2024 investigation.
  • The facility’s August 29, 2019 annual inspection found only 3 deficiencies related to resident dignity, MDS accuracy, and expired medication removal, with no harm-level citations.

Health Inspection History

Inspections since 2018
Total health inspections 4

State average N/A


Last Health inspection on Aug 2024

Total health citations
20 Rank #122 / 136Health citations — State benchmarkedThis home is ranked 122nd out of 136 homes in Alabama. Shows this facility's total health deficiency citations benchmarked to the Alabama State average, with a ranking across all 136 AL facilities. Lower citation counts earn a better rank.Rankings are based only on facilities in Alabama that report data for that category. Facilities without available data are excluded from the ranking.Click the rank badge to see the full State ranking.Click here to see the full State ranking.

State average N/A

Citations per inspection
5 Rank #109 / 136Citations per inspection — State benchmarkedThis home is ranked 109th out of 136 homes in Alabama. Shows average deficiency citations per CMS inspection for this facility versus the Alabama mean across 136 facilities with citation data. Lower is better.Rankings are based only on facilities in Alabama that report data for that category. Facilities without available data are excluded from the ranking.Click the rank badge to see the full State ranking.Click here to see the full State ranking.

State average N/A


Health citations are formal notices following inspections when they fail to comply with safety and care standards.

4 of 20 citations resulted from standard inspections; 2 of 20 resulted from complaint investigations; and 14 of 20 came from combined inspections (standard and complaint).

Breakdown of citation severity (last 8 years)
Critical health citations
2
In line with State average

State average: N/A


Serious health citations
1
In line with State average

State average: N/A

2 critical citations State average: N/A

1 serious citation State average: N/A

17 moderate citations State average: N/A

0 minor citations State average: N/A
Citations history (last 8 years)
Administration critical citation Aug 21, 2024
Corrected

Infection Control moderate citation Aug 21, 2024
Corrected

Pharmacy serious citation Aug 21, 2024
Corrected

Quality of Care moderate citation Aug 21, 2024
Corrected

Staffing Data

Reporting period: October 1 – December 31, 2025 (Q4 2025). Source: CMS Payroll-Based Journal report.

Total staff 157
Employees 111
Contractors 46
Staff to resident ratio 1.78 : 1
0% compared with State average

State average ratio: 0 : 0

Avg staff/day 54
Average shift 8.4 hours
0% compared with State average

State average: 0 hours

Total staff hours (quarter) 41,737

Nursing staff breakdown

Q4 2025 · Oct 1 – Dec 31 More info This data comes from the CMS Payroll-Based Journal report covering October 1 – December 31, 2025.
Registered Nurse

Manages medical care and health needs.

RN Staff Info All 14 RN Staff are full-time employees. No contractors work on this role. 14
Average shift length Info Average shift length. Calculated as total hours divided by days worked and average staff per day. 8.6 hours
Licensed Practical Nurse

Assists with medical care and medications.

LPN Staff Info All 26 LPN Staff are full-time employees. No contractors work on this role. 26
Average shift length Info Average shift length. Calculated as total hours divided by days worked and average staff per day. 9.2 hours
Certified Nursing Assistant

Helps with daily care and mobility.

CNA Staff Info All 61 CNA Staff are full-time employees. No contractors work on this role. 61
Average shift length Info Average shift length. Calculated as total hours divided by days worked and average staff per day. 8.6 hours

Contractor staffing

Q4 2025 · Oct 1 – Dec 31 More info This data comes from the CMS Payroll-Based Journal report covering October 1 – December 31, 2025.

Total hours from contractors

11.4%

4,774 contractor hours this quarter

Speech Language Pathologist: 12 Qualified Social Worker: 12 Physical Therapy Aide: 9 Physical Therapy Assistant: 7 Respiratory Therapy Technician: 4 Occupational Therapy Assistant: 1 Medical Director: 1

Staff by category

Q4 2025 · Oct 1 – Dec 31 More info This data comes from the CMS Payroll-Based Journal report covering October 1 – December 31, 2025.
Certified Nursing Assistant6106120,53592100%8.6
Licensed Practical Nurse260268,51992100%9.2
Registered Nurse140143,66692100%8.6
Speech Language Pathologist012121,8288390%6.4
Physical Therapy Aide0991,3767177%7
RN Director of Nursing2021,0507177%8.1
Qualified Social Worker012126327379%6.3
Other Dietary Services Staff1015256470%8.2
Dietitian1015156470%8
Administrator1015126470%8
Dental Services Staff1014886166%8
Respiratory Therapy Technician0444727379%6.4
Nurse Practitioner1014605863%7.9
Physical Therapy Assistant0774597177%6.3
Occupational Therapy Aide1014555863%7.8
Clinical Nurse Specialist2022403033%8
Occupational Therapy Assistant011633%2
Medical Director011111%1
61 Certified Nursing Assistant
% of Days 100%
26 Licensed Practical Nurse
% of Days 100%
14 Registered Nurse
% of Days 100%
12 Speech Language Pathologist
% of Days 90%
9 Physical Therapy Aide
% of Days 77%
2 RN Director of Nursing
% of Days 77%
12 Qualified Social Worker
% of Days 79%
1 Other Dietary Services Staff
% of Days 70%
1 Dietitian
% of Days 70%
1 Administrator
% of Days 70%
1 Dental Services Staff
% of Days 66%
4 Respiratory Therapy Technician
% of Days 79%
1 Nurse Practitioner
% of Days 63%
7 Physical Therapy Assistant
% of Days 77%
1 Occupational Therapy Aide
% of Days 63%
2 Clinical Nurse Specialist
% of Days 33%
1 Occupational Therapy Assistant
% of Days 3%
1 Medical Director
% of Days 1%

Penalties and fines

Includes penalties issued in 2024

Federal penalties imposed by CMS for regulatory violations, including civil money penalties (fines) and denials of payment for new Medicare/Medicaid admissions.

Source: CMS Penalties Database (Data as of Jan 2026)

Total fines amount $17K Rank #115 / 137Federal fines — State benchmarkedThis home is ranked 115th out of 137 homes in Alabama. Shows this facility's cumulative CMS federal fine dollars versus the Alabama average among facilities with fines, and where it ranks among 137 facilities in the pool. Lower total dollars mean a better rank.Rankings are based only on facilities in Alabama that report data for that category. Facilities without available data are excluded from the ranking.Click the rank badge to see the full State ranking.Click here to see the full State ranking.
74% lower than State average

State average: $65K

Number of fines 2
15% fewer fines than State average

State average: 2.4

Payment Denials Info Serious action where Medicare and/or Medicaid temporarily stops payments for new residents until issues are fixed. 1
194% more payment denials than State average

State average: 0.3

Fines amount comparison
This facility $17K
State average $65K
Penalty History

Penalties are imposed by CMS for violations of federal nursing home regulations.

3 penalties in the past 3 years

Multiple penalties were reported in the last 3 years.

Civil Money Penalty Info Fines imposed for noncompliance, which can be assessed per day or per instance of violation. Aug 21, 2024
$7K
Civil Money Penalty Info Fines imposed for noncompliance, which can be assessed per day or per instance of violation. Aug 21, 2024
$10K
Payment Denial Info Serious action where Medicare and/or Medicaid temporarily stops payments for new residents until issues are fixed. Aug 21, 2024
4 days

Last updated: Jan 2026

Quality of care over time

These measures show how residents usually do over time at this home, based on health outcomes and preventive care.

High-risk clinical events score Info A composite score based on pressure ulcers, falls with injury, weight loss, walking ability decline, and activities of daily living decline. 5.8
35% better than State average

State average: 8.9

Functional decline score Info A composite score based on activities of daily living decline, walking ability decline, and incontinence. 15.4
6% worse than State average

State average: 14.5

Long-stay resident measures
Need for Help with Daily Activities Increased Info Percent of long-stay residents whose need for help with daily activities has increased 10.9%
21% better than State average

State average: 13.9%

Walking Ability Worsened Info Percent of long-stay residents whose ability to move independently worsened 11.2%
31% better than State average

State average: 16.1%

Low Risk Residents with Bowel/Bladder Incontinence Info Percent of low risk long-stay residents who lose control of their bowels or bladder 24.0%
76% worse than State average

State average: 13.6%

Falls with Major Injury Info Percent of long-stay residents experiencing one or more falls with major injury 2.1%
39% better than State average

State average: 3.4%

High Risk Residents with Pressure Ulcers Info Percent of long-stay high risk residents with pressure ulcers 4.2%
29% better than State average

State average: 5.9%

Urinary Tract Infection Info Percent of long-stay residents with a urinary tract infection 4.7%
74% worse than State average

State average: 2.7%

Lost Too Much Weight Info Percent of long-stay residents who lose too much weight 0.8%
86% better than State average

State average: 5.4%

Depressive Symptoms Info Percent of long-stay residents who have depressive symptoms 1.2%
5% better than State average

State average: 1.2%

Antipsychotic Use Info Percent of long-stay residents who received an antipsychotic medication 18.1%
12% better than State average

State average: 20.7%

Pneumococcal Vaccine Info Percent of long-stay residents assessed and appropriately given the pneumococcal vaccine 7.8%
92% worse than State average

State average: 91.5%

Influenza Vaccine Info Percent of long-stay residents assessed and appropriately given the seasonal influenza vaccine 73.5%
22% worse than State average

State average: 94.8%

Short-stay resident measures
Pneumococcal Vaccine Info Percent of short-stay residents assessed and appropriately given the pneumococcal vaccine 25.2%
70% worse than State average

State average: 83.7%

Antipsychotic medication increase Info Percent of short-stay residents who newly received an antipsychotic medication 1.0%
53% better than State average

State average: 2.1%

Influenza Vaccine Info Percent of short-stay residents assessed and appropriately given the seasonal influenza vaccine 49.0%
39% worse than State average

State average: 80.3%

Breakdown by payment type

Medicare

64% of new residents, usually for short-term rehab.

Typical stay 21 days

Private pay

36% of new residents, often for short stays.

Typical stay 1 - 2 months

Medicaid

1% of new residents, often for long-term daily care.

Typical stay 3 - 4 years

Facility Characteristics

Source: CMS Long-Term Care Facility Characteristics (Data as of Jan 2026)

Total residents 88
Medicare
28
31.8% of residents
Medicaid
23
26.1% of residents
Private pay or other
37
42% of residents
Programs & Services
Residents Group

Residents meet regularly to discuss policies, care quality, and activities

Nurse Aide Training

State-approved Nurse Aide Training and Competency Evaluation Program on-site

Active Resident Council

Organized group of residents that meets regularly to discuss facility policies, quality of life, and activities.

Finances and operations

Based on CMS SNF Cost Report for fiscal year ending in 12/2023.

For-profit
Corporation
Net patient revenue Info Net patient revenue — what the home actually collects for resident care, after contractual allowances, bad debt and discounts are subtracted from its gross charges (CMS cost report, Worksheet G-3). It covers resident care only; money the home earns from other sources is shown separately as "Other income."
$19.3M
Net patient income Info Net patient income: net patient revenue minus the home's total operating expenses. A positive figure means it earns more from resident care than it spends to deliver it; a negative figure means the opposite. It excludes non-operating "other income."
-$1.6M
For-profit Corporation
Net patient revenue Info Net patient revenue — what the home actually collects for resident care, after contractual allowances, bad debt and discounts are subtracted from its gross charges (CMS cost report, Worksheet G-3). It covers resident care only; money the home earns from other sources is shown separately as "Other income."
$19.3M Rank #8 / 135Revenue — State benchmarkedThis home is ranked 8th out of 135 homes in Alabama. Shows this facility's annual revenue compared to the Alabama average. Higher revenue generally means more resources for staffing and capital — read alongside Payroll %.Rankings are based only on facilities in Alabama that report data for that category. Facilities without available data are excluded from the ranking.Click the rank badge to see the full State ranking.Click here to see the full State ranking.
Net patient income Info Net patient income: net patient revenue minus the home's total operating expenses. A positive figure means it earns more from resident care than it spends to deliver it; a negative figure means the opposite. It excludes non-operating "other income."
-$1.6M
Other income Info Money the home earns outside of resident care — such as investments, grants, rentals and other non-operating sources (CMS cost report, Worksheet G-3). It is tracked separately from net patient revenue: it is not part of that figure, and it is not included in net patient income.
$719.2K
Payroll costs Info Staff salaries plus wage-related costs — benefits such as payroll taxes, health insurance and retirement — from the home's own accounting records (CMS cost report, Worksheet A). Contract or agency labor is counted separately, under other operating costs. Rank #9 / 135Payroll — State benchmarkedThis home is ranked 9th out of 135 homes in Alabama. Shows total annual staff payroll benchmarked to the Alabama average. Higher payroll investment relative to peers often signals better staffing and less reliance on cheaper contract labor.Rankings are based only on facilities in Alabama that report data for that category. Facilities without available data are excluded from the ranking.Click the rank badge to see the full State ranking.Click here to see the full State ranking.
$9.1M 47% of net patient revenue Info Payroll as a share of revenue: staff salaries and wage-related benefits divided by net patient revenue. A higher figure means more of each revenue dollar goes to staff pay. Rank #73 / 133Payroll % — State benchmarkedThis home is ranked 73rd out of 133 homes in Alabama. Shows payroll as a percentage of revenue versus the Alabama average. Well-run Alabama facilities typically land around 54–69% — the top third Statewide. Below 25% may signal understaffing or heavy agency use — read with Staffing ratings.Rankings are based only on facilities in Alabama that report data for that category. Facilities without available data are excluded from the ranking.Click the rank badge to see the full State ranking.Click here to see the full State ranking.
Other operating costs Info Everything it costs to run the home apart from payroll — food, utilities, supplies, maintenance, contract labor and administration. Calculated as total operating expense minus payroll (staff salaries and wage-related benefits).
$11.8M
Total costs Info The home's total operating expense for the year — all the costs of running it, salaries included (CMS cost report, Worksheet G-3).
$20.9M

What does this home offer?

Pets allowed icon
Pets allowed icon

Pets Allowed

Building type icon
Building type icon

Building Type: Mid-rise

Who this home usually serves

TYPE OF STAY

Mostly short-term rehab stays

Most residents typically stay for a few weeks or months before returning home or moving on.

Most new residents arrive under Medicare (64% of admissions), and a typical Medicare stay runs around 21 days.

Admissions
678 total

Coverage residents most often arrive under.

Medicare 64%
Private pay 36%
Medicaid 1%
Discharges
673 total

Coverage residents most often leave under.

Medicare 54%
Private pay 44%
Medicaid 2%

Places of interest near Regency Retirement Village of Huntsville

Address 2.1 miles from city center Info Estimated distance in miles from Huntsville's city center to Regency Retirement Village of Huntsville's address, calculated via Google Maps.

Calculate Travel Distance to Regency Retirement Village of Huntsville

Add your location

Address

Compare Nursing Homes around the area

The information below is reported by the Alabama Department of Public Health, Bureau of Health Provider Standards.

Regency Retirement Village of Huntsville
NH
AL
IL
MC
Huntsville (Greenhill) -104 - 44 -
Kirkwood By the River
NH
AL
IL
MC
Birmingham (Overton) -46 A+ 0 Studio / 1 Bed / 2 Bed
Athens Health and Rehabilitation, LLC
NH
PC
Athens -149 A+ 0 -
Ahepa 3 Senior Apartments
NH
IL
Hoover -101 - 26 1 Bed
Keller Landing
NH
MC
Tuscumbia (South Sheffield) -109 - 48 Private / Semi-Private Rooms

Frequently Asked Questions about Regency Retirement Village of Huntsville

What neighborhood is Regency Retirement Village of Huntsville in?

Regency Retirement Village of Huntsville is in the Greenhill neighborhood of Huntsville.

Is Regency Retirement Village of Huntsville in a walkable area?

Regency Retirement Village of Huntsville has a walk score of 44. Somewhat walkable. A few nearby services may be reachable on foot, but most trips require transportation.

What is the occupancy rate at Regency Retirement Village of Huntsville?

Regency Retirement Village of Huntsville's occupancy is 94%.

Does Regency Retirement Village of Huntsville operate as a for-profit or non-profit?

Regency Retirement Village of Huntsville is registered as a for-profit in AL.

Who is the administrator of Regency Retirement Village of Huntsville?

Vicki NeSmith is the administrator of Regency Retirement Village of Huntsville.

How many beds does Regency Retirement Village of Huntsville have?

Regency Retirement Village of Huntsville has 104 beds.

Are there photos of Regency Retirement Village of Huntsville?

Yes — there are 14 photos of Regency Retirement Village of Huntsville in the photo gallery on this page.

Guides for Better Senior Living

Care Cost Calculator: See Prices in Your Area

Nursing Home Data Explorer

Don’t Wait Too Long: 7 Red Flag Signs Your Parent Needs Assisted Living Now

The True Cost of Assisted Living in 2025 – And How Families Are Paying For It

Understanding Senior Living Costs: Pricing Models, Discounts & Financial Assistance