Rest Haven Nursing Home
Nursing Home, Assisted Living, Home Care, Hospice Care, Nursing Care & Respite Care · Mcdermott, OH
CMS overall rating Info CMS (the Centers for Medicare & Medicaid Services) is the federal agency that rates nursing home quality. Its Overall Rating runs from 1 to 5 stars, combining health inspections, staffing, and quality measures, with inspections weighted most heavily.

Rest Haven Nursing Home

Nursing Home, Assisted Living, Home Care, Hospice Care, Nursing Care & Respite Care · Mcdermott, OH
CMS overall rating Info CMS (the Centers for Medicare & Medicaid Services) is the federal agency that rates nursing home quality. Its Overall Rating runs from 1 to 5 stars, combining health inspections, staffing, and quality measures, with inspections weighted most heavily.
Calculator: See prices in your area
Rest Haven Nursing Home accepts Medicare, Medicaid, and private pay.

Overview of Rest Haven Nursing Home

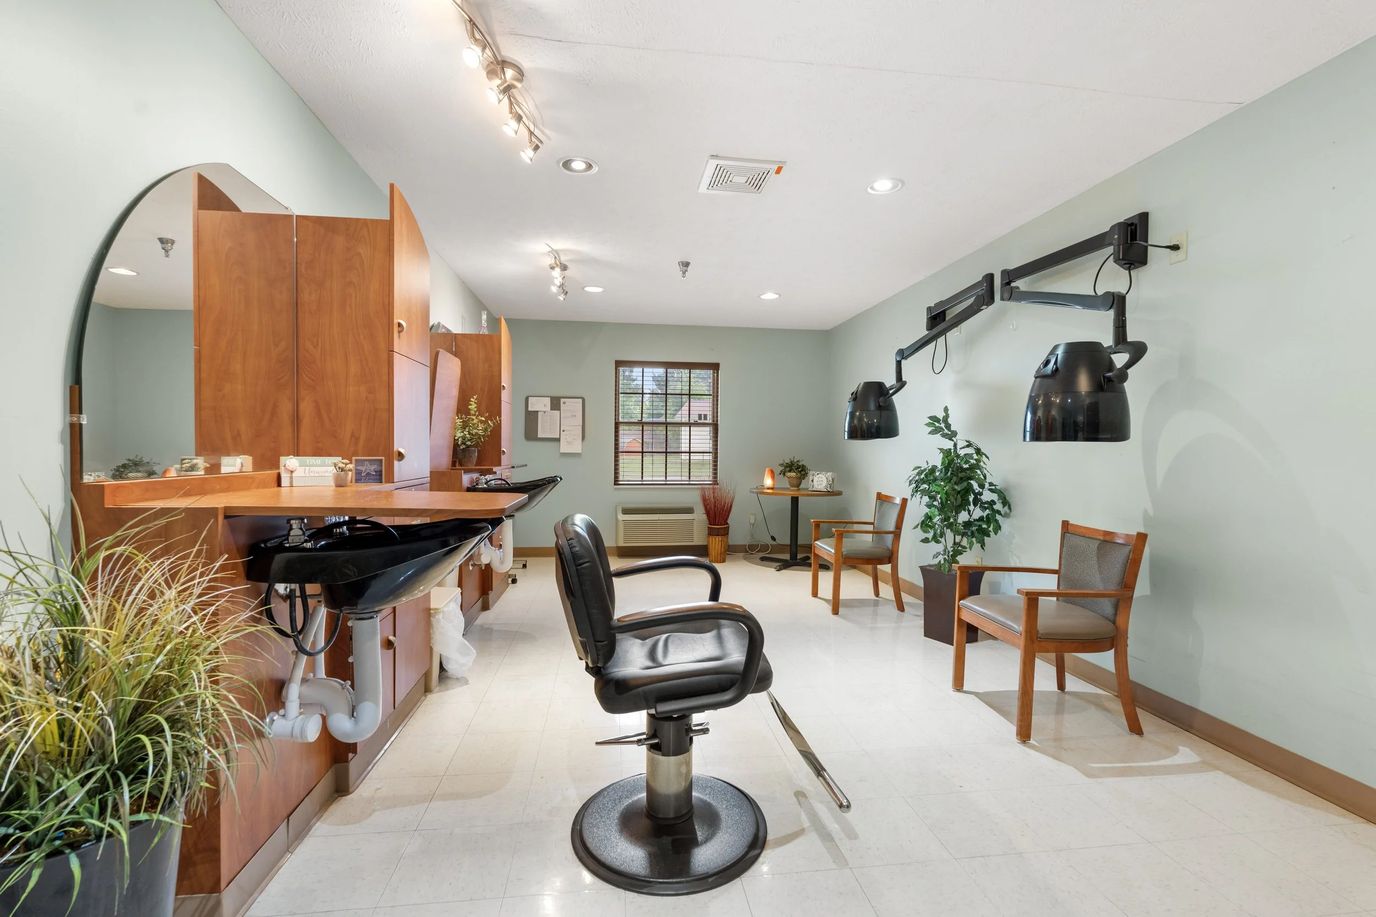
Rest Haven Nursing Home is a dedicated nursing home in McDermott, OH, that offers rehabilitation and skilled nursing. With its intimate and supportive setting, residents receive the utmost attention and care for their healthcare needs. Medicare and Medicaid are also accepted to ease challenges in residents’ later years.

Themed events, recreational activities, and light exercises are conducted to keep residents active and ensure their holistic wellness. Physical, occupational, and speech therapy also helps residents recover and return to their routines with ease. The community’s comprehensive care options and state-of-the-art amenities create the ideal setting where residents can live comfortably.

Quality ratings

Measured by Centers for Medicare & Medicaid Services (CMS)

Overall rating Info The Overall CMS Rating combines results from health inspections, staffing levels and quality measures. Health inspections carry the most weight. Staffing and quality scores can increase or decrease the final rating based on performance compared to state and national standards.
Health Inspection Info Based on the results of the facility's three most recent standard inspections and any complaint investigations. CMS reviews the number, scope, and severity of deficiencies, with more recent findings weighted more heavily.
Staffing Info Measures average nursing staff hours per resident per day, including Registered Nurses (RNs) and total nursing staff. Ratings are adjusted based on the level of care residents require and are compared to state and national benchmarks.
Quality Measures Info Based on clinical and physical health indicators reported to CMS, such as hospital readmissions, falls, pressure ulcers, and improvements in mobility. These measures reflect how well residents' health needs are being managed.

Staffing hours breakdown

Info Daily nursing hours per resident by staff type, reported to CMS. Higher is generally better — compare this facility to state and national averages to see where staffing stands.

Hours per resident per day — compared to state averages

Total nursing care / resident Info Total adjusted nursing hours per resident per day, combining RN, LPN, and aide time. CMS adjusts this for case-mix so facilities can be fairly compared.
3h 17m per day
Rank #131 / 210Nurse hours — State benchmarkedThis home is ranked 131st out of 210 homes in Ohio. Shows adjusted nurse hours per resident per day benchmarked to the Ohio average, with a ranking across 210 Ohio facilities. More hours mean more direct care. The national average is about 3.5 hrs; below 3.0 is a red flag.Rankings are based only on facilities in Ohio that report data for that category. Facilities without available data are excluded from the ranking.Click the rank badge to see the full State ranking.Click here to see the full State ranking.
vs avg

2 of 6 metrics below state avg

Standout metric LPN / LVN is +58% above state avg
Staff typeHours / Day / Residentvs state avg
Registered Nurse (RN) Info RNs hold the highest nursing license and can assess residents, interpret test results, and direct care plans. More RN hours per day often signals stronger clinical oversight and faster response to health changes. 34m per day ▼ 10% State avg: 38m per day · National avg: 41m per day
LPN / LVN Info Licensed Practical Nurses (LPNs) or Licensed Vocational Nurses (LVNs) deliver routine hands-on care — medication administration, wound dressing, and monitoring vital signs. They work under RN supervision and make up a large share of daily bedside care. 1h 32m per day ▲ 58% State avg: 58m per day · National avg: 52m per day
Nurse Aide Info Certified Nurse Aides (CNAs) provide the most direct day-to-day assistance: bathing, dressing, feeding, and mobility. Nurse aide hours are typically the largest staffing category and directly affect residents' quality of life. 2h 49m per day ▲ 32% State avg: 2h 8m per day · National avg: 2h 21m per day
Weekend Total Nursing Info Combined nursing hours (RN + LPN + Nurse Aide) per resident per day on weekends. Staffing often drops on weekends — this figure reveals whether the facility maintains adequate coverage outside of weekday hours. 4h 18m per day ▲ 31% State avg: 3h 17m per day · National avg: 3h 26m per day
Physical Therapist Info Hours per resident per day provided by licensed Physical Therapists (PTs) or PT Assistants. PT services help residents recover mobility after injury or illness and are especially important for post-acute (short-stay) rehabilitation. 1m per day ▼ 71% State avg: 3m per day · National avg: 4m per day
Weekend RN Info Registered nurse hours specifically on weekends. Facilities sometimes reduce RN presence on Saturdays and Sundays — a low weekend RN figure compared to weekday hours can indicate reduced clinical oversight when most administrative staff are absent. 27m per day ▲ 7% State avg: 25m per day · National avg: 29m per day

Capacity and availability

This home usually has availability

Lower occupancy than the state average
Occupancy rate
83.2% Rank #119 / 211Occupancy rate — State benchmarkedThis home is ranked 119th out of 211 homes in Ohio. Shows this facility's occupancy rate versus the Ohio average, with its Statewide rank out of 211. Higher occupancy signals strong local demand and financial stability.Rankings are based only on facilities in Ohio that report data for that category. Facilities without available data are excluded from the ranking.Click the rank badge to see the full State ranking.Click here to see the full State ranking.
Avg. Length of Stay
101 days
Bed community size
23-bed community Rank #305 / 323Bed count — State benchmarkedThis home is ranked 305th out of 323 homes in Ohio. Shows this facility's certified or reported bed count compared to other Ohio facilities. Larger communities may offer more amenities, programs, and on-site services for residents and families.Rankings are based only on facilities in Ohio that report data for that category. Facilities without available data are excluded from the ranking.Click the rank badge to see the full State ranking.Click here to see the full State ranking.
A smaller, more intimate setting that may offer a quieter environment and closer staff-resident interactions.
Walk Score
Walk Score: 7 / 100 Rank #637 / 705Walk Score — State benchmarkedThis home is ranked 637th out of 705 homes in Ohio. Shows how walkable this facility's neighborhood is compared to the average Walk Score across Ohio facilities. Higher scores benefit residents, families, and staff.Rankings are based only on facilities in Ohio that report data for that category. Facilities without available data are excluded from the ranking.Click the rank badge to see the full State ranking.Click here to see the full State ranking.
Car-dependent. Most errands require a car, with limited nearby walkable options.

Therapy & Rehabilitation

3 services
Rehabilitation Services
Respite Care
Short-Term Rehab

Staffing & Medical

1 service
24-Hour Staffing

Amenities & Lifestyle

Specific ProgramsFountain Park Home Care, Therapy Solutions

Contact Rest Haven Nursing Home

Staffing Data

Reporting period: October 1 – December 31, 2025 (Q4 2025). Source: CMS Payroll-Based Journal report.

Total staff 43
Employees 30
Contractors 13
Staff to resident ratio 2.26 : 1
0% compared with State average

State average ratio: 0 : 0

Avg staff/day 13
Average shift 8.5 hours
0% compared with State average

State average: 0 hours

Total staff hours (quarter) 10,107

Nursing staff breakdown

Q4 2025 · Oct 1 – Dec 31 More info This data comes from the CMS Payroll-Based Journal report covering October 1 – December 31, 2025.
Registered Nurse

Manages medical care and health needs.

RN Staff Info All 4 RN Staff are full-time employees. No contractors work on this role. 4
Average shift length Info Average shift length. Calculated as total hours divided by days worked and average staff per day. 7.2 hours
Licensed Practical Nurse

Assists with medical care and medications.

LPN Staff Info 9 total: 4 full-time employees and 5 contractors. 9
Average shift length Info Average shift length. Calculated as total hours divided by days worked and average staff per day. 9.4 hours
Certified Nursing Assistant

Helps with daily care and mobility.

CNA Staff Info 14 total: 11 full-time employees and 3 contractors. 14
Average shift length Info Average shift length. Calculated as total hours divided by days worked and average staff per day. 9.3 hours

Contractor staffing

Q4 2025 · Oct 1 – Dec 31 More info This data comes from the CMS Payroll-Based Journal report covering October 1 – December 31, 2025.

Total hours from contractors

12.9%

1,306 contractor hours this quarter

Licensed Practical Nurse: 5 Certified Nursing Assistant: 3 Physical Therapy Assistant: 2 Physical Therapy Aide: 1 Respiratory Therapy Technician: 1 Qualified Social Worker: 1

Staff by category

Q4 2025 · Oct 1 – Dec 31 More info This data comes from the CMS Payroll-Based Journal report covering October 1 – December 31, 2025.
Certified Nursing Assistant113144,77692100%9.3
Licensed Practical Nurse4592,34392100%9.4
Nurse Practitioner3035336571%8
Dental Services Staff1015136571%7.9
Physical Therapy Aide1124896470%7.6
Speech Language Pathologist1013996571%6.1
Administrator2022874145%7
Registered Nurse4042603538%7.2
RN Director of Nursing1012463336%7.5
Clinical Nurse Specialist1011762224%8
Physical Therapy Assistant022332628%1.3
Respiratory Therapy Technician011251718%1.4
Qualified Social Worker0111789%2.1
Mental Health Service Worker1011255%2.4
14 Certified Nursing Assistant
% of Days 100%
9 Licensed Practical Nurse
% of Days 100%
3 Nurse Practitioner
% of Days 71%
1 Dental Services Staff
% of Days 71%
2 Physical Therapy Aide
% of Days 70%
1 Speech Language Pathologist
% of Days 71%
2 Administrator
% of Days 45%
4 Registered Nurse
% of Days 38%
1 RN Director of Nursing
% of Days 36%
1 Clinical Nurse Specialist
% of Days 24%
2 Physical Therapy Assistant
% of Days 28%
1 Respiratory Therapy Technician
% of Days 18%
1 Qualified Social Worker
% of Days 9%
1 Mental Health Service Worker
% of Days 5%

Penalties and fines

Federal penalties imposed by CMS for regulatory violations, including civil money penalties (fines) and denials of payment for new Medicare/Medicaid admissions.

Source: CMS Penalties Database

No penalties in the past 3 years

No civil money penalties or payment denials were reported in the last 3 years.

Quality of care over time

These measures show how residents usually do over time at this home, based on health outcomes and preventive care.

High-risk clinical events score Info A composite score based on pressure ulcers, falls with injury, weight loss, walking ability decline, and activities of daily living decline. 9.8
68% worse than State average

State average: 5.8

Functional decline score Info A composite score based on activities of daily living decline, walking ability decline, and incontinence. 22.0
74% worse than State average

State average: 12.7

Long-stay resident measures
Above average State avg: 4.7 Info CMS star rating based on long-stay quality measure performance. 5 stars = significantly above average, 1 star = significantly below average.
Need for Help with Daily Activities Increased Info Percent of long-stay residents whose need for help with daily activities has increased 16.7%
144% worse than State average

State average: 6.8%

Walking Ability Worsened Info Percent of long-stay residents whose ability to move independently worsened 25.5%
187% worse than State average

State average: 8.9%

Low Risk Residents with Bowel/Bladder Incontinence Info Percent of low risk long-stay residents who lose control of their bowels or bladder 23.9%
9% worse than State average

State average: 22.0%

Falls with Major Injury Info Percent of long-stay residents experiencing one or more falls with major injury 0.0%
100% better than State average

State average: 3.4%

High Risk Residents with Pressure Ulcers Info Percent of long-stay high risk residents with pressure ulcers 0.0%
100% better than State average

State average: 3.9%

Urinary Tract Infection Info Percent of long-stay residents with a urinary tract infection 1.9%
239% worse than State average

State average: 0.5%

Lost Too Much Weight Info Percent of long-stay residents who lose too much weight 6.8%
10% worse than State average

State average: 6.2%

Depressive Symptoms Info Percent of long-stay residents who have depressive symptoms 100.0%
316% worse than State average

State average: 24.0%

Antipsychotic Use Info Percent of long-stay residents who received an antipsychotic medication 7.1%
15% better than State average

State average: 8.4%

Pneumococcal Vaccine Info Percent of long-stay residents assessed and appropriately given the pneumococcal vaccine 100.0%
8% better than State average

State average: 92.4%

Short-stay resident measures
Pneumococcal Vaccine Info Percent of short-stay residents assessed and appropriately given the pneumococcal vaccine 100.0%
28% better than State average

State average: 78.0%

Antipsychotic medication increase Info Percent of short-stay residents who newly received an antipsychotic medication 4.2%
228% worse than State average

State average: 1.3%

Breakdown by payment type

Medicare

34% of new residents, usually for short-term rehab.

Typical stay 1 - 2 months

Private pay

40% of new residents, often for short stays.

Typical stay 1 - 2 months

Medicaid

25% of new residents, often for long-term daily care.

Typical stay 9 - 10 months

Facility Characteristics

Source: CMS Long-Term Care Facility Characteristics (Data as of Jan 2026)

Total residents 19
Medicare
1
5.3% of residents
Medicaid
10
52.6% of residents
Private pay or other
8
42.1% of residents
Programs & Services
Residents Group

Residents meet regularly to discuss policies, care quality, and activities

Nurse Aide Training

State-approved Nurse Aide Training and Competency Evaluation Program on-site

Active Resident Council

Organized group of residents that meets regularly to discuss facility policies, quality of life, and activities.

Finances and operations

Based on CMS SNF Cost Report for fiscal year ending in 12/2023.

For-profit
Corporation
Net patient revenue Info Net patient revenue — what the home actually collects for resident care, after contractual allowances, bad debt and discounts are subtracted from its gross charges (CMS cost report, Worksheet G-3). It covers resident care only; money the home earns from other sources is shown separately as "Other income."
$2.2M
Net patient income Info Net patient income: net patient revenue minus the home's total operating expenses. A positive figure means it earns more from resident care than it spends to deliver it; a negative figure means the opposite. It excludes non-operating "other income."
$75.9K
For-profit Corporation
Net patient revenue Info Net patient revenue — what the home actually collects for resident care, after contractual allowances, bad debt and discounts are subtracted from its gross charges (CMS cost report, Worksheet G-3). It covers resident care only; money the home earns from other sources is shown separately as "Other income."
$2.2M Rank #208 / 210Revenue — State benchmarkedThis home is ranked 208th out of 210 homes in Ohio. Shows this facility's annual revenue compared to the Ohio average. Higher revenue generally means more resources for staffing and capital — read alongside Payroll %.Rankings are based only on facilities in Ohio that report data for that category. Facilities without available data are excluded from the ranking.Click the rank badge to see the full State ranking.Click here to see the full State ranking.
Net patient income Info Net patient income: net patient revenue minus the home's total operating expenses. A positive figure means it earns more from resident care than it spends to deliver it; a negative figure means the opposite. It excludes non-operating "other income."
$75.9K
Other income Info Money the home earns outside of resident care — such as investments, grants, rentals and other non-operating sources (CMS cost report, Worksheet G-3). It is tracked separately from net patient revenue: it is not part of that figure, and it is not included in net patient income.
$663.6K
Payroll costs Info Staff salaries plus wage-related costs — benefits such as payroll taxes, health insurance and retirement — from the home's own accounting records (CMS cost report, Worksheet A). Contract or agency labor is counted separately, under other operating costs. Rank #210 / 210Payroll — State benchmarkedThis home is ranked 210th out of 210 homes in Ohio. Shows total annual staff payroll benchmarked to the Ohio average. Higher payroll investment relative to peers often signals better staffing and less reliance on cheaper contract labor.Rankings are based only on facilities in Ohio that report data for that category. Facilities without available data are excluded from the ranking.Click the rank badge to see the full State ranking.Click here to see the full State ranking.
$1.3M 56.3% of net patient revenue Info Payroll as a share of revenue: staff salaries and wage-related benefits divided by net patient revenue. A higher figure means more of each revenue dollar goes to staff pay. Rank #174 / 210Payroll % — State benchmarkedThis home is ranked 174th out of 210 homes in Ohio. Shows payroll as a percentage of revenue versus the Ohio average. Well-run Ohio facilities typically land around 54–64% — the top third Statewide. Below 25% may signal understaffing or heavy agency use — read with Staffing ratings.Rankings are based only on facilities in Ohio that report data for that category. Facilities without available data are excluded from the ranking.Click the rank badge to see the full State ranking.Click here to see the full State ranking.
Other operating costs Info Everything it costs to run the home apart from payroll — food, utilities, supplies, maintenance, contract labor and administration. Calculated as total operating expense minus payroll (staff salaries and wage-related benefits).
$902.9K
Total costs Info The home's total operating expense for the year — all the costs of running it, salaries included (CMS cost report, Worksheet G-3).
$2.2M

What does this home offer?

Social and recreational activities icon

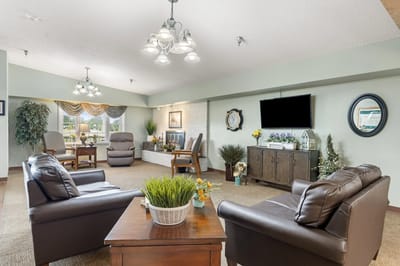
Social and Recreational Activities

On-site medical care and health services icon

On-site Medical Care and Health Services

Who this home usually serves

TYPE OF STAY

Mix of rehab and long-term care

This home supports both short-term rehab and long-term care, with residents staying for a wide range of durations.

New residents most often arrive under private pay (40% of admissions), and a typical private pay stay runs around 1 - 2 months.

Admissions
67 total

Coverage residents most often arrive under.

Medicare 34%
Private pay 40%
Medicaid 25%
Discharges
69 total

Coverage residents most often leave under.

Medicare 35%
Private pay 36%
Medicaid 29%

Places of interest near Rest Haven Nursing Home

Address 0.1 miles from city center Info Estimated distance in miles from Mcdermott's city center to Rest Haven Nursing Home's address, calculated via Google Maps.

Calculate Travel Distance to Rest Haven Nursing Home

Add your location

Address

Compare Nursing Homes around the area

The information below is reported by the Ohio Department of Health, Bureau of Survey and Certification.

Rest Haven Nursing Home
NH
AL
HC
NC
RC
Mcdermott -23 - 7 -
Beachwood Commons by New Perspective
NH
AL
IL
MC
Beachwood -120 A+ 15 Studio / 1 Bed
Brookdale Westlake Village
NH
AL
IL
MC
Westlake -60 A+ 25 1 Bed / 2 Bed
Elizabeth Scott Community
NH
AL
MC
Maumee -60 A+ 0 Studio / 1 Bed
Genoa Retirement Village
NH
AL
IL
MC
Genoa -68 A+ 17 Studio / 1 Bed / 2 Bed

Frequently Asked Questions about Rest Haven Nursing Home

What neighborhood is Rest Haven Nursing Home in?

Rest Haven Nursing Home is in the McDermott neighborhood.

Is Rest Haven Nursing Home in a walkable area?

Rest Haven Nursing Home has a walk score of 7. Car-dependent. Most errands require a car, with limited nearby walkable options.

What is the occupancy rate at Rest Haven Nursing Home?

Rest Haven Nursing Home's occupancy is 83.2%.

Does Rest Haven Nursing Home operate as a for-profit or non-profit?

Rest Haven Nursing Home is registered as a for-profit.

Are there photos of Rest Haven Nursing Home?

Yes — there are 4 photos of Rest Haven Nursing Home in the photo gallery on this page.

What is the address of Rest Haven Nursing Home?

Rest Haven Nursing Home is located at 2274 Mcdermott Pond Creek Road, Mcdermott, OH 45652.

What is the phone number of Rest Haven Nursing Home?

(740) 259-2838 will put you in contact with the team at Rest Haven Nursing Home.

Guides for Better Senior Living

Care Cost Calculator: See Prices in Your Area

Nursing Home Data Explorer

Don’t Wait Too Long: 7 Red Flag Signs Your Parent Needs Assisted Living Now

The True Cost of Assisted Living in 2025 – And How Families Are Paying For It

Understanding Senior Living Costs: Pricing Models, Discounts & Financial Assistance