River City Center
Nursing Home & Skilled Nursing · Decatur, AL
CMS overall rating Info CMS (the Centers for Medicare & Medicaid Services) is the federal agency that rates nursing home quality. Its Overall Rating runs from 1 to 5 stars, combining health inspections, staffing, and quality measures, with inspections weighted most heavily.

River City Center

Nursing Home & Skilled Nursing · Decatur, AL
CMS overall rating Info CMS (the Centers for Medicare & Medicaid Services) is the federal agency that rates nursing home quality. Its Overall Rating runs from 1 to 5 stars, combining health inspections, staffing, and quality measures, with inspections weighted most heavily.
Calculator: See prices in your area
River City Center accepts Medicare, Medicaid, and private pay.

Overview of River City Center

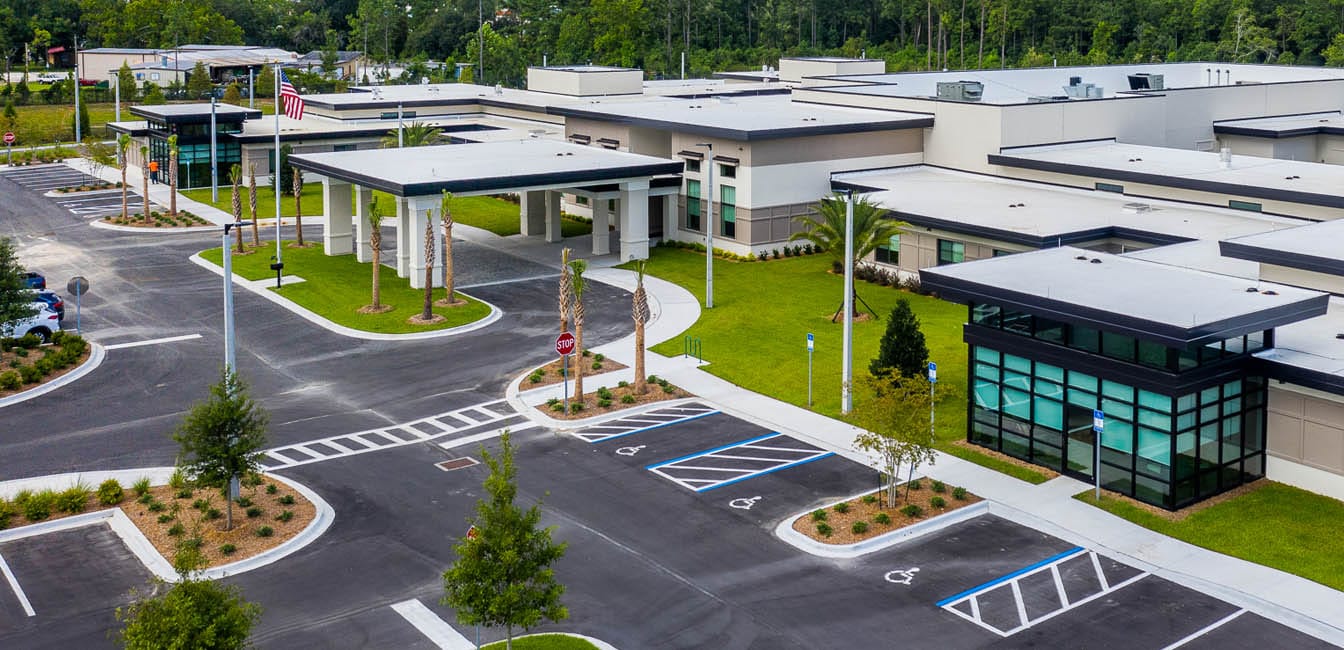
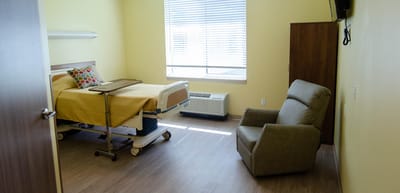
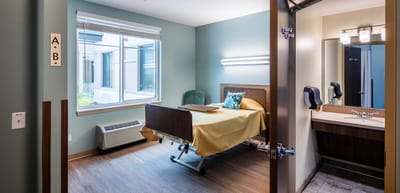
Accepting Medicare, Medicaid, and private pay, River City Center is a 183-bed nursing home owned by Joseph Dunavant in Alabama. The facility serves longer-term residents and those seeking short-term rehabilitation following a hospital stay or recovery period. The average stay duration is nearly 147 days, reflecting that mix of care needs.

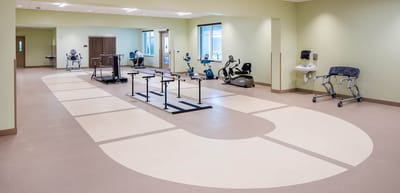
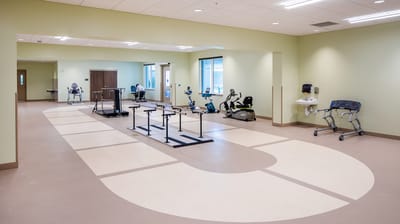
The home, clinically speaking, highlights rehabilitation services, making it a pragmatic choice for someone recovering from surgery, an injury, or illness. Total nursing care averages roughly 3 hours and 35 minutes per resident day, with registered nurses, nurse aides, and licensed vocational nurses working to support daily needs. Most errands need a vehicle because the community is in a car-dependent area of Alabama. For families living at a distance, this means visiting will generally involve driving rather than walking from a nearby station or using public transit.

Over the years, state inspections have noted deficiencies in facility maintenance, care procedures, and medication management. The home also has a history of substantiated abuse allegations.

For families considering River City Center, they must request a detailed explanation of how the facility has addressed such past findings and what safeguards are currently in place.

Quality ratings

Measured by Centers for Medicare & Medicaid Services (CMS)

Overall rating Info The Overall CMS Rating combines results from health inspections, staffing levels and quality measures. Health inspections carry the most weight. Staffing and quality scores can increase or decrease the final rating based on performance compared to state and national standards.
▼ 66.0% Below AL avg. ▼ 66.0% Below AL avg.AL average: 2.9Click the badge to see the full State ranking.Click here to see the full State ranking.
Health Inspection Info Based on the results of the facility's three most recent standard inspections and any complaint investigations. CMS reviews the number, scope, and severity of deficiencies, with more recent findings weighted more heavily.
▼ 64.7% Below AL avg. ▼ 64.7% Below AL avg.AL average: 2.8Click the badge to see the full State ranking.Click here to see the full State ranking.
Staffing Info Measures average nursing staff hours per resident per day, including Registered Nurses (RNs) and total nursing staff. Ratings are adjusted based on the level of care residents require and are compared to state and national benchmarks.
▲ 12.9% Above AL avg. ▲ 12.9% Above AL avg.AL average: 3.5Click the badge to see the full State ranking.Click here to see the full State ranking.
Quality Measures Info Based on clinical and physical health indicators reported to CMS, such as hospital readmissions, falls, pressure ulcers, and improvements in mobility. These measures reflect how well residents' health needs are being managed.
▲ 34.3% Above AL avg. ▲ 34.3% Above AL avg.AL average: 3.0Click the badge to see the full State ranking.Click here to see the full State ranking.

Staffing hours breakdown

Info Daily nursing hours per resident by staff type, reported to CMS. Higher is generally better — compare this facility to state and national averages to see where staffing stands.

Hours per resident per day — compared to Alabama state averages

Total nursing care / resident Info This home is ranked 120th out of 136 homes in Alabama for nurse hours. Total adjusted nursing hours per resident per day, combining RN, LPN, and aide time. CMS adjusts this for case-mix so facilities can be fairly compared.
3h 35m per day
Rank #120 / 136Nurse hours — State benchmarkedThis home is ranked 120th out of 136 homes in Alabama. Shows adjusted nurse hours per resident per day benchmarked to the Alabama average, with a ranking across 136 Alabama facilities. More hours mean more direct care. The national average is about 3.5 hrs; below 3.0 is a red flag.Rankings are based only on facilities in Alabama that report data for that category. Facilities without available data are excluded from the ranking.Click the rank badge to see the full State ranking.Click here to see the full State ranking.
This facility Alabama avg (4h 22m per day)
vs Alabama avg
-18%

3 of 6 metrics below state avg

Standout metric Weekend RN is +72% above state avg
Staff typeHours / Day / Residentvs state avg
Registered Nurse (RN) Info RNs hold the highest nursing license and can assess residents, interpret test results, and direct care plans. More RN hours per day often signals stronger clinical oversight and faster response to health changes. 52m per day ▲ 38% State avg: 38m per day · National avg: 41m per day
LPN / LVN Info Licensed Practical Nurses (LPNs) or Licensed Vocational Nurses (LVNs) deliver routine hands-on care — medication administration, wound dressing, and monitoring vital signs. They work under RN supervision and make up a large share of daily bedside care. 43m per day ▼ 8% State avg: 47m per day · National avg: 52m per day
Nurse Aide Info Certified Nurse Aides (CNAs) provide the most direct day-to-day assistance: bathing, dressing, feeding, and mobility. Nurse aide hours are typically the largest staffing category and directly affect residents' quality of life. 1h 43m per day ▼ 32% State avg: 2h 30m per day · National avg: 2h 20m per day
Weekend Total Nursing Info Combined nursing hours (RN + LPN + Nurse Aide) per resident per day on weekends. Staffing often drops on weekends — this figure reveals whether the facility maintains adequate coverage outside of weekday hours. 2h 56m per day ▼ 10% State avg: 3h 17m per day · National avg: 3h 26m per day
Physical Therapist Info Hours per resident per day provided by licensed Physical Therapists (PTs) or PT Assistants. PT services help residents recover mobility after injury or illness and are especially important for post-acute (short-stay) rehabilitation. 2m per day ▲ 4% State avg: 2m per day · National avg: 4m per day
Weekend RN Info Registered nurse hours specifically on weekends. Facilities sometimes reduce RN presence on Saturdays and Sundays — a low weekend RN figure compared to weekday hours can indicate reduced clinical oversight when most administrative staff are absent. 38m per day ▲ 72% State avg: 22m per day · National avg: 28m per day

Capacity and availability

Avg. Length of Stay Info Average number of days residents stay at this facility, based on CMS cost report data. Shorter stays often reflect post-acute or rehab care; longer stays reflect long-term care.
147 days
Bed community size
183-bed community Rank #13 / 245Bed count — State benchmarkedThis home is ranked 13th out of 245 homes in Alabama. Shows this facility's certified or reported bed count compared to other Alabama facilities. Larger communities may offer more amenities, programs, and on-site services for residents and families.Rankings are based only on facilities in Alabama that report data for that category. Facilities without available data are excluded from the ranking.Click the rank badge to see the full State ranking.Click here to see the full State ranking.
A large-scale community that may provide a wide range of amenities, services, and structured programs.
Walk Score
Walk Score: 6 / 100 Rank #361 / 418Walk Score — State benchmarkedThis home is ranked 361st out of 418 homes in Alabama. Shows how walkable this facility's neighborhood is compared to the average Walk Score across Alabama facilities. Higher scores benefit residents, families, and staff.Rankings are based only on facilities in Alabama that report data for that category. Facilities without available data are excluded from the ranking.Click the rank badge to see the full State ranking.Click here to see the full State ranking.
Car-dependent. Most errands require a car, with limited nearby walkable options.

About this community

License Details

Facility TypeNursing Home
StatusRegular
CountyMorgan
CMS Certification Number015113

Ownership & Operating Entity

River City Center is administered by Joseph Dunavant.

Profit StatusFor-profit

Therapy & Rehabilitation

1 service
Rehabilitation Services

Additional Services

1 service
Short-Stay Rehabilitation

Contact River City Center

Inspection History

In Alabama, the Department of Public Health, Bureau of Health Provider Standards conducts unannounced surveys to ensure facilities meet state licensing and federal certification safety standards.

Since 2018 · 8 years of data 12 deficiencies

Inspection Scorecard Info This scorecard compares key inspection, deficiency, and complaint metrics at this facility against the Alabama state average. Metrics rated ≥15% worse than average are highlighted in red; those ≥15% better are highlighted in green.

Since 2018 vs. Alabama state average
Overall vs. AL average 0 Worse No metrics in this bucket. 2 Better Metrics better than Alabama average:
• Total deficiencies (29% below)
• Deficiencies per year (29% below)
Latest Inspection April 29, 2021 Other An inspection that falls outside standard annual surveys and formal complaint investigations. May include administrative compliance checks, documentation reviews, focused surveys on specific concerns, or revisit surveys to verify prior corrections.

Deficiencies Info Deficiencies are formal regulatory issues recorded during state inspections.

This FacilityAL Averagevs. AL Avg
Total deficiencies Info Formal regulatory issues recorded by inspectors across all inspection types. 1217 This facility has 29% fewer total deficiencies than a typical Alabama assisted living residence (12 vs. AL avg 17).↓ 29% better
Deficiencies per year Info Average deficiencies per year since 2018. 1.52.1 This facility has 29% fewer deficiencies per year than a typical Alabama assisted living residence (1.5 vs. AL avg 2.1).↓ 29% better

Inspection Reports Summary Info An editor-reviewed summary of the themes and findings across this facility's recent inspection reports.

  • April 29, 2021 inspection found six deficiencies including unclean air conditioning units, failure to notify Ombudsman of hospital transfers, and improper food and garbage handling.
  • July 17, 2018 complaint investigation substantiated physical abuse by a CNA causing bruising, with multiple abuse reports not timely submitted to the state agency.
  • March 12, 2019 routine inspection cited two medication management issues: unattended insulin pen and unmarked opened influenza vaccine vial.

Health Inspection History

Inspections since 2018
Total health inspections 3

Alabama average 2.9


Last Health inspection on Apr 2021

Total health citations
12 Rank #90 / 136Health citations — State benchmarkedThis home is ranked 90th out of 136 homes in Alabama. Shows this facility's total health deficiency citations benchmarked to the Alabama State average, with a ranking across all 136 AL facilities. Lower citation counts earn a better rank.Rankings are based only on facilities in Alabama that report data for that category. Facilities without available data are excluded from the ranking.Click the rank badge to see the full State ranking.Click here to see the full State ranking.

Alabama average 10.4

Citations per inspection
4 Rank #93 / 136Citations per inspection — State benchmarkedThis home is ranked 93rd out of 136 homes in Alabama. Shows average deficiency citations per CMS inspection for this facility versus the Alabama mean across 136 facilities with citation data. Lower is better.Rankings are based only on facilities in Alabama that report data for that category. Facilities without available data are excluded from the ranking.Click the rank badge to see the full State ranking.Click here to see the full State ranking.

Alabama average 3.46


Health citations are formal notices following inspections when they fail to comply with safety and care standards.

All 12 citations resulted from standard inspections.

Breakdown of citation severity (last 8 years)
Critical health citations
0
100% better than Alabama average

Alabama average: 0.7


Serious health citations
1
400% worse than Alabama average

Alabama average: 0.2

0 critical citations Alabama average: 0.7

1 serious citation Alabama average: 0.2

10 moderate citations Alabama average: 9.1

1 minor citation Alabama average: 0.4
Citations history (last 8 years)
Nutrition moderate citation Apr 29, 2021
Corrected

Nutrition moderate citation Apr 29, 2021
Corrected

Nutrition moderate citation Apr 29, 2021
Corrected

Nutrition moderate citation Apr 29, 2021
Corrected

Staffing Data

Reporting period: October 1 – December 31, 2025 (Q4 2025). Source: CMS Payroll-Based Journal report.

Total staff 169
Employees 153
Contractors 16
Staff to resident ratio 1.26 : 1
19% fewer staff per resident than Alabama average
Alabama average ratio: 1.56 : 1 Alabama average ratio: 1.56 : 1See full Alabama ranking
Avg staff/day 69
Average shift 8.8 hours
11% better than Alabama average
Alabama average: 7.9 hours Alabama average shift: 7.9 hoursSee full Alabama ranking
Total staff hours (quarter) 55,578

Nursing staff breakdown

Q4 2025 · Oct 1 – Dec 31 More info This data comes from the CMS Payroll-Based Journal report covering October 1 – December 31, 2025.
Registered Nurse

Manages medical care and health needs.

RN Staff Info All 27 RN Staff are full-time employees. No contractors work on this role. 27
Average shift length Info Average shift length. Calculated as total hours divided by days worked and average staff per day. 10 hours
Licensed Practical Nurse

Assists with medical care and medications.

LPN Staff Info 29 total: 19 full-time employees and 10 contractors. 29
Average shift length Info Average shift length. Calculated as total hours divided by days worked and average staff per day. 9.6 hours
Certified Nursing Assistant

Helps with daily care and mobility.

CNA Staff Info 74 total: 72 full-time employees and 2 contractors. 74
Average shift length Info Average shift length. Calculated as total hours divided by days worked and average staff per day. 8.8 hours

Contractor staffing

Q4 2025 · Oct 1 – Dec 31 More info This data comes from the CMS Payroll-Based Journal report covering October 1 – December 31, 2025.

Total hours from contractors

6.5%

3,632 contractor hours this quarter

Licensed Practical Nurse: 10 Certified Nursing Assistant: 2 Occupational Therapy Assistant: 2 Occupational Therapy Aide: 1 Medical Director: 1

Staff by category

Q4 2025 · Oct 1 – Dec 31 More info This data comes from the CMS Payroll-Based Journal report covering October 1 – December 31, 2025.
Certified Nursing Assistant7227424,45292100%8.8
Licensed Practical Nurse19102910,26492100%9.6
Registered Nurse270279,84192100%10
Clinical Nurse Specialist5052,1536672%7.9
Physical Therapy Aide7071,3117480%6.9
Speech Language Pathologist4041,3046874%7
Other Dietary Services Staff5051,1068289%7
Mental Health Service Worker2021,0527177%8.8
Qualified Social Worker3036376773%7.1
Physical Therapy Assistant2025696975%6.8
Respiratory Therapy Technician3034946470%7.5
Nurse Practitioner1014806065%8
Other Social Services Staff1014756672%7.2
Administrator1014405560%8
Occupational Therapy Aide0114375459%8.1
Dental Services Staff1014355762%7.6
Occupational Therapy Assistant022811617%4.8
Medical Director011493841%1.3
74 Certified Nursing Assistant
% of Days 100%
29 Licensed Practical Nurse
% of Days 100%
27 Registered Nurse
% of Days 100%
5 Clinical Nurse Specialist
% of Days 72%
7 Physical Therapy Aide
% of Days 80%
4 Speech Language Pathologist
% of Days 74%
5 Other Dietary Services Staff
% of Days 89%
2 Mental Health Service Worker
% of Days 77%
3 Qualified Social Worker
% of Days 73%
2 Physical Therapy Assistant
% of Days 75%
3 Respiratory Therapy Technician
% of Days 70%
1 Nurse Practitioner
% of Days 65%
1 Other Social Services Staff
% of Days 72%
1 Administrator
% of Days 60%
1 Occupational Therapy Aide
% of Days 59%
1 Dental Services Staff
% of Days 62%
2 Occupational Therapy Assistant
% of Days 17%
1 Medical Director
% of Days 41%

Penalties and fines

Federal penalties imposed by CMS for regulatory violations, including civil money penalties (fines) and denials of payment for new Medicare/Medicaid admissions.

Source: CMS Penalties Database

No penalties in the past 3 years

No civil money penalties or payment denials were reported in the last 3 years.

Quality of care over time

These measures show how residents usually do over time at this home, based on health outcomes and preventive care.

High-risk clinical events score Info A composite score based on pressure ulcers, falls with injury, weight loss, walking ability decline, and activities of daily living decline. 9.6
8% worse than Alabama average

Alabama average: 8.9

Functional decline score Info A composite score based on activities of daily living decline, walking ability decline, and incontinence. 16.5
14% worse than Alabama average

Alabama average: 14.5

Long-stay resident measures
Average Alabama avg: 3.3 Info CMS star rating based on long-stay quality measure performance. 5 stars = significantly above average, 1 star = significantly below average.
Need for Help with Daily Activities Increased Info Percent of long-stay residents whose need for help with daily activities has increased 15.6%
12% worse than Alabama average

Alabama average: 13.9%

Walking Ability Worsened Info Percent of long-stay residents whose ability to move independently worsened 15.6%
In line with Alabama average

Alabama average: 16.1%

Low Risk Residents with Bowel/Bladder Incontinence Info Percent of low risk long-stay residents who lose control of their bowels or bladder 18.2%
34% worse than Alabama average

Alabama average: 13.6%

Falls with Major Injury Info Percent of long-stay residents experiencing one or more falls with major injury 2.6%
22% better than Alabama average

Alabama average: 3.4%

High Risk Residents with Pressure Ulcers Info Percent of long-stay high risk residents with pressure ulcers 8.1%
37% worse than Alabama average

Alabama average: 5.9%

Urinary Tract Infection Info Percent of long-stay residents with a urinary tract infection 1.1%
60% better than Alabama average

Alabama average: 2.7%

Lost Too Much Weight Info Percent of long-stay residents who lose too much weight 6.0%
11% worse than Alabama average

Alabama average: 5.4%

Depressive Symptoms Info Percent of long-stay residents who have depressive symptoms 2.1%
68% worse than Alabama average

Alabama average: 1.2%

Antipsychotic Use Info Percent of long-stay residents who received an antipsychotic medication 16.8%
19% better than Alabama average

Alabama average: 20.7%

Pneumococcal Vaccine Info Percent of long-stay residents assessed and appropriately given the pneumococcal vaccine 98.2%
7% better than Alabama average

Alabama average: 91.5%

Influenza Vaccine Info Percent of long-stay residents assessed and appropriately given the seasonal influenza vaccine 99.3%
5% better than Alabama average

Alabama average: 94.8%

Hospitalizations per 1,000 days Info Number of hospitalizations per 1,000 long-stay resident days. 1.42
29% better than Alabama average

Alabama average: 2.00

ED visits per 1,000 days Info Number of outpatient emergency department visits per 1,000 long-stay resident days. 1.02
43% better than Alabama average

Alabama average: 1.79

Short-stay resident measures
Below average Alabama avg: 2.1 Info CMS star rating based on short-stay quality measure performance. 5 stars = much above average, 1 star = much below average.
Pneumococcal Vaccine Info Percent of short-stay residents assessed and appropriately given the pneumococcal vaccine 83.2%
In line with Alabama average

Alabama average: 83.7%

Antipsychotic medication increase Info Percent of short-stay residents who newly received an antipsychotic medication 1.5%
27% better than Alabama average

Alabama average: 2.1%

Influenza Vaccine Info Percent of short-stay residents assessed and appropriately given the seasonal influenza vaccine 90.8%
13% better than Alabama average

Alabama average: 80.3%

Re-hospitalized after SNF stay Info Percentage of short-stay residents who were re-hospitalized after their nursing home admission. 27.6%
13% worse than Alabama average

Alabama average: 24.5%

Emergency department visits Info Percentage of short-stay residents who had an outpatient emergency department visit. 10.1%
12% better than Alabama average

Alabama average: 11.5%

Falls with major injury Info Percentage of SNF residents who experience falls with major injury during their stay. 0.9%
22% worse than Alabama average

Alabama average: 0.8%

Ability to care for self at discharge Info Percentage of residents at or above expected ability to care for themselves at discharge. 42.5%
21% worse than Alabama average

Alabama average: 53.7%

Successful return to home or community Info Rate of successful return to home or community from a skilled nursing facility. 54.7%
8% better than Alabama average

Alabama average: 50.6%

Breakdown by payment type

Medicare

29% of new residents, usually for short-term rehab.

Typical stay 1 months

Private pay

45% of new residents, often for short stays.

Typical stay 1 months

Medicaid

26% of new residents, often for long-term daily care.

Typical stay 1 - 2 years

Facility Characteristics

Source: CMS Long-Term Care Facility Characteristics (Data as of Jan 2026)

Total residents 134
Medicare
17
12.7% of residents
Medicaid
109
81.3% of residents
Private pay or other
8
6% of residents
Programs & Services
Residents Group

Residents meet regularly to discuss policies, care quality, and activities

Nurse Aide Training

State-approved Nurse Aide Training and Competency Evaluation Program on-site

Active Resident Council

Organized group of residents that meets regularly to discuss facility policies, quality of life, and activities.

Finances and operations

Based on CMS SNF Cost Report for fiscal year ending in 06/2024.

For-profit
Corporation
Net patient revenue Info Net patient revenue — what the home actually collects for resident care, after contractual allowances, bad debt and discounts are subtracted from its gross charges (CMS cost report, Worksheet G-3). It covers resident care only; money the home earns from other sources is shown separately as "Other income."
$17.2M
Net patient income Info Net patient income: net patient revenue minus the home's total operating expenses. A positive figure means it earns more from resident care than it spends to deliver it; a negative figure means the opposite. It excludes non-operating "other income."
$348.2K
For-profit Corporation
Net patient revenue Info Net patient revenue — what the home actually collects for resident care, after contractual allowances, bad debt and discounts are subtracted from its gross charges (CMS cost report, Worksheet G-3). It covers resident care only; money the home earns from other sources is shown separately as "Other income."
$17.2M Rank #10 / 135Revenue — State benchmarkedThis home is ranked 10th out of 135 homes in Alabama. Shows this facility's annual revenue compared to the Alabama average. Higher revenue generally means more resources for staffing and capital — read alongside Payroll %.Rankings are based only on facilities in Alabama that report data for that category. Facilities without available data are excluded from the ranking.Click the rank badge to see the full State ranking.Click here to see the full State ranking.
Net patient income Info Net patient income: net patient revenue minus the home's total operating expenses. A positive figure means it earns more from resident care than it spends to deliver it; a negative figure means the opposite. It excludes non-operating "other income."
$348.2K
Other income Info Money the home earns outside of resident care — such as investments, grants, rentals and other non-operating sources (CMS cost report, Worksheet G-3). It is tracked separately from net patient revenue: it is not part of that figure, and it is not included in net patient income.
$314.8K
Payroll costs Info Staff salaries plus wage-related costs — benefits such as payroll taxes, health insurance and retirement — from the home's own accounting records (CMS cost report, Worksheet A). Contract or agency labor is counted separately, under other operating costs. Rank #4 / 135Payroll — State benchmarkedThis home is ranked 4th out of 135 homes in Alabama. Shows total annual staff payroll benchmarked to the Alabama average. Higher payroll investment relative to peers often signals better staffing and less reliance on cheaper contract labor.Rankings are based only on facilities in Alabama that report data for that category. Facilities without available data are excluded from the ranking.Click the rank badge to see the full State ranking.Click here to see the full State ranking.
$6.7M 39% of net patient revenue Info Payroll as a share of revenue: staff salaries and wage-related benefits divided by net patient revenue. A higher figure means more of each revenue dollar goes to staff pay. Rank #54 / 133Payroll % — State benchmarkedThis home is ranked 54th out of 133 homes in Alabama. Shows payroll as a percentage of revenue versus the Alabama average. Well-run Alabama facilities typically land around 54–69% — the top third Statewide. Below 25% may signal understaffing or heavy agency use — read with Staffing ratings.Rankings are based only on facilities in Alabama that report data for that category. Facilities without available data are excluded from the ranking.Click the rank badge to see the full State ranking.Click here to see the full State ranking.
Other operating costs Info Everything it costs to run the home apart from payroll — food, utilities, supplies, maintenance, contract labor and administration. Calculated as total operating expense minus payroll (staff salaries and wage-related benefits).
$10.2M
Total costs Info The home's total operating expense for the year — all the costs of running it, salaries included (CMS cost report, Worksheet G-3).
$16.9M

Who this home usually serves

TYPE OF STAY

Mostly long-term care residents

Most residents stay for extended periods and receive ongoing daily care.

New residents most often arrive under private pay (45% of admissions), and a typical private pay stay runs around 1 months.

Admissions
376 total

Coverage residents most often arrive under.

Medicare 29%
Private pay 45%
Medicaid 26%
Discharges
377 total

Coverage residents most often leave under.

Medicare 19%
Private pay 44%
Medicaid 37%

Places of interest near River City Center

Address 3.7 miles from city center Info Estimated distance in miles from Decatur's city center to River City Center's address, calculated via Google Maps.

Calculate Travel Distance to River City Center

Add your location

Address

Financial Assistance for
Assisted Living in Alabama

River City Center is located in Decatur, Alabama.
Here are the financial assistance programs available to residents in Alabama.

Get Financial aid guidance

Elderly and Disabled Waiver

Alabama Medicaid E&D Waiver

Age 65+ or disabled
General Alabama resident, Medicaid-eligible, requires nursing home-level care but can live in community with support.
Income Limits (2025) ~$2,829/month 300% FBR, individual
Asset Limits $2,000 (individual), $3,000 (couple) (excludes home, car).
AL

Must be assessed by a nurse for nursing home-level care need.

Benefits
In-home personal care (4-6 hours/day, e.g., bathing, dressing) Respite care (up to 240 hours/year) Adult day care (~$50/day avg.) Home-delivered meals Case management

Alabama Respite for Caregivers Program

Alabama Respite (via NFCSP)

Age Caregiver of someone 60+ (or with dementia)
General Alabama resident.
Income Limits No strict limit; prioritizes low-income.
Asset Limits Not applicable.
AL

Focus on rural caregivers; limited funding.

Benefits
In-home respite (4-6 hours/day) Adult day care (~$50/day) Short-term facility care (up to 5 days)

SenioRx Prescription Assistance Program

AL SenioRx

Age 55+
General Alabama resident, chronic illness requiring daily medication, not fully covered by other drug plans.
Income Limits ~$3,000/month individual, varies by AAA
Asset Limits Not strictly enforced; income-focused.
AL

High ROI; saved $43.5M for 6,825 participants in FY 2022.

Benefits
Prescription cost reduction (avg. $6,300/year savings per participant) Medication management support

Weatherization Assistance Program (WAP)

AL WAP

Age 60+ priority
General Alabama resident, own or rent home, low-income status.
Income Limits (2025) ~$2,510/month 200% of poverty level, individual
Asset Limits Not applicable; income-driven.
AL

Prioritizes seniors and disabled; limited annual funding.

Benefits
Insulation Weather stripping HVAC repairs (avg. $500-$1,000 in annual energy savings)

Section 202 Supportive Housing for the Elderly

AL Section 202

Age 62+
General Alabama resident, very low income, able to live independently with support.
Income Limits (2025) ~$1,500/month 50% of area median income, individual, varies by county
Asset Limits $10,000 individual, excludes home if owned
AL

High demand in urban areas like Birmingham; limited units statewide.

Benefits
Subsidized rent (30% of income, e.g., $300-$500/month) On-site services (housekeeping, transportation, ~$200/month value)

Alabama CARES Program

AL CARES

Age
General Caregivers of Alabama residents aged 60+ needing assistance with 3+ daily activities; no age limit for caregivers.
Income Limits No strict limit; cost-sharing based on recipient’s income e.g., ~$2,500/month threshold
Asset Limits Not applicable; focus on need.
AL

Prioritizes caregivers with greatest economic/social need; complements respite programs like AL Lifespan Respite.

Benefits
Respite care (up to 10 days/year) Counseling (4-6 sessions/year) Training (2-3 workshops/year) Supplemental supplies (e.g., $200/year avg.)

Frequently Asked Questions about River City Center

Is River City Center in a walkable area?

River City Center has a walk score of 6. Car-dependent. Most errands require a car, with limited nearby walkable options.

What is the occupancy rate at River City Center?

River City Center's occupancy is 82.9%.

Does River City Center operate as a for-profit or non-profit?

River City Center is registered as a for-profit in AL.

Who is the administrator of River City Center?

Joseph Dunavant is the administrator of River City Center.

How many beds does River City Center have?

River City Center has 183 beds.

Are there photos of River City Center?

Yes — there are 18 photos of River City Center in the photo gallery on this page.

What is the address of River City Center?

River City Center is located at 1350 Fourteenth Avenue, Southeast, Decatur, AL 35601.

Guides for Better Senior Living

Care Cost Calculator: See Prices in Your Area

Nursing Home Data Explorer

Don’t Wait Too Long: 7 Red Flag Signs Your Parent Needs Assisted Living Now

The True Cost of Assisted Living in 2025 – And How Families Are Paying For It

Understanding Senior Living Costs: Pricing Models, Discounts & Financial Assistance