


Hospitalizations per 1,000 days
 Number of hospitalizations per 1,000 long-stay resident days.
1.84
Number of hospitalizations per 1,000 long-stay resident days.
1.84
Texas average: 2.13
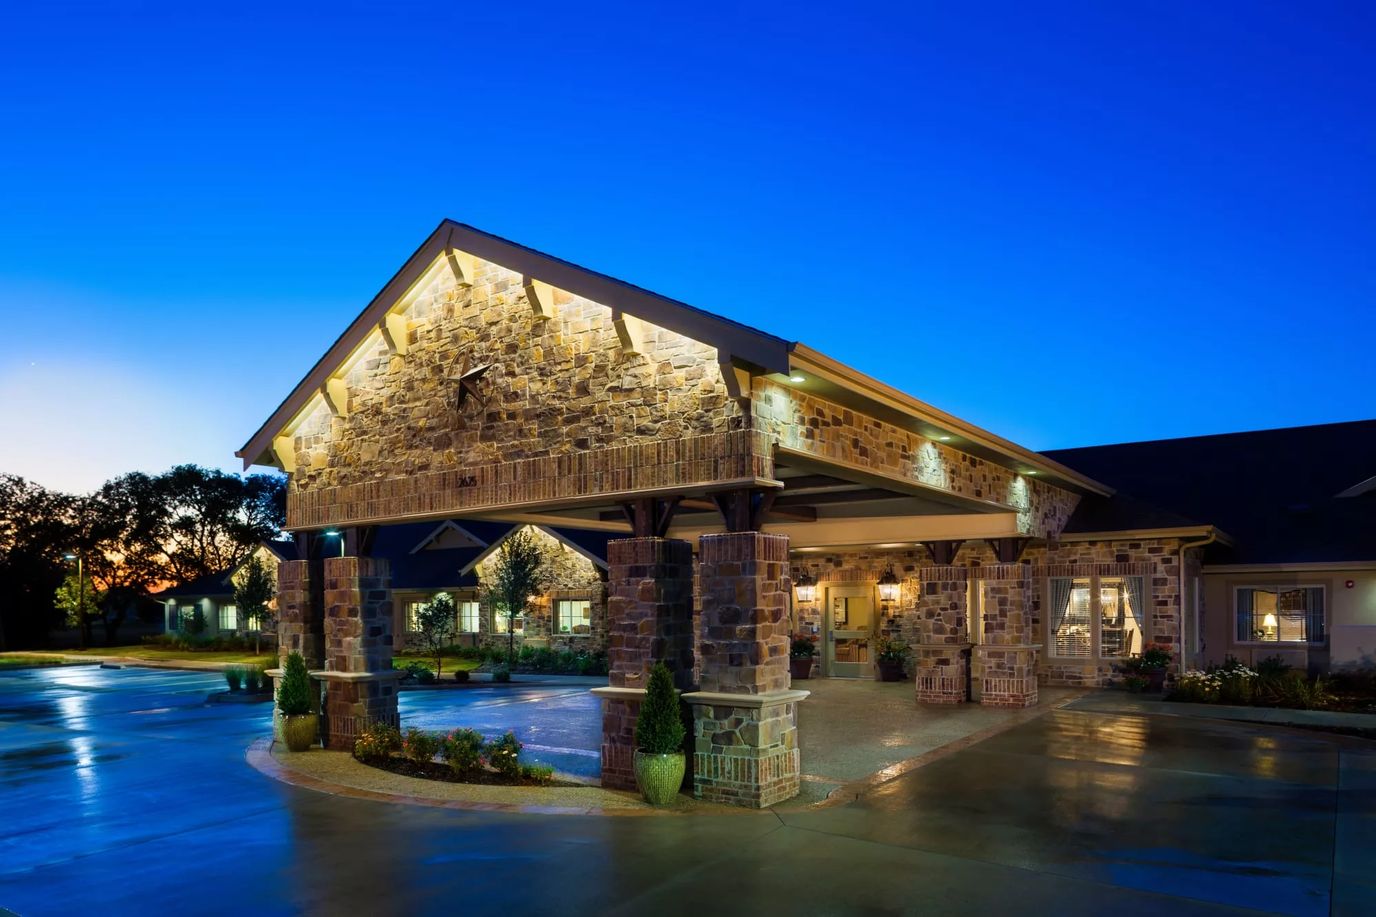
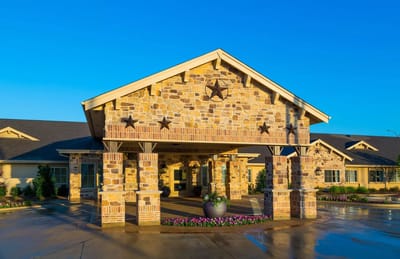
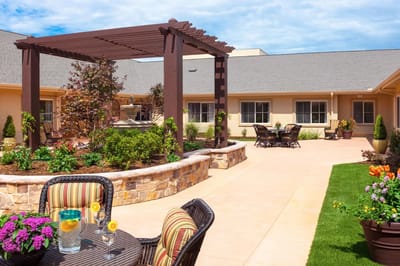
Riverside Oxford Memory Care is a 68-bed dedicated memory care community on North Riverside Drive in Fort Worth, Texas. The 151-day average length of stay sets the context: this is longer-term placement, not a transitional stop. Residents are here for months, not weeks.
The staffing structure has RN coverage at 22 minutes per resident per day. Total nursing care across all roles runs 3 hours 40 minutes daily per person, with nurse aides handling 2 hours 4 minutes and LPNs or LVNs contributing 52 minutes. The bulk of hands-on care sits with aides and LPN-level staff, which is a pattern common in dedicated memory care settings where direct supervision and daily assistance drive the staffing model more than acute nursing needs.
The Walk Score is 56, moderately walkable, though the resident population makes independent neighborhood access a non-factor in practical terms. Medicare, Medicaid, and private pay are all accepted, which gives families real flexibility in how they structure coverage for a stay that averages five months.
Riverside Oxford is built for older adults with dementia or cognitive decline who need dedicated, longer-term memory care support in a stable residential setting.
| Staff type | Hours / Day / Resident | vs state avg |
|---|---|---|
|
Registered Nurse (RN)
| 34m per day | ▲ 31% State avg: 26m per day · National avg: 41m per day |
|
LPN / LVN
| 1h 12m per day | ▲ 26% State avg: 57m per day · National avg: 52m per day |
|
Nurse Aide
| 2h 9m per day | ▲ 7% State avg: 2h 1m per day · National avg: 2h 21m per day |
|
Weekend Total Nursing
| 3h 18m per day | ▲ 11% State avg: 2h 59m per day · National avg: 3h 26m per day |
|
Physical Therapist
| 9m per day | ▲ 125% State avg: 4m per day · National avg: 4m per day |
|
Weekend RN
| 35m per day | ▲ 67% State avg: 21m per day · National avg: 29m per day |
Riverside Oxford Memory Care is legally operated by Oxford Riverside Memory Care LLC.
In Texas, the Health and Human Services Commission (HHSC) is the primary regulatory body that conducts unannounced inspections and publishes quality reports for all long-term care homes.
Citations
| This Facility | TX Average | vs. TX Avg |
|---|---|---|---|
|
Total citations
| 11 | 6 | This facility has 83% more total citations than a typical Texas nursing home (11 vs. TX avg 6).↑ 83% worse |
|
Health citations
| 3 | 2 | This facility has 50% more health citations than a typical Texas nursing home (3 vs. TX avg 2).↑ 50% worse |
|
Life safety citations
| 8 | 6 | This facility has 33% more life safety citations than a typical Texas nursing home (8 vs. TX avg 6).↑ 33% worse |
Inspections
| This Facility | TX Average | vs. TX Avg |
|---|---|---|---|
|
Inspections with citations
| 2 | 1 | This facility has 100% more inspections with citations than a typical Texas nursing home (2 vs. TX avg 1).↑ 100% worse |
These measures show how residents usually do over time at this home, based on health outcomes and preventive care.
Texas average: 2.13
Texas average: 2.07
Texas average: 25.9%
Texas average: 12.0%
Texas average: 0.8%
Quality measures are calculated from Minimum Data Set (MDS) assessments. For most measures, lower percentages indicate better care quality.
![]() 7.6 miles from city center
7.6 miles from city center
![]() Estimated distance in miles from Fort Worth's city center to Riverside Oxford Memory Care's address, calculated via Google Maps.
— 2.27 miles to nearest hospital (Fresenius Kidney Care)
Estimated distance in miles from Fort Worth's city center to Riverside Oxford Memory Care's address, calculated via Google Maps.
— 2.27 miles to nearest hospital (Fresenius Kidney Care)
Add your location
Info below is compiled from CMS reports & the TX Health & Human Services Commission (HHSC), senior community websites & trusted data sources such as Walk Score & BBB.
Communities are listed from highest to lowest based on our ranking methodology.
| Park View Care Center | MC AL HOS NH SNF | Fort Worth (West Meadowbrook) | 179
Facility
179
TX AVG
79
Rank
#28 / 972 |
71.0%
Facility
71.0%
TX AVG
67.3
Rank
#97 / 195 | +5% | 4.16
Facility
4.16
TX AVG
3.63
Rank
#54 / 239 | -5% | +15% | $299.0k
Facility
$299.0k
TX AVG
$81.8k
Rank
#241 / 244 | 46
Facility
46
TX AVG
25.9
Rank
#220 / 241 | 2.9
Facility
2.9
TX AVG
3.7
Rank
#92 / 241 | 6 | 127 | - |
28
Facility
28
TX AVG
41
Rank
#954 / 1389 | Mathew Bedard | $9.7MFiscal year ending 08/2024
Facility
$9.7MFiscal year ending 08/2024
TX AVG
$8.4M
Rank
#65 / 245 | $0.0kFiscal year ending 08/2024
Facility
$0.0kFiscal year ending 08/2024
TX AVG
$3.5M
Rank
#95 / 245 | 0%Fiscal year ending 08/2024
Facility
0%Fiscal year ending 08/2024
TX AVG
47%
Rank
#188 / 245 | 455606 | ||||
| Wedgewood Nursing Home | MC HOS NH PC RC SNF | Fort Worth (Wedgwood) | 128
Facility
128
TX AVG
79
Rank
#149 / 972 |
64.8%
Facility
64.8%
TX AVG
67.3
Rank
#119 / 195 | -4% | 4.09
Facility
4.09
TX AVG
3.63
Rank
#56 / 239 | -5% | +13% | $31.8k
Facility
$31.8k
TX AVG
$81.8k
Rank
#146 / 244 | 32
Facility
32
TX AVG
25.9
Rank
#191 / 241 | 2.9
Facility
2.9
TX AVG
3.7
Rank
#92 / 241 | 3 | 83 | - |
29
Facility
29
TX AVG
41
Rank
#940 / 1389 | Michael Meisner | $6.4MFiscal year ending 08/2024
Facility
$6.4MFiscal year ending 08/2024
TX AVG
$8.4M
Rank
#168 / 245 | $0.0kFiscal year ending 08/2024
Facility
$0.0kFiscal year ending 08/2024
TX AVG
$3.5M
Rank
#222 / 245 | 0%Fiscal year ending 08/2024
Facility
0%Fiscal year ending 08/2024
TX AVG
47%
Rank
#228 / 245 | 455572 | ||||
| Estates Healthcare & Rehab Center | MC NH SNF | Fort Worth (Hallmark-Camelot Highland Terrace) | 141
Facility
141
TX AVG
79
Rank
#83 / 972 |
62.8%
Facility
62.8%
TX AVG
67.3
Rank
#128 / 195 | -7% | 3.53
Facility
3.53
TX AVG
3.63
Rank
#120 / 239 | +16% | -3% | $148.9k
Facility
$148.9k
TX AVG
$81.8k
Rank
#221 / 244 | 41
Facility
41
TX AVG
25.9
Rank
#208 / 241 | 2.7
Facility
2.7
TX AVG
3.7
Rank
#69 / 241 | 10 | 89 | - |
51
Facility
51
TX AVG
41
Rank
#481 / 1389 | Fort Worth V Enterprises LLC | $5.1MFiscal year ending 03/2024
Facility
$5.1MFiscal year ending 03/2024
TX AVG
$8.4M
Rank
#217 / 245 | $4.2MFiscal year ending 03/2024
Facility
$4.2MFiscal year ending 03/2024
TX AVG
$3.5M
Rank
#174 / 245 | 83.5%Fiscal year ending 03/2024
Facility
83.5%Fiscal year ending 03/2024
TX AVG
47%
Rank
#31 / 245 | 675028 | ||||
| Marine Creek Nursing and Rehabilitation | MC NH SNF | Fort Worth (Far Greater Northside Historical) | 164
Facility
164
TX AVG
79
Rank
#39 / 972 | - | - | 2.80
Facility
2.80
TX AVG
3.63
Rank
#226 / 239 | +36% | -23% | $23.6k
Facility
$23.6k
TX AVG
$81.8k
Rank
#125 / 244 | 46
Facility
46
TX AVG
25.9
Rank
#220 / 241 | 2.6
Facility
2.6
TX AVG
3.7
Rank
#60 / 241 | 6 | 31 | - |
7
Facility
7
TX AVG
41
Rank
#1272 / 1389 | Marine Creek I Enterprises LLC | $10.8MFiscal year ending 03/2024
Facility
$10.8MFiscal year ending 03/2024
TX AVG
$8.4M
Rank
#88 / 245 | $8.0MFiscal year ending 03/2024
Facility
$8.0MFiscal year ending 03/2024
TX AVG
$3.5M
Rank
#41 / 245 | 74.2%Fiscal year ending 03/2024
Facility
74.2%Fiscal year ending 03/2024
TX AVG
47%
Rank
#32 / 245 | 675779 |
Riverside Oxford Memory Care is located in Fort Worth, Texas.
Here are the financial assistance programs available to residents in Texas.
Riverside Oxford Memory Care is in the Summerfields neighborhood of Fort Worth.
Riverside Oxford Memory Care is legally operated by Oxford Riverside Memory Care LLC.
Riverside Oxford Memory Care has a walk score of 56. Moderately walkable. Some errands can be accomplished on foot, with a mix of nearby amenities.
No, Riverside Oxford Memory Care has a no-pet policy.
Riverside Oxford Memory Care has 68 beds.
Riverside Oxford Memory Care has had 11 reported citations according to records from Texas Health and Human Services (HHSC).
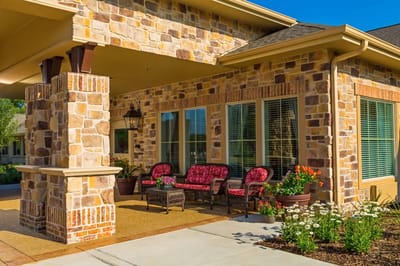
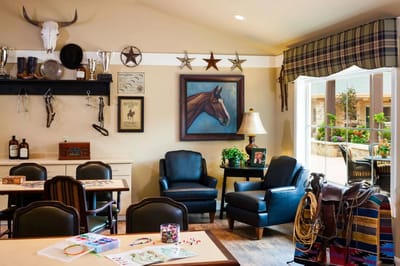
Yes — there are 8 photos of Riverside Oxford Memory Care in the photo gallery on this page.
Care Cost Calculator: See Prices in Your Area
Nursing Home Data Explorer
Don’t Wait Too Long: 7 Red Flag Signs Your Parent Needs Assisted Living Now
The True Cost of Assisted Living in 2025 – And How Families Are Paying For It
Understanding Senior Living Costs: Pricing Models, Discounts & Financial Assistance


