


Total health inspections
3
New York average 3.6
Last Health inspection on May 2024
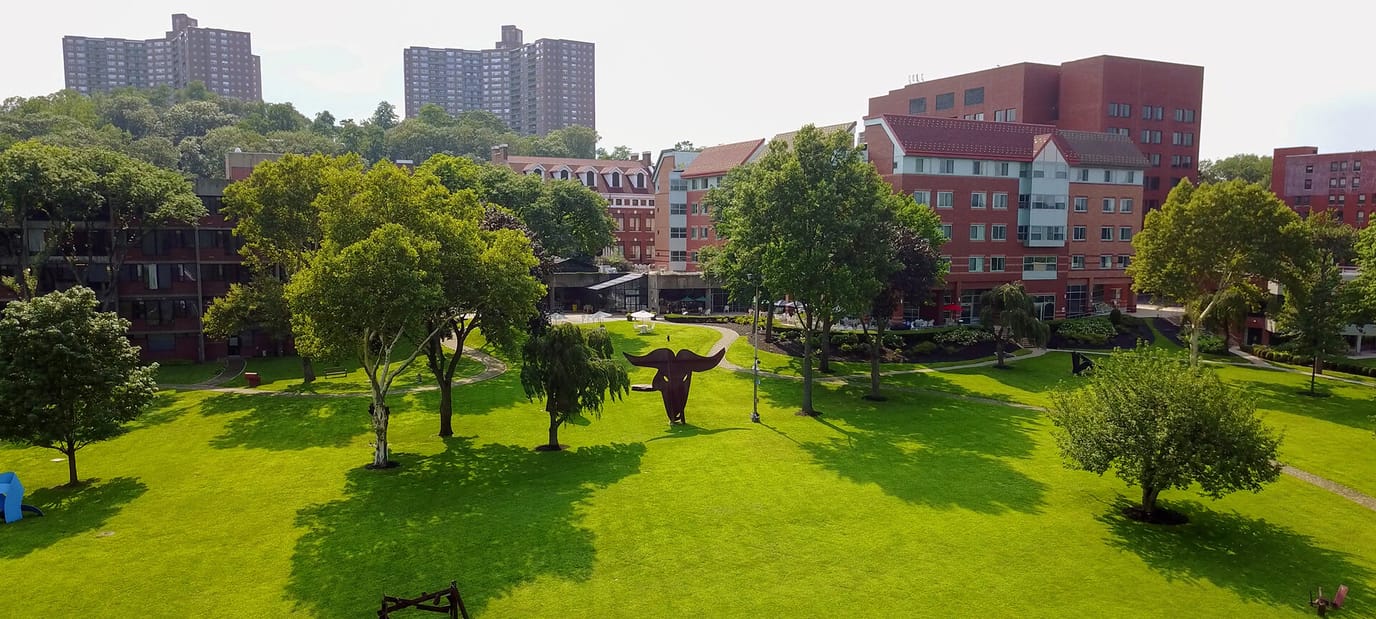


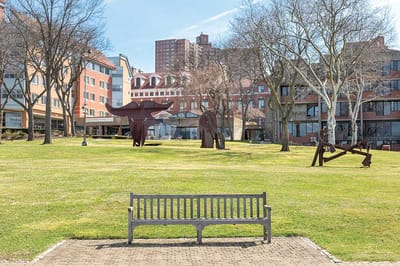


RiverSpring Residences, located on Palisade Avenue in the Riverdale area of the Bronx, is managed by The Hebrew Home for the Aged at Riverdale. This 69-bed facility provides many types of care in one spot: nursing home help, assisted living, independent living, memory care, home care, hospice, and palliative care. Having all these options is a big plus for families who want a place that can adjust as health needs change. They accept Medicaid, Medicare, and private payments.
Right now, 63 out of 69 beds are filled, which is a 91% occupancy rate. The average resident stays for about 153 days, covering both those there for quick recovery and those living there long-term. Riverdale has a Walk Score of 56, which means you can walk to some places, but having a car is usually a good idea for getting around.
Registered nurses spend about 53 minutes a day with each resident, and the total nursing care from all staff adds up to about 3 hours and 17 minutes daily per person. They offer specific programs like Independent Living 65+, Assisted Living Medicaid, Certified Home Health Aide services, Licensed Home Care, and Geriatric Care Management.
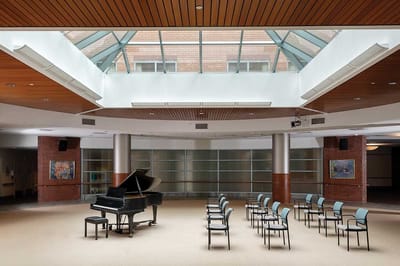
The facility has nice apartments, dining that feels like a restaurant, a gym, a hair salon, 24-hour front desk help, and planned bus rides. Residents also have plenty of daily activities and community events to choose from.
The New York Department of Health regularly checks the facility. Previous inspections mentioned some issues with how care plans and paperwork are handled. If you take a tour, it is a good idea to ask the staff how they create and update each person’s specific care plan to make sure everyone gets exactly what they need.
RiverSpring Residences is a very complete choice for senior care in the Bronx. With its 69 beds, seven different types of care, clear staffing numbers, and acceptance of Medicaid and Medicare, it is a strong option for families looking for a place that can handle many different health situations as they evolve.
| Staff type | Hours / Day / Resident | vs state avg |
|---|---|---|
|
Registered Nurse (RN)
| 53m per day | ▲ 27% State avg: 42m per day · National avg: 41m per day |
|
LPN / LVN
| 17m per day | ▼ 64% State avg: 47m per day · National avg: 52m per day |
|
Nurse Aide
| 2h 13m per day | ■ Avg State avg: 2h 11m per day · National avg: 2h 20m per day |
|
Weekend Total Nursing
| 3h 10m per day | ■ Avg State avg: 3h 14m per day · National avg: 3h 27m per day |
|
Physical Therapist
| 4m per day | ▼ 45% State avg: 7m per day · National avg: 4m per day |
|
Weekend RN
| 47m per day | ▲ 65% State avg: 29m per day · National avg: 29m per day |
In New York, the Department of Health, Office of Aging and Long Term Care performs unannounced onsite inspections to monitor compliance with state and federal healthcare regulations.
Inspection score unavailable
Not enough inspection history to generate a score.
Average score for New York assisted living residences: B 83/100
Inspections
| This Facility | NY Average | vs. NY Avg |
|---|---|---|---|
|
Total inspections
| 1 | 9 | This facility has had 89% fewer total inspections than the New York average (1 vs. NY avg 9). More inspections can mean more regulatory scrutiny rather than worse care.↓ 89% fewer |
|
Inspections with violations
| 1 | 4 | This facility has 75% fewer inspections with violations than a typical New York assisted living residence (1 vs. NY avg 4).↓ 75% better |
|
Inspection violation rate
| 100% | 44% | This facility has 56 percentage points higher inspection violation rate than a typical New York assisted living residence (100% vs. NY avg 44%).↑ 56% worse Rank #1 / 319 Inspection violation rate — State benchmarked This home is ranked 1st out of 319 homes in New York for % of inspections with violations. Shows this facility's % of inspections with violations compared to the New York average among 319 comparable communities in the ranking pool. Facilities with the same value for a metric share the same rank. Rankings are based only on facilities in New York that report data for that category. Facilities without available data are excluded from the ranking. |
|
Complaint visits
| 0 | 6 | This facility has 100% fewer complaint visits than a typical New York assisted living residence (0 vs. NY avg 6).↓ 100% better Rank #1 / 319 Complaint visits — State benchmarked This home is ranked 1st out of 319 homes in New York for complaint-related visits. Shows this facility's complaint-related visits compared to the New York average among 319 comparable communities in the ranking pool. Facilities with the same value for a metric share the same rank. Rankings are based only on facilities in New York that report data for that category. Facilities without available data are excluded from the ranking. |
Violations
| This Facility | NY Average | vs. NY Avg |
|---|---|---|---|
|
Total violations
| 1 | 14.5 | This facility has 93% fewer total violations than a typical New York assisted living residence (1 vs. NY avg 14.5).↓ 93% better Rank #1 / 319 Total violations — State benchmarked This home is ranked 1st out of 319 homes in New York for violations. Shows this facility's violations compared to the New York average among 319 comparable communities in the ranking pool. Facilities with the same value for a metric share the same rank. Rankings are based only on facilities in New York that report data for that category. Facilities without available data are excluded from the ranking. |
|
Violations per inspection
| 1 | 1.6 | This facility has 38% fewer violations per inspection than a typical New York assisted living residence (1 vs. NY avg 1.6).↓ 38% better Rank #1 / 319 Violations per inspection — State benchmarked This home is ranked 1st out of 319 homes in New York for violations per inspection. Shows this facility's violations per inspection compared to the New York average among 319 comparable communities in the ranking pool. Facilities with the same value for a metric share the same rank. Rankings are based only on facilities in New York that report data for that category. Facilities without available data are excluded from the ranking. |
Complaints & Investigations
| This Facility | NY Average | vs. NY Avg |
|---|---|---|---|
|
Total complaints
| 0 | 79 | This facility has 100% fewer total complaints than a typical New York assisted living residence (0 vs. NY avg 79).↓ 100% better |
|
Complaints per year
| 0 | 15.8 | This facility has 100% fewer complaints per year than a typical New York assisted living residence (0 vs. NY avg 15.8).↓ 100% better |
New York average 3.6
Last Health inspection on May 2024
New York average 18.5
New York average 5.05
Health citations are formal notices following inspections when they fail to comply with safety and care standards.
12 of 13 citations resulted from standard inspections; and 1 of 13 resulted from complaint investigations.
New York average: 0.2
New York average: 0.2
Reporting period: October 1 – December 31, 2025 (Q4 2025). Source: CMS Payroll-Based Journal report.
Manages medical care and health needs.
Assists with medical care and medications.
Helps with daily care and mobility.
Total hours from contractors
15,140 contractor hours this quarter
| Certified Nursing Assistant | 203 | 22 | 225 | 73,914 | 92 | 100% | 6.4 |
| Registered Nurse | 83 | 7 | 90 | 22,112 | 92 | 100% | 6.8 |
| Licensed Practical Nurse | 24 | 2 | 26 | 9,276 | 92 | 100% | 7 |
| Clinical Nurse Specialist | 25 | 0 | 25 | 6,989 | 92 | 100% | 6.8 |
| Mental Health Service Worker | 14 | 0 | 14 | 3,403 | 67 | 73% | 7 |
| Speech Language Pathologist | 0 | 8 | 8 | 2,654 | 89 | 97% | 7.2 |
| Physical Therapy Aide | 0 | 8 | 8 | 2,562 | 92 | 100% | 7.2 |
| Respiratory Therapy Technician | 0 | 8 | 8 | 2,052 | 90 | 98% | 7.8 |
| Occupational Therapy Aide | 0 | 5 | 5 | 1,324 | 65 | 71% | 6.3 |
| Physical Therapy Assistant | 0 | 8 | 8 | 1,062 | 78 | 85% | 6.6 |
| Qualified Social Worker | 0 | 4 | 4 | 877 | 74 | 80% | 6.5 |
| Administrator | 2 | 0 | 2 | 789 | 62 | 67% | 6.9 |
| Other Physician | 3 | 0 | 3 | 560 | 64 | 70% | 7 |
| Therapeutic Recreation Specialist | 0 | 1 | 1 | 502 | 66 | 72% | 7.6 |
| Nurse Practitioner | 1 | 0 | 1 | 406 | 58 | 63% | 7 |
| Medical Director | 1 | 0 | 1 | 329 | 47 | 51% | 7 |
| Other Dietary Services Staff | 10 | 0 | 10 | 127 | 4 | 4% | 6.4 |
| Dental Services Staff | 5 | 0 | 5 | 89 | 3 | 3% | 6.9 |
| Dietitian | 2 | 0 | 2 | 42 | 3 | 3% | 7 |
| Other Social Services Staff | 1 | 0 | 1 | 21 | 3 | 3% | 7 |
Federal penalties imposed by CMS for regulatory violations, including civil money penalties (fines) and denials of payment for new Medicare/Medicaid admissions.
Source: CMS Penalties Database
No penalties in the past 3 years
No civil money penalties or payment denials were reported in the last 3 years.
These measures show how residents usually do over time at this home, based on health outcomes and preventive care.
New York average: 9.8
New York average: 18.1
New York average: 16.4%
New York average: 16.6%
New York average: 21.4%
New York average: 3.0%
New York average: 7.2%
New York average: 1.4%
New York average: 6.1%
New York average: 18.1%
New York average: 12.6%
New York average: 91.4%
New York average: 95.2%
New York average: 76.6%
New York average: 1.3%
New York average: 78.8%
Quality measures are calculated from Minimum Data Set (MDS) assessments. For most measures, lower percentages indicate better care quality.
47% of new residents, usually for short-term rehab.
49% of new residents, often for short stays.
4% of new residents, often for long-term daily care.
Source: CMS Long-Term Care Facility Characteristics (Data as of Jan 2026)
Residents meet regularly to discuss policies, care quality, and activities
Organized group of residents that meets regularly to discuss facility policies, quality of life, and activities.
Data sourced from CMS Long-Term Care Facility Characteristics quarterly report. Payer mix reflects the current resident census by primary payment source.
Historical financial and operational data for RiverSpring Residences from 2011–2023, based on CMS SNF Cost Reports.
Key figures below are for fiscal year ending in 12/2023.
Based on CMS SNF Cost Report for fiscal year ending in 12/2023.
Pets Allowed
This home supports both short-term rehab and long-term care, with residents staying for a wide range of durations.
New residents most often arrive under private pay (49% of admissions), and a typical private pay stay runs around 5 - 6 months.
Coverage residents most often arrive under.
Coverage residents most often leave under.
![]() 5901 Palisade Avenue, New York, NY 10471
5901 Palisade Avenue, New York, NY 10471
Add your location
RiverSpring Residences is located in New York City, New York State.
Here are the financial assistance programs available to residents in New York City.
RiverSpring Residences is legally operated by The Hebrew Home for the Aged at Riverdale.
RiverSpring Residences has a walk score of 56. Moderately walkable. Some errands can be accomplished on foot, with a mix of nearby amenities.
According to NY state health department records, RiverSpring Residences's license number is 020-S-007.
RiverSpring Residences's occupancy is 91.2%.
Yes — see the floorplan options available at RiverSpring Residences on this page.
Yes, RiverSpring Residences allows residents to bring their pets.
RiverSpring Residences is registered as a non-profit in NY.
Care Cost Calculator: See Prices in Your Area
Nursing Home Data Explorer
Don’t Wait Too Long: 7 Red Flag Signs Your Parent Needs Assisted Living Now
The True Cost of Assisted Living in 2025 – And How Families Are Paying For It
Understanding Senior Living Costs: Pricing Models, Discounts & Financial Assistance


