Sabino Canyon Rehabilitation and Care Center
Nursing Home · Tucson, AZ
CMS overall rating Info The Overall CMS Rating is scored from 1 to 5 stars and combines results from health inspections, staffing levels, and quality measures. Health inspections carry the most weight. Staffing and quality scores can increase or decrease the final rating based on performance compared to state and national standards.

Sabino Canyon Rehabilitation and Care Center

Nursing Home · Tucson, AZ
CMS overall rating Info The Overall CMS Rating is scored from 1 to 5 stars and combines results from health inspections, staffing levels, and quality measures. Health inspections carry the most weight. Staffing and quality scores can increase or decrease the final rating based on performance compared to state and national standards.
Calculator: See prices in your area
Sabino Canyon Rehabilitation and Care Center accepts Medicare, Medicaid, and private pay.

Overview of Sabino Canyon Rehabilitation and Care Center

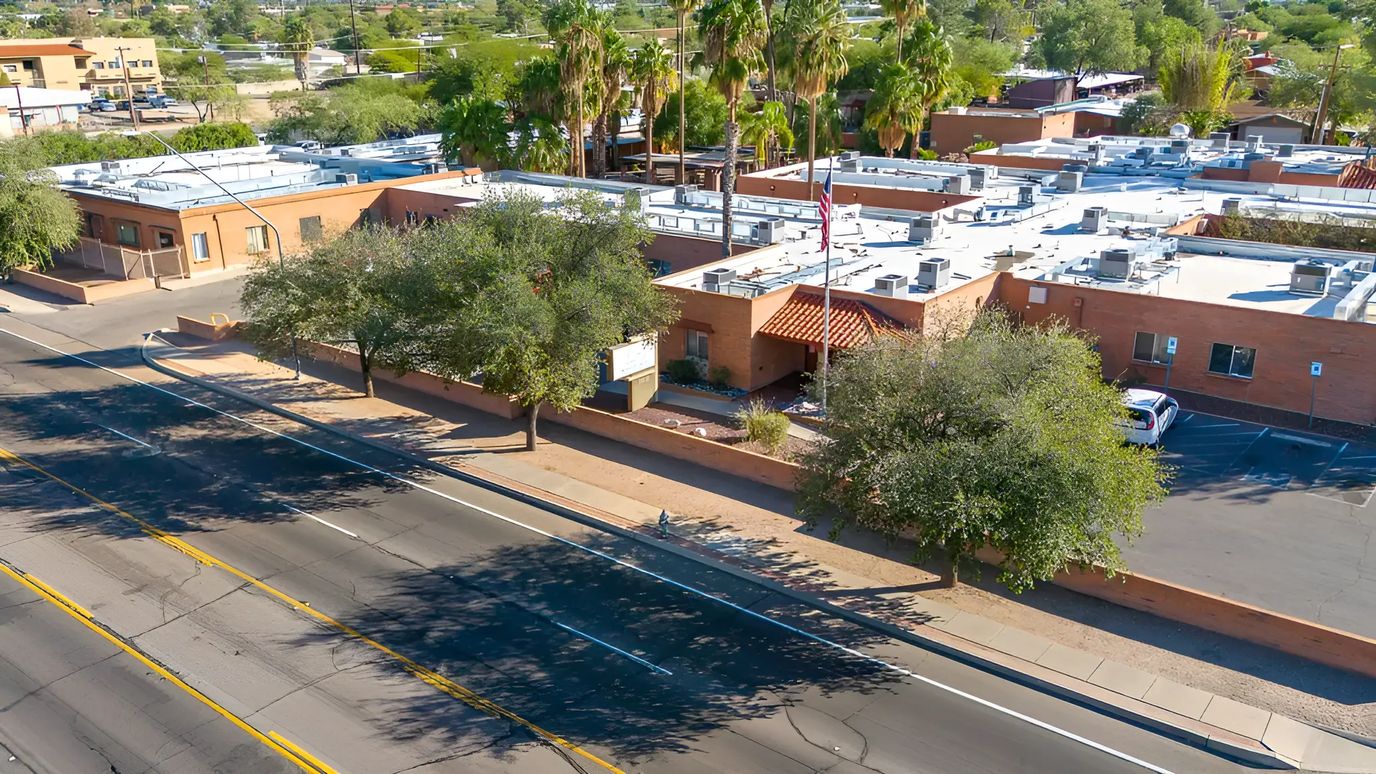
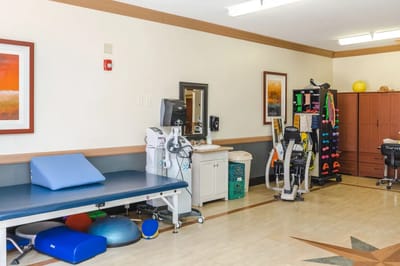
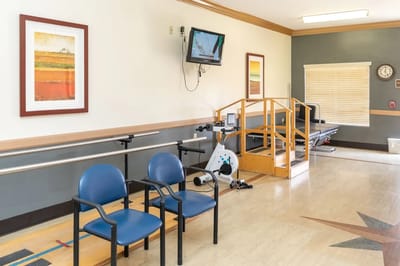
Sabino Canyon Rehabilitation and Care Center, located in Tucson, offers a comprehensive approach to skilled nursing care and rehabilitation. The facility incorporates a balance of high-tech and traditional methods and therapies to provide optimal care for residents. In partnership with Pima Heart, Sabino Canyon also offers a specialized cardiac wellness program. The therapy programs at Sabino Canyon are personalized to meet the unique needs of each resident, utilizing state-of-the-art therapy rooms for effective rehabilitation. 
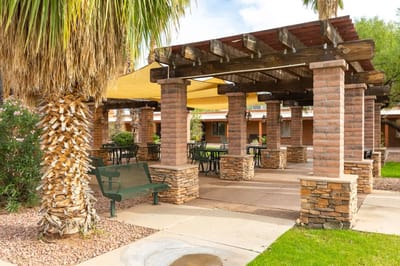
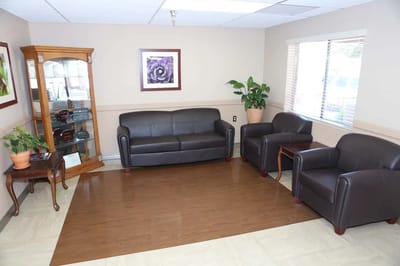
Their dining room is filled with natural light and features artwork in the corners, creating a welcoming space for residents to enjoy their meals. Comfortable rooms and lovely outdoor spaces provide a comfortable and serene environment for residents as well. The home’s Activities Department offers a variety of engaging activities to keep residents active and stimulated, fostering opportunities for self-discovery and growth.

(520) 722-5515

Quality ratings

Measured by Centers for Medicare & Medicaid Services (CMS)

Overall rating Info The Overall CMS Rating combines results from health inspections, staffing levels and quality measures. Health inspections carry the most weight. Staffing and quality scores can increase or decrease the final rating based on performance compared to state and national standards.
▲ 44.9% Above AZ avg. ▲ 44.9% Above AZ avg.Click the badge to see the full State ranking.Click here to see the full State ranking.
Health Inspection Info Based on the results of the facility's three most recent standard inspections and any complaint investigations. CMS reviews the number, scope, and severity of deficiencies, with more recent findings weighted more heavily.
▲ 43.4% Above AZ avg. ▲ 43.4% Above AZ avg.Click the badge to see the full State ranking.Click here to see the full State ranking.
Staffing Info Measures average nursing staff hours per resident per day, including Registered Nurses (RNs) and total nursing staff. Ratings are adjusted based on the level of care residents require and are compared to state and national benchmarks.
▼ 13.3% Below AZ avg. ▼ 13.3% Below AZ avg.Click the badge to see the full State ranking.Click here to see the full State ranking.
Quality Measures Info Based on clinical and physical health indicators reported to CMS, such as hospital readmissions, falls, pressure ulcers, and improvements in mobility. These measures reflect how well residents' health needs are being managed.
▲ 8.2% Above AZ avg. ▲ 8.2% Above AZ avg.Click the badge to see the full State ranking.Click here to see the full State ranking.

Staffing hours breakdown

Info Daily nursing hours per resident by staff type, reported to CMS. Higher is generally better — compare this facility to state and national averages to see where staffing stands.

Hours per resident per day — compared to Arizona state averages

Total nursing care / resident Info This home is ranked 51st out of 72 homes in Arizona. Total adjusted nursing hours per resident per day, combining RN, LPN, and aide time. CMS adjusts this for case-mix so facilities can be fairly compared.
3h 30m per day
Rank #51 / 72Nurse hours — State benchmarkedThis home is ranked 51st out of 72 homes in Arizona. Shows adjusted nurse hours per resident per day benchmarked to the Arizona average, with a ranking across 72 Arizona SNFs. More hours mean more direct care. The national average is about 3.5 hrs; below 3.0 is a red flag.Click the rank badge to see the full State ranking.Click here to see the full State ranking.
This facility Arizona avg (4h 11m per day)
vs Arizona avg
-16%

6 of 6 metrics below state avg

Staff typeHours / Day / Residentvs state avg
Registered Nurse (RN) Info RNs hold the highest nursing license and can assess residents, interpret test results, and direct care plans. More RN hours per day often signals stronger clinical oversight and faster response to health changes. 41m per day ▼ 5% State avg: 43m per day · National avg: 41m per day
LPN / LVN Info Licensed Practical Nurses (LPNs) or Licensed Vocational Nurses (LVNs) deliver routine hands-on care — medication administration, wound dressing, and monitoring vital signs. They work under RN supervision and make up a large share of daily bedside care. 44m per day ▼ 30% State avg: 1h 3m per day · National avg: 52m per day
Nurse Aide Info Certified Nurse Aides (CNAs) provide the most direct day-to-day assistance: bathing, dressing, feeding, and mobility. Nurse aide hours are typically the largest staffing category and directly affect residents' quality of life. 2h 7m per day ▼ 11% State avg: 2h 22m per day · National avg: 2h 21m per day
Weekend Total Nursing Info Combined nursing hours (RN + LPN + Nurse Aide) per resident per day on weekends. Staffing often drops on weekends — this figure reveals whether the facility maintains adequate coverage outside of weekday hours. 2h 45m per day ▼ 24% State avg: 3h 38m per day · National avg: 3h 26m per day
Physical Therapist Info Hours per resident per day provided by licensed Physical Therapists (PTs) or PT Assistants. PT services help residents recover mobility after injury or illness and are especially important for post-acute (short-stay) rehabilitation. 3m per day ▼ 50% State avg: 6m per day · National avg: 4m per day
Weekend RN Info Registered nurse hours specifically on weekends. Facilities sometimes reduce RN presence on Saturdays and Sundays — a low weekend RN figure compared to weekday hours can indicate reduced clinical oversight when most administrative staff are absent. 23m per day ▼ 26% State avg: 31m per day · National avg: 29m per day

Capacity and availability

This home usually has limited availability

Higher occupancy than the Arizona average: 72.7%
Occupancy rate
86.8% Rank #20 / 77Occupancy rate — State benchmarkedThis home is ranked 20th out of 77 homes in Arizona. Shows this facility's occupancy rate versus the Arizona average, with its Statewide rank out of 77. Higher occupancy signals strong local demand and financial stability.Click the rank badge to see the full State ranking.Click here to see the full State ranking.
Avg. Length of Stay
30 days
Bed community size
112-bed community Rank #112 / 529Bed count — State benchmarkedThis home is ranked 112th out of 529 homes in Arizona. Shows this facility's certified or reported bed count compared to other Arizona SNFs. Larger communities may offer more amenities, programs, and on-site services for residents and families.Click the rank badge to see the full State ranking.Click here to see the full State ranking.
A larger shared setting that may offer more common spaces and organized community services.
Years in operation
25 years in operation Rank #53 / 531Years in operation — State benchmarkedThis home is ranked 53rd out of 531 homes in Arizona. Shows how long this facility has been in operation compared to other Arizona SNFs. Longer operating histories may benefit residents, families, and staff.Click the rank badge to see the full State ranking.Click here to see the full State ranking.
A longer operating history, which may indicate experience navigating regulations and delivering ongoing care.
Walk Score
Walk Score: 62 / 100 Rank #130 / 819Walk Score — State benchmarkedThis home is ranked 130th out of 819 homes in Arizona. Shows how walkable this facility's neighborhood is compared to the average Walk Score across Arizona SNFs. Higher scores benefit residents, families, and staff.Click the rank badge to see the full State ranking.Click here to see the full State ranking.
Moderately walkable. Some errands can be accomplished on foot, with a mix of nearby amenities.

About this community

License Details

Facility TypeNursing Care Institution
StatusActive
IssuanceNovember 16, 2000
ExpirationFebruary 28, 2027
License NumberNCI-279
CMS Certification Number35151
QualificationHealth Care

Ownership & Operating Entity

Sabino Canyon Rehabilitation and Care Center is legally operated by Sabino Canyon Rehabilitation & Care Center, and administrated by Thomas Welker.

OwnerENSIGN SABINO LLC.

Performance summary

Key indicators of commitment to quality care and safety.

Ratings

Quality Rating
B Above average

Based on state quality rating data.

Contact Sabino Canyon Rehabilitation and Care Center

Inspection History

In Arizona, the Department of Health Services, Bureau of Long Term Care Licensing performs regular onsite inspections and investigates complaints for all licensed residential and nursing facilities.

Since 2020 · 6 years of data 26 deficiencies 15 complaints 21 inspections
Inspection Score Info A composite 0–100 score combining this facility's inspections, citations, complaints, and enforcement actions relative to the Arizona state average. The score below shows how many points this facility sits above or below the typical Arizona nursing home score (the benchmark); higher is better.

5 points below the Arizona average for nursing homes (75/100)

Inspection score: 70 out of 100. Letter grade C-. 5 points below the Arizona average for nursing homes (75/100)

Inspection Scorecard Info This scorecard compares key inspection, citation, and complaint metrics at this facility against the Arizona state average. Metrics rated ≥15% worse than average are highlighted in red; those ≥15% better are highlighted in green.

Since 2020 vs. Arizona state average
Overall vs. AZ average 5 Worse Metrics worse than Arizona average:
• Total deficiencies (189% above)
• Deficiencies per year (187% above)
• Total inspections (320% above)
• Total complaints (150% above)
• Complaints per year (150% above)
2 Better Metrics better than Arizona average:
• Deficiencies per inspection (33% below)
• Enforcement actions (100% below)
Latest Inspection May 20, 2025 Complaint No deficiencies

Deficiencies Info Deficiencies are formal regulatory issues recorded during state inspections.

This FacilityAZ Averagevs. AZ Avg
Total deficiencies Info Formal regulatory issues recorded by inspectors across all inspection types. 269 This facility has 189% more total deficiencies than a typical Arizona nursing home (26 vs. AZ avg 9).↑ 189% worse
Deficiencies per year Info Average deficiencies per year since 2020. 4.31.5 This facility has 187% more deficiencies per year than a typical Arizona nursing home (4.3 vs. AZ avg 1.5).↑ 187% worse
Deficiencies per inspection Info Average deficiencies per inspection. 1.21.8 This facility has 33% fewer deficiencies per inspection than a typical Arizona nursing home (1.2 vs. AZ avg 1.8).↓ 33% better
Enforcement actions Info Formal penalties or interventions imposed by Arizona regulators — directed plans of correction, civil monetary penalties, denial of payment, or appointment of temporary management. 00.9 This facility has 100% fewer enforcement actions than a typical Arizona nursing home (0 vs. AZ avg 0.9).↓ 100% better

Inspections Info State inspections evaluate whether the facility meets health and safety standards.

This FacilityAZ Averagevs. AZ Avg
Total inspections Info Combined count of all routine and focused inspections. Excludes complaint investigations. 215 This facility has 320% more total inspections than a typical Arizona nursing home (21 vs. AZ avg 5).↑ 320% worse

Complaints & Investigations Info Complaints are formal concerns filed by residents, families, or staff. Investigations are on-site follow-ups.

This FacilityAZ Averagevs. AZ Avg
Total complaints Info Formal expressions of concern made by residents, families, or staff. 156 This facility has 150% more total complaints than a typical Arizona nursing home (15 vs. AZ avg 6).↑ 150% worse
Complaints per year Info Average complaints per year since 2020. 2.51 This facility has 150% more complaints per year than a typical Arizona nursing home (2.5 vs. AZ avg 1).↑ 150% worse

Inspection Reports Summary Info An editor-reviewed summary of the themes and findings across this facility's recent inspection reports.

  • October 22, 2025 complaint investigation found the facility discharged a resident a day early during a Medicare appeal without notification or documentation, violating discharge rights and facility policy.
  • September 26, 2025 complaint investigation substantiated neglect after a resident eloped, fell, fractured an arm, and required surgery due to inadequate supervision and malfunctioning wander guards.
  • July 11, 2025 complaint investigation substantiated failure to provide a resident’s ordered wheelchair at discharge, causing safety risks and requiring fire department intervention for assistance at home.

Health Inspection History

Inspections since 2022
Total health inspections 5

Arizona average 6.3


Last Health inspection on Oct 2025

Total health citations
12 Rank #21 / 76Health citations — State benchmarkedThis home is ranked 21st out of 76 homes in Arizona. Shows this facility's total health deficiency citations benchmarked to the Arizona State average, with a ranking across all 76 AZ SNFs. Lower citation counts earn a better rank.Click the rank badge to see the full State ranking.Click here to see the full State ranking.

Arizona average 23.2

Citations per inspection
2.4 Rank #14 / 76Citations per inspection — State benchmarkedThis home is ranked 14th out of 76 homes in Arizona. Shows average deficiency citations per CMS inspection for this facility versus the Arizona mean across 76 SNFs with citation data. Lower is better.Click the rank badge to see the full State ranking.Click here to see the full State ranking.

Arizona average 3.82


Health citations are formal notices following inspections when they fail to comply with safety and care standards.

9 of 12 citations resulted from standard inspections; and 3 of 12 resulted from complaint investigations.

Breakdown of citation severity (last 4 years)
Critical health citations
0
100% better than Arizona average

Arizona average: 0.1


Serious health citations
0
100% better than Arizona average

Arizona average: 0.6

0 critical citations Arizona average: 0.1

0 serious citations Arizona average: 0.6

12 moderate citations Arizona average: 22.3

0 minor citations Arizona average: 0.2
Citations history (last 4 years)
Resident Rights moderate citation Oct 22, 2025
Corrected

Quality of Care moderate citation Sep 26, 2025
Corrected

Resident Rights moderate citation Jul 11, 2025
Corrected

Nutrition moderate citation Aug 25, 2023
Corrected

Staffing Data

Reporting period: October 1 – December 31, 2025 (Q4 2025). Source: CMS Payroll-Based Journal report.

Total staff 130
Employees 125
Contractors 5
Staff to resident ratio 1.88:1
5% better than Arizona average
Arizona average ratio: 1.80:1 Arizona average ratio: 1.80:1See full Arizona ranking
Avg staff/day 50
Average shift 7.6 hours
11% worse than Arizona average
Arizona average: 8.5 hours Arizona average shift: 8.5 hoursSee full Arizona ranking
Total staff hours (quarter) 35,132

Nursing staff breakdown

Q4 2025 · Oct 1 – Dec 31 More info This data comes from the CMS Payroll-Based Journal report covering October 1 – December 31, 2025.
Registered Nurse

Manages medical care and health needs.

RN Staff Info 18 total: 15 full-time employees and 3 contractors. 18
Average shift length Info Average shift length. Calculated as total hours divided by days worked and average staff per day. 7.9 hours
Licensed Practical Nurse

Assists with medical care and medications.

LPN Staff Info All 18 LPN Staff are full-time employees. No contractors work on this role. 18
Average shift length Info Average shift length. Calculated as total hours divided by days worked and average staff per day. 8.9 hours
Certified Nursing Assistant

Helps with daily care and mobility.

CNA Staff Info All 57 CNA Staff are full-time employees. No contractors work on this role. 57
Average shift length Info Average shift length. Calculated as total hours divided by days worked and average staff per day. 7.4 hours

Contractor staffing

Q4 2025 · Oct 1 – Dec 31 More info This data comes from the CMS Payroll-Based Journal report covering October 1 – December 31, 2025.

Total hours from contractors

0.4%

130 contractor hours this quarter

Registered Nurse: 3 Medical Director: 1 Occupational Therapy Assistant: 1

Staff by category

Q4 2025 · Oct 1 – Dec 31 More info This data comes from the CMS Payroll-Based Journal report covering October 1 – December 31, 2025.
Certified Nursing Assistant5705715,29092100%7.4
Licensed Practical Nurse180186,37892100%8.9
Registered Nurse153184,27892100%7.9
Dental Services Staff5051,4126773%8
Speech Language Pathologist4049547986%6.9
Physical Therapy Assistant4049006672%7.1
Physical Therapy Aide4047696672%6.5
RN Director of Nursing2026736368%8.8
Administrator1015286672%8
Medication Aide/Technician1015227582%7
Occupational Therapy Aide1015026571%7.7
Nurse Practitioner1014775358%9
Other Dietary Services Staff3034568693%4.9
Qualified Social Worker2024415459%7.4
Respiratory Therapy Technician2024356368%5.2
Dietitian1013955661%7.1
Therapeutic Recreation Specialist1013135863%5.4
Clinical Nurse Specialist3032884043%6.9
Occupational Therapy Assistant011881011%8.8
Medical Director0113544%8.8
57 Certified Nursing Assistant
% of Days 100%
18 Licensed Practical Nurse
% of Days 100%
18 Registered Nurse
% of Days 100%
5 Dental Services Staff
% of Days 73%
4 Speech Language Pathologist
% of Days 86%
4 Physical Therapy Assistant
% of Days 72%
4 Physical Therapy Aide
% of Days 72%
2 RN Director of Nursing
% of Days 68%
1 Administrator
% of Days 72%
1 Medication Aide/Technician
% of Days 82%
1 Occupational Therapy Aide
% of Days 71%
1 Nurse Practitioner
% of Days 58%
3 Other Dietary Services Staff
% of Days 93%
2 Qualified Social Worker
% of Days 59%
2 Respiratory Therapy Technician
% of Days 68%
1 Dietitian
% of Days 61%
1 Therapeutic Recreation Specialist
% of Days 63%
3 Clinical Nurse Specialist
% of Days 43%
1 Occupational Therapy Assistant
% of Days 11%
1 Medical Director
% of Days 4%

Penalties and fines

Federal penalties imposed by CMS for regulatory violations, including civil money penalties (fines) and denials of payment for new Medicare/Medicaid admissions.

Source: CMS Penalties Database

No penalties in the past 3 years

No civil money penalties or payment denials were reported in the last 3 years.

Quality of care over time

These measures show how residents usually do over time at this home, based on health outcomes and preventive care.

High-risk clinical events score Info A composite score based on pressure ulcers, falls with injury, weight loss, walking ability decline, and activities of daily living decline. 4.1
46% better than Arizona average

Arizona average: 7.6

Functional decline score Info A composite score based on activities of daily living decline, walking ability decline, and incontinence. 11.7
27% better than Arizona average

Arizona average: 16.1

Long-stay resident measures
Significantly above average Arizona avg: 3.8 Info CMS star rating based on long-stay quality measure performance. 5 stars = significantly above average, 1 star = significantly below average.
Need for Help with Daily Activities Increased Info Percent of long-stay residents whose need for help with daily activities has increased 4.0%
65% better than Arizona average

Arizona average: 11.2%

Walking Ability Worsened Info Percent of long-stay residents whose ability to move independently worsened 9.1%
43% better than Arizona average

Arizona average: 15.8%

Low Risk Residents with Bowel/Bladder Incontinence Info Percent of low risk long-stay residents who lose control of their bowels or bladder 22.0%
6% worse than Arizona average

Arizona average: 20.8%

Falls with Major Injury Info Percent of long-stay residents experiencing one or more falls with major injury 1.1%
46% better than Arizona average

Arizona average: 2.1%

High Risk Residents with Pressure Ulcers Info Percent of long-stay high risk residents with pressure ulcers 1.1%
77% better than Arizona average

Arizona average: 5.1%

Urinary Tract Infection Info Percent of long-stay residents with a urinary tract infection 1.1%
15% better than Arizona average

Arizona average: 1.3%

Lost Too Much Weight Info Percent of long-stay residents who lose too much weight 5.0%
9% better than Arizona average

Arizona average: 5.4%

Depressive Symptoms Info Percent of long-stay residents who have depressive symptoms 7.7%
73% worse than Arizona average

Arizona average: 4.5%

Antipsychotic Use Info Percent of long-stay residents who received an antipsychotic medication 5.4%
47% better than Arizona average

Arizona average: 10.3%

Pneumococcal Vaccine Info Percent of long-stay residents assessed and appropriately given the pneumococcal vaccine 99.4%
In line with Arizona average

Arizona average: 97.2%

Influenza Vaccine Info Percent of long-stay residents assessed and appropriately given the seasonal influenza vaccine 100.0%
6% better than Arizona average

Arizona average: 94.6%

Short-stay resident measures
Significantly above average Arizona avg: 4.2 Info CMS star rating based on short-stay quality measure performance. 5 stars = much above average, 1 star = much below average.
Pneumococcal Vaccine Info Percent of short-stay residents assessed and appropriately given the pneumococcal vaccine 99.1%
8% better than Arizona average

Arizona average: 91.5%

Antipsychotic medication increase Info Percent of short-stay residents who newly received an antipsychotic medication 0.2%
78% better than Arizona average

Arizona average: 1.0%

Influenza Vaccine Info Percent of short-stay residents assessed and appropriately given the seasonal influenza vaccine 97.1%
11% better than Arizona average

Arizona average: 87.3%

Re-hospitalized after SNF stay Info Percentage of short-stay residents who were re-hospitalized after their nursing home admission. 27.9%
13% worse than Arizona average

Arizona average: 24.6%

Emergency department visits Info Percentage of short-stay residents who had an outpatient emergency department visit. 13.2%
23% worse than Arizona average

Arizona average: 10.7%

Falls with major injury Info Percentage of SNF residents who experience falls with major injury during their stay. 0.0%
100% better than Arizona average

Arizona average: 0.8%

Ability to care for self at discharge Info Percentage of residents at or above expected ability to care for themselves at discharge. 76.9%
43% better than Arizona average

Arizona average: 53.7%

Successful return to home or community Info Rate of successful return to home or community from a skilled nursing facility. 60.1%
19% better than Arizona average

Arizona average: 50.6%

Breakdown by payment type

Medicare

15% of new residents, usually for short-term rehab.

Typical stay 17 days

Private pay

67% of new residents, often for short stays.

Typical stay 16 days

Medicaid

18% of new residents, often for long-term daily care.

Typical stay 3 months

Facility Characteristics

Source: CMS Long-Term Care Facility Characteristics (Data as of Jan 2026)

Total residents 69
Medicare
7
10.1% of residents
Medicaid
48
69.6% of residents
Private pay or other
14
20.3% of residents
Programs & Services
Residents Group

Residents meet regularly to discuss policies, care quality, and activities

Active Resident Council

Organized group of residents that meets regularly to discuss facility policies, quality of life, and activities.

Finances and operations

Privately-owned community
Operated by a business corporation.
Home revenue
$10.2M
Profit
$1.8M
Privately-owned community Operated by a business corporation.
Home revenue
$10.2M Rank #59 / 80Revenue — State benchmarkedThis home is ranked 59th out of 80 homes in Arizona. Shows this facility's annual revenue compared to the Arizona SNF average. Higher revenue generally means more resources for staffing and capital — read alongside Payroll %.Click the rank badge to see the full State ranking.Click here to see the full State ranking.
Profit
$1.8M
Payroll costs Info The portion of the home's budget spent on staff, including nurses, caregivers, and other employees who support care and operations. Rank #38 / 80Payroll — State benchmarkedThis home is ranked 38th out of 80 homes in Arizona. Shows total annual staff payroll benchmarked to the Arizona average. Higher payroll investment relative to peers often signals better staffing and less reliance on cheaper contract labor.Click the rank badge to see the full State ranking.Click here to see the full State ranking.
$7.1M
70% of revenue Rank #11 / 80Payroll % — State benchmarkedThis home is ranked 11th out of 80 homes in Arizona. Shows payroll as a percentage of revenue versus the Arizona average. Well-run Arizona SNFs typically land around 58–71% — the top third Statewide. Below 25% may signal understaffing or heavy agency use — read with Staffing ratings.Click the rank badge to see the full State ranking.Click here to see the full State ranking.
Other operating costs Info All remaining costs needed to run the home, such as food, utilities, building maintenance, supplies and administrative expenses.
$1.2M
Total costs $8.4M

Who this home usually serves

TYPE OF STAY

Primarily long-term care, limited rehab

Most residents stay long-term, while a smaller portion are admitted for short-term rehab.

Places of interest near Sabino Canyon Rehabilitation and Care Center

Address 6.3 miles from city center Info Estimated distance in miles from Tucson's city center to Sabino Canyon Rehabilitation and Care Center's address, calculated via Google Maps. — 0.85 miles to nearest hospital (TMC for Children)

Calculate Travel Distance to Sabino Canyon Rehabilitation and Care Center

Add your location

Address

Financial Assistance for
Nursing Home in Arizona

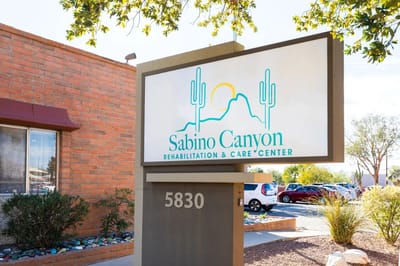
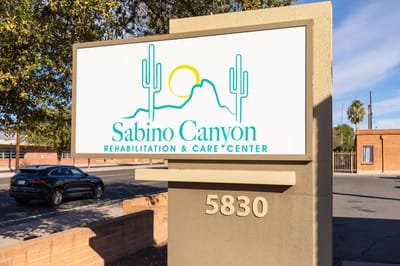
Sabino Canyon Rehabilitation and Care Center is located in Tucson, Arizona.
Here are the financial assistance programs available to residents in Arizona.

Get Financial aid guidance

Arizona Long Term Care System

ALTCS

Age 65+ or disabled
General Arizona resident, Medicaid-eligible, nursing home-level care need.
Income Limits (2025) ~$2,829/month 300% FBR, individual
Asset Limits $2,000 (individual), $3,000 (couple).
AZ

Covers tribal members; rural outreach.

Benefits
In-home care (6-8 hours/day) Assisted living Nursing home care Medical services Transportation (10 trips/month)

Non-Medical Home and Community Based Services

AZ DES Non-Medical HCBS

Age 60+
General Arizona resident, at risk of institutionalization.
Income Limits ~$2,000/month individual, varies
Asset Limits $10,000 individual
AZ

Limited funding; waitlists common.

Benefits
Homemaker services (3-5 hours/week) Respite care (up to 10 days/year) Adult day care (~$60/day)

Weatherization Assistance Program (WAP)

AZ WAP

Age 60+ priority
General Arizona resident, own/rent home, low-income.
Income Limits (2025) ~$2,510/month 200% of poverty level, individual
Asset Limits Not applicable; income-focused.
AZ

High demand in rural desert areas; limited annual funds.

Benefits
Insulation Weather stripping HVAC repairs (avg. $500-$1,000/year savings)

Section 202 Supportive Housing for the Elderly

AZ Section 202

Age 62+
General Arizona resident, very low income, able to live independently with support.
Income Limits (2025) ~$1,645/month 50% of area median income, individual, varies by county
Asset Limits $10,000 individual, excludes home if owned
AZ

Limited units; high demand in metro areas like Phoenix.

Benefits
Subsidized rent (30% of income, e.g., $300-$500/month) On-site services (housekeeping, transportation, ~$200/month value)

Arizona CARES Program

AZ CARES

Age
General Caregivers of Arizona residents 60+ needing help with 3+ daily activities; no caregiver age limit.
Income Limits No strict limit; cost-sharing above ~$2,500/month threshold.
Asset Limits Not applicable; need-based.
AZ

Focus on rural access; complements ALTCS respite.

Benefits
Respite care (up to 10 days/year) Counseling (4-6 sessions/year) Training (2-3 workshops/year) Supplies (~$200/year)

AZ DES Non-Medical Home and Community Based Services (HCBS)

AZ DES Non-Medical HCBS

Age 60+ or disabled
General Arizona resident, need assistance with daily activities, not eligible for Medicaid/ALTCS.
Income Limits Above Medicaid threshold but low-income ~$1,500-$2,500/month, varies by region
Asset Limits Not specified; income-driven eligibility.
AZ

Targets those ineligible for ALTCS; prioritizes rural and tribal areas.

Benefits
Homemaker services (3-5 hours/week) Personal care (limited hours) Respite care (up to 10 days/year) Transportation (~5 trips/month)

Compare Nursing Home around Tucson

The information below is reported by the Arizona Department of Health Services, Bureau of Long Term Care Licensing.

5 facilities compared · CMS & AZ Dept. of Health data

Filter by care type
Sabino Canyon Rehabilitation and Care Center
NH

Nursing Home Licensed facility providing 24/7 skilled nursing care for residents with complex, ongoing medical needs. Staffed by RNs, LPNs, and CNAs. Inspected and star-rated annually by CMS. Accepts Medicare (short-term rehab) and Medicaid (long-term care).

AL

Assisted Living A licensed, long-term care setting for seniors or individuals with disabilities who need help with daily activities — like bathing, dressing, and medication management — but not 24-hour skilled nursing. Offers housing, meals, and around-the-clock support while aiming to maximize resident independence.

Tucson (Harlan Heights)
112
Facility 112
AZ AVG 55
Rank #112 / 529
--3.50 +38%-14%$0122.4-94-
62
Facility 62
AZ AVG 37
Rank #130 / 819
Sabino Canyon Rehabilitation & Care Center$10.2M$7.1M70%35151
Haven Health Tucson
NH

Nursing Home Licensed facility providing 24/7 skilled nursing care for residents with complex, ongoing medical needs. Staffed by RNs, LPNs, and CNAs. Inspected and star-rated annually by CMS. Accepts Medicare (short-term rehab) and Medicaid (long-term care).

Tucson
118
Facility 118
AZ AVG 55
Rank #97 / 529
89.8% +23%2.49 +3%-39%$7.6k193.82106-
27
Facility 27
AZ AVG 37
Rank #517 / 819
Jason Seastrand$29.9M$9.4M31.3%35165
Brookdale Santa Catalina
NH

Nursing Home Licensed facility providing 24/7 skilled nursing care for residents with complex, ongoing medical needs. Staffed by RNs, LPNs, and CNAs. Inspected and star-rated annually by CMS. Accepts Medicare (short-term rehab) and Medicaid (long-term care).

AL

Assisted Living A licensed, long-term care setting for seniors or individuals with disabilities who need help with daily activities — like bathing, dressing, and medication management — but not 24-hour skilled nursing. Offers housing, meals, and around-the-clock support while aiming to maximize resident independence.

IL

Independent Living Lifestyle-focused communities for older adults offering dining, activities, and transportation with minimal personal care. Best for active, independent seniors who want community without medical support.

MC

Memory Care Secured, specialized care for people living with Alzheimer's or dementia. Staff trained in cognitive impairment, with higher staff-to-resident ratios and an environment designed to reduce confusion and wandering risk.

Tucson (Sin Vacas)
155
Facility 155
AZ AVG 55
Rank #35 / 529
--4.24 -37%+4%$0305.0-35A+
0
Facility 0
AZ AVG 37
Rank #802 / 819
Anna Munoz$7.8M$7.4M94.4%35253
Catalina Post-Acute & Rehabilitation
NH

Nursing Home Licensed facility providing 24/7 skilled nursing care for residents with complex, ongoing medical needs. Staffed by RNs, LPNs, and CNAs. Inspected and star-rated annually by CMS. Accepts Medicare (short-term rehab) and Medicaid (long-term care).

Tucson (Samos)
102
Facility 102
AZ AVG 55
Rank #134 / 529
97.1% +33%3.49 -20%-14%$0262.6-99-
84
Facility 84
AZ AVG 37
Rank #5 / 819
Catalina Post Acute And Rehabilitation$14.6M$9.3M63.9%35190
Mary and Pete’s Assisted Living II
NH

Nursing Home Licensed facility providing 24/7 skilled nursing care for residents with complex, ongoing medical needs. Staffed by RNs, LPNs, and CNAs. Inspected and star-rated annually by CMS. Accepts Medicare (short-term rehab) and Medicaid (long-term care).

AL

Assisted Living A licensed, long-term care setting for seniors or individuals with disabilities who need help with daily activities — like bathing, dressing, and medication management — but not 24-hour skilled nursing. Offers housing, meals, and around-the-clock support while aiming to maximize resident independence.

Tucson (Casas Adobes West)
10
Facility 10
AZ AVG 55
Rank #245 / 529
--3.76 -14%-8%$12.7k315.2153-
39
Facility 39
AZ AVG 37
Rank #378 / 819
Thomas Garland$11.8M$5.5M46.6%35244

Frequently Asked Questions about Sabino Canyon Rehabilitation and Care Center

What neighborhood is Sabino Canyon Rehabilitation and Care Center in?

Sabino Canyon Rehabilitation and Care Center is in the Harlan Heights neighborhood of Tucson.

Who is the owner of Sabino Canyon Rehabilitation and Care Center?

The legal owner and operator of Sabino Canyon Rehabilitation and Care Center is Sabino Canyon Rehabilitation & Care Center.

Is Sabino Canyon Rehabilitation and Care Center in a walkable area?

Sabino Canyon Rehabilitation and Care Center has a walk score of 62. Moderately walkable. Some errands can be accomplished on foot, with a mix of nearby amenities.

What is the license number of Sabino Canyon Rehabilitation and Care Center?

According to AZ state health department records, Sabino Canyon Rehabilitation and Care Center's license number is NCI-279.

When does Sabino Canyon Rehabilitation and Care Center's license expire?

According to AZ state health department records, Sabino Canyon Rehabilitation and Care Center's license expires on February 28, 2027.

Who is the administrator of Sabino Canyon Rehabilitation and Care Center?

Thomas Welker is the administrator of Sabino Canyon Rehabilitation and Care Center.

How many beds does Sabino Canyon Rehabilitation and Care Center have?

Sabino Canyon Rehabilitation and Care Center has 112 beds.

Guides for Better Senior Living

Care Cost Calculator: See Prices in Your Area

Nursing Home Data Explorer

Don’t Wait Too Long: 7 Red Flag Signs Your Parent Needs Assisted Living Now

The True Cost of Assisted Living in 2025 – And How Families Are Paying For It

Understanding Senior Living Costs: Pricing Models, Discounts & Financial Assistance

Explore Open Rooms
1 Contact details
2 What type of senior care service are you looking for?
3 What budget do you have in mind for senior care?
4 How soon do you need to find care?
5 Additional details

Thank you for your interest!

Our team will be in touch shortly to help with next steps.