Senior Star at Dublin Retirement Village
Nursing Home, Assisted Living, Independent Living & Memory Care · Dublin, OH
CMS overall rating Info CMS (the Centers for Medicare & Medicaid Services) is the federal agency that rates nursing home quality. Its Overall Rating runs from 1 to 5 stars, combining health inspections, staffing, and quality measures, with inspections weighted most heavily.

Senior Star at Dublin Retirement Village

Nursing Home, Assisted Living, Independent Living & Memory Care · Dublin, OH
CMS overall rating Info CMS (the Centers for Medicare & Medicaid Services) is the federal agency that rates nursing home quality. Its Overall Rating runs from 1 to 5 stars, combining health inspections, staffing, and quality measures, with inspections weighted most heavily.
Calculator: See prices in your area
Senior Star at Dublin Retirement Village accepts Medicare, Medicaid, and private pay.

Overview of Senior Star at Dublin Retirement Village

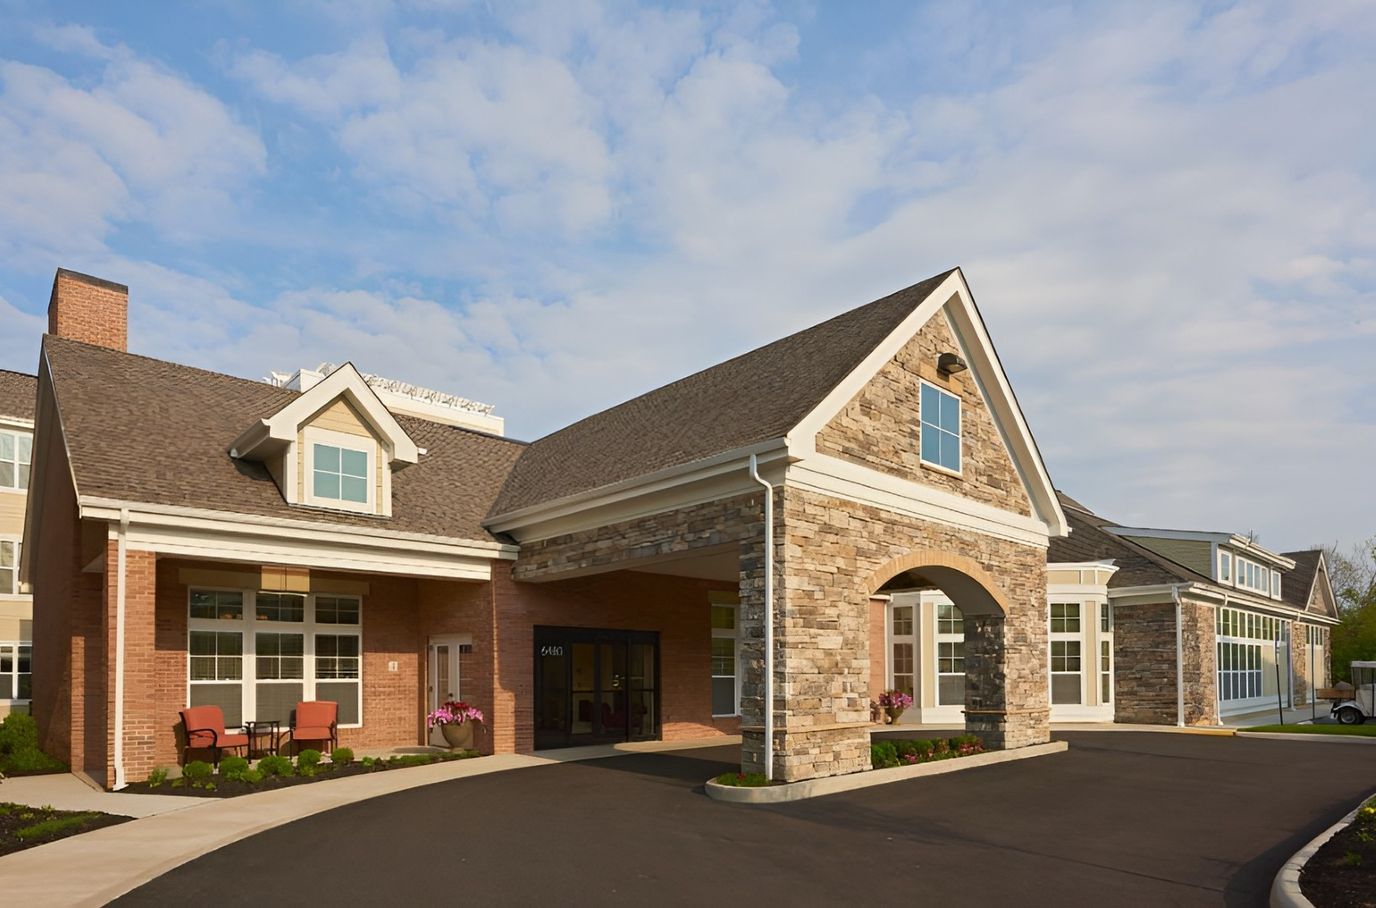
Nestled in the beautiful lands of Post Road, Dublin, OH, Senior Star at Dublin Retirement Village is a distinct senior living community that provides assisted living, independent living, and memory care. Featuring elegant and well-built residences in a wide array of studio, one-bedroom, and two-bedroom apartments, the community promises comfort and convenience like no other. Let go of your worries with a kind and compassionate team lending extra hands of support around the clock for your ever-changing needs and aspirations.

Dedicated to enhancing seniors’ well-being, Senior Star at Dublin Retirement Village orchestrates fun activities and engaging programs to ensure residents lead a meaningful life. The community meticulously crafts care plans that best suit seniors’ interests. With its bright and inviting communal spaces, Senior Star at Dublin Retirement Village strives to provide a haven for seniors to enjoy their best years gaining meaningful experiences.

Quality ratings

Measured by Centers for Medicare & Medicaid Services (CMS)

Overall rating Info The Overall CMS Rating combines results from health inspections, staffing levels and quality measures. Health inspections carry the most weight. Staffing and quality scores can increase or decrease the final rating based on performance compared to state and national standards.
Health Inspection Info Based on the results of the facility's three most recent standard inspections and any complaint investigations. CMS reviews the number, scope, and severity of deficiencies, with more recent findings weighted more heavily.
Staffing Info Measures average nursing staff hours per resident per day, including Registered Nurses (RNs) and total nursing staff. Ratings are adjusted based on the level of care residents require and are compared to state and national benchmarks.
Quality Measures Info Based on clinical and physical health indicators reported to CMS, such as hospital readmissions, falls, pressure ulcers, and improvements in mobility. These measures reflect how well residents' health needs are being managed.

Staffing hours breakdown

Info Daily nursing hours per resident by staff type, reported to CMS. Higher is generally better — compare this facility to state and national averages to see where staffing stands.

Hours per resident per day — compared to state averages

Total nursing care / resident Info Total adjusted nursing hours per resident per day, combining RN, LPN, and aide time. CMS adjusts this for case-mix so facilities can be fairly compared.
3h 17m per day
Rank #131 / 210Nurse hours — State benchmarkedThis home is ranked 131st out of 210 homes in Ohio. Shows adjusted nurse hours per resident per day benchmarked to the Ohio average, with a ranking across 210 Ohio facilities. More hours mean more direct care. The national average is about 3.5 hrs; below 3.0 is a red flag.Rankings are based only on facilities in Ohio that report data for that category. Facilities without available data are excluded from the ranking.Click the rank badge to see the full State ranking.Click here to see the full State ranking.
vs avg
Staff typeHours / Day / Residentvs state avg
Registered Nurse (RN) Info RNs hold the highest nursing license and can assess residents, interpret test results, and direct care plans. More RN hours per day often signals stronger clinical oversight and faster response to health changes. 1h 6m per day
LPN / LVN Info Licensed Practical Nurses (LPNs) or Licensed Vocational Nurses (LVNs) deliver routine hands-on care — medication administration, wound dressing, and monitoring vital signs. They work under RN supervision and make up a large share of daily bedside care. 53m per day
Nurse Aide Info Certified Nurse Aides (CNAs) provide the most direct day-to-day assistance: bathing, dressing, feeding, and mobility. Nurse aide hours are typically the largest staffing category and directly affect residents' quality of life. 1h 49m per day
Weekend Total Nursing Info Combined nursing hours (RN + LPN + Nurse Aide) per resident per day on weekends. Staffing often drops on weekends — this figure reveals whether the facility maintains adequate coverage outside of weekday hours. 3h 29m per day
Physical Therapist Info Hours per resident per day provided by licensed Physical Therapists (PTs) or PT Assistants. PT services help residents recover mobility after injury or illness and are especially important for post-acute (short-stay) rehabilitation. 1m per day
Weekend RN Info Registered nurse hours specifically on weekends. Facilities sometimes reduce RN presence on Saturdays and Sundays — a low weekend RN figure compared to weekday hours can indicate reduced clinical oversight when most administrative staff are absent. 1h 1m per day

Capacity and availability

This home usually has limited availability

Similar occupancy to the state average
Occupancy rate
86% Rank #99 / 211Occupancy rate — State benchmarkedThis home is ranked 99th out of 211 homes in Ohio. Shows this facility's occupancy rate versus the Ohio average, with its Statewide rank out of 211. Higher occupancy signals strong local demand and financial stability.Rankings are based only on facilities in Ohio that report data for that category. Facilities without available data are excluded from the ranking.Click the rank badge to see the full State ranking.Click here to see the full State ranking.
Avg. Length of Stay Info Average number of days residents stay at this facility, based on CMS cost report data. Shorter stays often reflect post-acute or rehab care; longer stays reflect long-term care.
120 days
Bed community size
90-bed community Rank #113 / 323Bed count — State benchmarkedThis home is ranked 113th out of 323 homes in Ohio. Shows this facility's certified or reported bed count compared to other Ohio facilities. Larger communities may offer more amenities, programs, and on-site services for residents and families.Rankings are based only on facilities in Ohio that report data for that category. Facilities without available data are excluded from the ranking.Click the rank badge to see the full State ranking.Click here to see the full State ranking.
A larger shared setting that may offer more common spaces and organized community services.
Walk Score
Walk Score: 27 / 100 Rank #480 / 705Walk Score — State benchmarkedThis home is ranked 480th out of 705 homes in Ohio. Shows how walkable this facility's neighborhood is compared to the average Walk Score across Ohio facilities. Higher scores benefit residents, families, and staff.Rankings are based only on facilities in Ohio that report data for that category. Facilities without available data are excluded from the ranking.Click the rank badge to see the full State ranking.Click here to see the full State ranking.
Somewhat walkable. A few nearby services may be reachable on foot, but most trips require transportation.
BBB Rating
BBB Rating: A+ (Not Accredited)
An independent rating from the Better Business Bureau based on factors such as complaint history, transparency, and business practices.
How BBB ratings work

Staffing

Key information about the people who lead and staff this community.

Leadership

ContactMr. Ron Keller, Executive Director

Contact Senior Star at Dublin Retirement Village

Health Inspection History

Inspections since 2022
Total health inspections 14

State average N/A


Last Health inspection on Feb 2025

Total health citations
61 Rank #192 / 210Health citations — State benchmarkedThis home is ranked 192nd out of 210 homes in Ohio. Shows this facility's total health deficiency citations benchmarked to the Ohio State average, with a ranking across all 210 OH facilities. Lower citation counts earn a better rank.Rankings are based only on facilities in Ohio that report data for that category. Facilities without available data are excluded from the ranking.Click the rank badge to see the full State ranking.Click here to see the full State ranking.

State average N/A

Citations per inspection
4.36 Rank #124 / 210Citations per inspection — State benchmarkedThis home is ranked 124th out of 210 homes in Ohio. Shows average deficiency citations per CMS inspection for this facility versus the Ohio mean across 210 facilities with citation data. Lower is better.Rankings are based only on facilities in Ohio that report data for that category. Facilities without available data are excluded from the ranking.Click the rank badge to see the full State ranking.Click here to see the full State ranking.

State average N/A


Health citations are formal notices following inspections when they fail to comply with safety and care standards.

31 of 61 citations resulted from standard inspections; and 30 of 61 resulted from complaint investigations.

Breakdown of citation severity (last 4 years)
Critical health citations
0
In line with State average

State average: N/A


Serious health citations
3
In line with State average

State average: N/A

0 critical citations State average: N/A

3 serious citations State average: N/A

58 moderate citations State average: N/A

0 minor citations State average: N/A
Citations history (last 4 years)
Infection Control moderate citation Feb 12, 2025
Corrected

Infection Control moderate citation Nov 27, 2024
Corrected

Infection Control moderate citation Nov 27, 2024
Corrected

Infection Control moderate citation Nov 27, 2024
Corrected

Staffing Data

Reporting period: October 1 – December 31, 2025 (Q4 2025). Source: CMS Payroll-Based Journal report.

Total staff 118
Employees 115
Contractors 3
Staff to resident ratio 1.49 : 1
0% compared with State average

State average ratio: 0 : 0

Avg staff/day 44
Average shift 8.7 hours
0% compared with State average

State average: 0 hours

Total staff hours (quarter) 35,057

Nursing staff breakdown

Q4 2025 · Oct 1 – Dec 31 More info This data comes from the CMS Payroll-Based Journal report covering October 1 – December 31, 2025.
Registered Nurse

Manages medical care and health needs.

RN Staff Info All 20 RN Staff are full-time employees. No contractors work on this role. 20
Average shift length Info Average shift length. Calculated as total hours divided by days worked and average staff per day. 9.6 hours
Licensed Practical Nurse

Assists with medical care and medications.

LPN Staff Info All 17 LPN Staff are full-time employees. No contractors work on this role. 17
Average shift length Info Average shift length. Calculated as total hours divided by days worked and average staff per day. 9.8 hours
Certified Nursing Assistant

Helps with daily care and mobility.

CNA Staff Info All 40 CNA Staff are full-time employees. No contractors work on this role. 40
Average shift length Info Average shift length. Calculated as total hours divided by days worked and average staff per day. 9.3 hours

Contractor staffing

Q4 2025 · Oct 1 – Dec 31 More info This data comes from the CMS Payroll-Based Journal report covering October 1 – December 31, 2025.

Total hours from contractors

0.7%

233 contractor hours this quarter

Medical Director: 1 Occupational Therapy Aide: 1 Occupational Therapy Assistant: 1

Staff by category

Q4 2025 · Oct 1 – Dec 31 More info This data comes from the CMS Payroll-Based Journal report covering October 1 – December 31, 2025.
Certified Nursing Assistant4004013,31492100%9.3
Registered Nurse200206,54992100%9.6
Licensed Practical Nurse170175,46792100%9.8
Qualified Activities Professional6062,58592100%8.6
Other Dietary Services Staff3031,0679098%8.6
RN Director of Nursing3031,0426975%8.4
Speech Language Pathologist3039886975%6.3
Clinical Nurse Specialist6069267379%9.1
Physical Therapy Aide2026407177%5.8
Nurse Practitioner3035696470%7.6
Administrator1014425762%7.8
Dental Services Staff1013995358%7.5
Dietitian1012713639%7.5
Qualified Social Worker2022165863%3.7
Physical Therapy Assistant5051825459%3.1
Occupational Therapy Aide0111812830%6.4
Respiratory Therapy Technician2021675054%3.3
Medical Director011301617%1.9
Occupational Therapy Assistant0112233%7.3
40 Certified Nursing Assistant
% of Days 100%
20 Registered Nurse
% of Days 100%
17 Licensed Practical Nurse
% of Days 100%
6 Qualified Activities Professional
% of Days 100%
3 Other Dietary Services Staff
% of Days 98%
3 RN Director of Nursing
% of Days 75%
3 Speech Language Pathologist
% of Days 75%
6 Clinical Nurse Specialist
% of Days 79%
2 Physical Therapy Aide
% of Days 77%
3 Nurse Practitioner
% of Days 70%
1 Administrator
% of Days 62%
1 Dental Services Staff
% of Days 58%
1 Dietitian
% of Days 39%
2 Qualified Social Worker
% of Days 63%
5 Physical Therapy Assistant
% of Days 59%
1 Occupational Therapy Aide
% of Days 30%
2 Respiratory Therapy Technician
% of Days 54%
1 Medical Director
% of Days 17%
1 Occupational Therapy Assistant
% of Days 3%

Penalties and fines

Includes penalties issued in 2023-2024

Federal penalties imposed by CMS for regulatory violations, including civil money penalties (fines) and denials of payment for new Medicare/Medicaid admissions.

Source: CMS Penalties Database (Data as of Jan 2026)

Total fines amount $95K Rank #183 / 211Federal fines — State benchmarkedThis home is ranked 183rd out of 211 homes in Ohio. Shows this facility's cumulative CMS federal fine dollars versus the Ohio average among facilities with fines, and where it ranks among 211 facilities in the pool. Lower total dollars mean a better rank.Rankings are based only on facilities in Ohio that report data for that category. Facilities without available data are excluded from the ranking.Click the rank badge to see the full State ranking.Click here to see the full State ranking.
38% higher than State average

State average: $69K

Number of fines 6
224% more fines than State average

State average: 1.9

Payment Denials Info Serious action where Medicare and/or Medicaid temporarily stops payments for new residents until issues are fixed. 0
100% fewer payment denials than State average

State average: 0.5

Fines amount comparison
This facility $95K
State average $69K
Penalty History

Penalties are imposed by CMS for violations of federal nursing home regulations.

5 penalties in the past 3 years

Multiple penalties were reported in the last 3 years.

Civil Money Penalty Info Fines imposed for noncompliance, which can be assessed per day or per instance of violation. Mar 25, 2024
$45K
Civil Money Penalty Info Fines imposed for noncompliance, which can be assessed per day or per instance of violation. Feb 20, 2024
$5K
Civil Money Penalty Info Fines imposed for noncompliance, which can be assessed per day or per instance of violation. Feb 12, 2024
$4K
Civil Money Penalty Info Fines imposed for noncompliance, which can be assessed per day or per instance of violation. Jan 22, 2024
$10K

Last updated: Jan 2026

Quality of care over time

These measures show how residents usually do over time at this home, based on health outcomes and preventive care.

High-risk clinical events score Info A composite score based on pressure ulcers, falls with injury, weight loss, walking ability decline, and activities of daily living decline. 4.8
18% better than State average

State average: 5.8

Functional decline score Info A composite score based on activities of daily living decline, walking ability decline, and incontinence. 13.5
6% worse than State average

State average: 12.7

Long-stay resident measures
Need for Help with Daily Activities Increased Info Percent of long-stay residents whose need for help with daily activities has increased 3.0%
57% better than State average

State average: 6.8%

Walking Ability Worsened Info Percent of long-stay residents whose ability to move independently worsened 7.9%
12% better than State average

State average: 8.9%

Low Risk Residents with Bowel/Bladder Incontinence Info Percent of low risk long-stay residents who lose control of their bowels or bladder 29.6%
35% worse than State average

State average: 22.0%

Falls with Major Injury Info Percent of long-stay residents experiencing one or more falls with major injury 2.1%
39% better than State average

State average: 3.4%

High Risk Residents with Pressure Ulcers Info Percent of long-stay high risk residents with pressure ulcers 6.7%
73% worse than State average

State average: 3.9%

Urinary Tract Infection Info Percent of long-stay residents with a urinary tract infection 0.7%
28% worse than State average

State average: 0.5%

Lost Too Much Weight Info Percent of long-stay residents who lose too much weight 4.3%
31% better than State average

State average: 6.2%

Depressive Symptoms Info Percent of long-stay residents who have depressive symptoms 25.2%
5% worse than State average

State average: 24.0%

Antipsychotic Use Info Percent of long-stay residents who received an antipsychotic medication 2.3%
73% better than State average

State average: 8.4%

Pneumococcal Vaccine Info Percent of long-stay residents assessed and appropriately given the pneumococcal vaccine 67.6%
27% worse than State average

State average: 92.4%

Influenza Vaccine Info Percent of long-stay residents assessed and appropriately given the seasonal influenza vaccine 89.3%
5% worse than State average

State average: 94.5%

Short-stay resident measures
Pneumococcal Vaccine Info Percent of short-stay residents assessed and appropriately given the pneumococcal vaccine 28.8%
63% worse than State average

State average: 78.0%

Antipsychotic medication increase Info Percent of short-stay residents who newly received an antipsychotic medication 1.6%
25% worse than State average

State average: 1.3%

Influenza Vaccine Info Percent of short-stay residents assessed and appropriately given the seasonal influenza vaccine 54.6%
28% worse than State average

State average: 75.6%

Breakdown by payment type

Medicare

17% of new residents, usually for short-term rehab.

Typical stay 1 - 2 months

Private pay

72% of new residents, often for short stays.

Typical stay 4 months

Medicaid

11% of new residents, often for long-term daily care.

Typical stay 7 - 8 months

Facility Characteristics

Source: CMS Long-Term Care Facility Characteristics (Data as of Jan 2026)

Total residents 79
Medicare
5
6.3% of residents
Medicaid
66
83.5% of residents
Private pay or other
8
10.1% of residents
Programs & Services
Residents Group

Residents meet regularly to discuss policies, care quality, and activities

Active Resident Council

Organized group of residents that meets regularly to discuss facility policies, quality of life, and activities.

Finances and operations

Based on CMS SNF Cost Report for fiscal year ending in 12/2023.

For-profit
Operated by a single business entity.
Net patient revenue Info Net patient revenue — what the home actually collects for resident care, after contractual allowances, bad debt and discounts are subtracted from its gross charges (CMS cost report, Worksheet G-3). It covers resident care only; money the home earns from other sources is shown separately as "Other income."
$10.7M
Net patient income Info Net patient income: net patient revenue minus the home's total operating expenses. A positive figure means it earns more from resident care than it spends to deliver it; a negative figure means the opposite. It excludes non-operating "other income."
-$1.5M
For-profit Operated by a single business entity.
Net patient revenue Info Net patient revenue — what the home actually collects for resident care, after contractual allowances, bad debt and discounts are subtracted from its gross charges (CMS cost report, Worksheet G-3). It covers resident care only; money the home earns from other sources is shown separately as "Other income."
$10.7M Rank #65 / 210Revenue — State benchmarkedThis home is ranked 65th out of 210 homes in Ohio. Shows this facility's annual revenue compared to the Ohio average. Higher revenue generally means more resources for staffing and capital — read alongside Payroll %.Rankings are based only on facilities in Ohio that report data for that category. Facilities without available data are excluded from the ranking.Click the rank badge to see the full State ranking.Click here to see the full State ranking.
Net patient income Info Net patient income: net patient revenue minus the home's total operating expenses. A positive figure means it earns more from resident care than it spends to deliver it; a negative figure means the opposite. It excludes non-operating "other income."
-$1.5M
Other income Info Money the home earns outside of resident care — such as investments, grants, rentals and other non-operating sources (CMS cost report, Worksheet G-3). It is tracked separately from net patient revenue: it is not part of that figure, and it is not included in net patient income.
$191.8K
Payroll costs Info Staff salaries plus wage-related costs — benefits such as payroll taxes, health insurance and retirement — from the home's own accounting records (CMS cost report, Worksheet A). Contract or agency labor is counted separately, under other operating costs. Rank #43 / 210Payroll — State benchmarkedThis home is ranked 43rd out of 210 homes in Ohio. Shows total annual staff payroll benchmarked to the Ohio average. Higher payroll investment relative to peers often signals better staffing and less reliance on cheaper contract labor.Rankings are based only on facilities in Ohio that report data for that category. Facilities without available data are excluded from the ranking.Click the rank badge to see the full State ranking.Click here to see the full State ranking.
$7.3M 68.6% of net patient revenue Info Payroll as a share of revenue: staff salaries and wage-related benefits divided by net patient revenue. A higher figure means more of each revenue dollar goes to staff pay. Rank #40 / 210Payroll % — State benchmarkedThis home is ranked 40th out of 210 homes in Ohio. Shows payroll as a percentage of revenue versus the Ohio average. Well-run Ohio facilities typically land around 54–64% — the top third Statewide. Below 25% may signal understaffing or heavy agency use — read with Staffing ratings.Rankings are based only on facilities in Ohio that report data for that category. Facilities without available data are excluded from the ranking.Click the rank badge to see the full State ranking.Click here to see the full State ranking.
Other operating costs Info Everything it costs to run the home apart from payroll — food, utilities, supplies, maintenance, contract labor and administration. Calculated as total operating expense minus payroll (staff salaries and wage-related benefits).
$4.8M
Total costs Info The home's total operating expense for the year — all the costs of running it, salaries included (CMS cost report, Worksheet G-3).
$12.1M

What does this home offer?

Pets allowed icon
Pets allowed icon

Pets Allowed

Housing options icon

Housing Options: Studio / 1 Bed / 2 Bed

Building type icon
Building type icon

Building Type: 3-story

Beauty services icon

Beauty Services

Transportation services icon

Transportation Services

Housekeeping icon
Housekeeping icon

Housekeeping Services

Social and recreational activities icon

Social and Recreational Activities

Exercise program icon

Exercise Programs

Who this home usually serves

TYPE OF STAY

Primarily short stays

Residents typically stay for brief periods, with frequent admissions and discharges throughout the year.

Most new residents arrive under private pay (72% of admissions), and a typical private pay stay runs around 4 months.

Admissions
235 total

Coverage residents most often arrive under.

Medicare 17%
Private pay 72%
Medicaid 11%
Discharges
235 total

Coverage residents most often leave under.

Medicare 17%
Private pay 72%
Medicaid 11%

Places of interest near Senior Star at Dublin Retirement Village

Address 1.4 miles from city center Info Estimated distance in miles from Dublin's city center to Senior Star at Dublin Retirement Village's address, calculated via Google Maps.

Calculate Travel Distance to Senior Star at Dublin Retirement Village

Add your location

Address

Compare Nursing Homes around the area

The information below is reported by the Ohio Department of Health, Bureau of Survey and Certification.

Brookdale Westlake Village
NH
AL
IL
MC
SNF
Westlake -60 A+ 25 1 Bed / 2 Bed
Elizabeth Scott Community
NH
AL
MC
SNF
Maumee -60 A+ 0 Studio / 1 Bed
Senior Star at Dublin Retirement Village
NH
AL
IL
MC
Dublin -90 A+ 27 Studio / 1 Bed / 2 Bed

Frequently Asked Questions about Senior Star at Dublin Retirement Village

Is Senior Star at Dublin Retirement Village in a walkable area?

Senior Star at Dublin Retirement Village has a walk score of 27. Somewhat walkable. A few nearby services may be reachable on foot, but most trips require transportation.

What is the occupancy rate at Senior Star at Dublin Retirement Village?

Senior Star at Dublin Retirement Village's occupancy is 86.0%.

Does Senior Star at Dublin Retirement Village operate as a for-profit or non-profit?

Senior Star at Dublin Retirement Village is registered as a for-profit in OH.

Are there photos of Senior Star at Dublin Retirement Village?

Yes — there are 4 photos of Senior Star at Dublin Retirement Village in the photo gallery on this page.

What is the address of Senior Star at Dublin Retirement Village?

Senior Star at Dublin Retirement Village is located at 6470 Post Rd, Dublin, OH 43016.

What is the phone number of Senior Star at Dublin Retirement Village?

(614) 602-6749 will put you in contact with the team at Senior Star at Dublin Retirement Village.

Is Senior Star at Dublin Retirement Village Medicare or Medicaid certified?

Yes — Senior Star at Dublin Retirement Village is a CMS-certified provider of Medicare and Medicaid.

Guides for Better Senior Living

Care Cost Calculator: See Prices in Your Area

Nursing Home Data Explorer

Don’t Wait Too Long: 7 Red Flag Signs Your Parent Needs Assisted Living Now

The True Cost of Assisted Living in 2025 – And How Families Are Paying For It

Understanding Senior Living Costs: Pricing Models, Discounts & Financial Assistance