Sheridan Manor Nursing Home
Nursing Home · Buffalo, NY
CMS overall rating Info The Overall CMS Rating is scored from 1 to 5 stars and combines results from health inspections, staffing levels, and quality measures. Health inspections carry the most weight. Staffing and quality scores can increase or decrease the final rating based on performance compared to state and national standards.

Sheridan Manor Nursing Home

Nursing Home · Buffalo, NY
CMS overall rating Info The Overall CMS Rating is scored from 1 to 5 stars and combines results from health inspections, staffing levels, and quality measures. Health inspections carry the most weight. Staffing and quality scores can increase or decrease the final rating based on performance compared to state and national standards.
Calculator: See prices in your area
Sheridan Manor Nursing Home accepts Medicare, Medicaid, and private pay.

Overview of Sheridan Manor Nursing Home

Sheridan Manor LLC is a distinguished senior living provider in Tonawanda, New York. Specializing in Nursing Homes and Continuing Care Communities, their commitment is to offer senior residents exceptional care and a vibrant living experience.

With a focus on ensuring the well-being and comfort of senior residents, Sheridan Manor LLC provides a range of services tailored to their unique needs. The dedicated staff and welcoming environment create a supportive community where residents can thrive. Whether seeking comprehensive nursing care or a continuum of services in a Continuing Care Community, Sheridan Manor LLC is dedicated to providing the highest quality of care and enhancing the lives of senior residents. 

(716) 837-4466

Quality ratings

Measured by Centers for Medicare & Medicaid Services (CMS)

Overall rating Info The Overall CMS Rating combines results from health inspections, staffing levels and quality measures. Health inspections carry the most weight. Staffing and quality scores can increase or decrease the final rating based on performance compared to state and national standards.
▲ 62.7% Above NY avg. ▲ 62.7% Above NY avg.Click the badge to see the full State ranking.Click here to see the full State ranking.
Health Inspection Info Based on the results of the facility's three most recent standard inspections and any complaint investigations. CMS reviews the number, scope, and severity of deficiencies, with more recent findings weighted more heavily.
▲ 76.7% Above NY avg. ▲ 76.7% Above NY avg.Click the badge to see the full State ranking.Click here to see the full State ranking.
Staffing Info Measures average nursing staff hours per resident per day, including Registered Nurses (RNs) and total nursing staff. Ratings are adjusted based on the level of care residents require and are compared to state and national benchmarks.
▲ 10.4% Above NY avg. ▲ 10.4% Above NY avg.Click the badge to see the full State ranking.Click here to see the full State ranking.
Quality Measures Info Based on clinical and physical health indicators reported to CMS, such as hospital readmissions, falls, pressure ulcers, and improvements in mobility. These measures reflect how well residents' health needs are being managed.
▼ 47.6% Below NY avg. ▼ 47.6% Below NY avg.Click the badge to see the full State ranking.Click here to see the full State ranking.

Staffing hours breakdown

Info Daily nursing hours per resident by staff type, reported to CMS. Higher is generally better — compare this facility to state and national averages to see where staffing stands.

Hours per resident per day — compared to New York state averages

Total nursing care / resident Info This home is ranked 60th out of 388 homes in New York. Total adjusted nursing hours per resident per day, combining RN, LPN, and aide time. CMS adjusts this for case-mix so facilities can be fairly compared.
4h 13m per day
Rank #60 / 388Nurse hours — State benchmarkedThis home is ranked 60th out of 388 homes in New York. Shows adjusted nurse hours per resident per day benchmarked to the New York average, with a ranking across 388 New York SNFs. More hours mean more direct care. The national average is about 3.5 hrs; below 3.0 is a red flag.Click the rank badge to see the full State ranking.Click here to see the full State ranking.
This facility New York avg (3h 35m per day)
vs New York avg
+18%

3 of 6 metrics below state avg

Standout metric LPN / LVN is +26% above state avg
Staff typeHours / Day / Residentvs state avg
Registered Nurse (RN) Info RNs hold the highest nursing license and can assess residents, interpret test results, and direct care plans. More RN hours per day often signals stronger clinical oversight and faster response to health changes. 39m per day ▼ 7% State avg: 42m per day · National avg: 41m per day
LPN / LVN Info Licensed Practical Nurses (LPNs) or Licensed Vocational Nurses (LVNs) deliver routine hands-on care — medication administration, wound dressing, and monitoring vital signs. They work under RN supervision and make up a large share of daily bedside care. 58m per day ▲ 26% State avg: 46m per day · National avg: 52m per day
Nurse Aide Info Certified Nurse Aides (CNAs) provide the most direct day-to-day assistance: bathing, dressing, feeding, and mobility. Nurse aide hours are typically the largest staffing category and directly affect residents' quality of life. 2h 8m per day ■ Avg State avg: 2h 11m per day · National avg: 2h 21m per day
Weekend Total Nursing Info Combined nursing hours (RN + LPN + Nurse Aide) per resident per day on weekends. Staffing often drops on weekends — this figure reveals whether the facility maintains adequate coverage outside of weekday hours. 3h 28m per day ▲ 9% State avg: 3h 10m per day · National avg: 3h 26m per day
Physical Therapist Info Hours per resident per day provided by licensed Physical Therapists (PTs) or PT Assistants. PT services help residents recover mobility after injury or illness and are especially important for post-acute (short-stay) rehabilitation. 6m per day ▼ 14% State avg: 7m per day · National avg: 4m per day
Weekend RN Info Registered nurse hours specifically on weekends. Facilities sometimes reduce RN presence on Saturdays and Sundays — a low weekend RN figure compared to weekday hours can indicate reduced clinical oversight when most administrative staff are absent. 22m per day ▼ 21% State avg: 28m per day · National avg: 29m per day

Capacity and availability

This home usually has limited availability

Occupancy between 85% and 95% suggests balanced demand.

Lower occupancy than the New York average: 88.3%
Occupancy rate 87.1% Rank #300 / 433Occupancy rate — State benchmarkedThis home is ranked 300th out of 433 homes in New York. Shows this facility's occupancy rate versus the New York average, with its Statewide rank out of 433. Higher occupancy signals strong local demand and financial stability.Click the rank badge to see the full State ranking.Click here to see the full State ranking.
Avg. Length of Stay 152 days
Occupancy rate
87.1% Rank #300 / 433Occupancy rate — State benchmarkedThis home is ranked 300th out of 433 homes in New York. Shows this facility's occupancy rate versus the New York average, with its Statewide rank out of 433. Higher occupancy signals strong local demand and financial stability.Click the rank badge to see the full State ranking.Click here to see the full State ranking.
Avg. Length of Stay
152 days
Walk Score
Walk Score: 77 / 100 Rank #498 / 1167Walk Score — State benchmarkedThis home is ranked 498th out of 1167 homes in New York. Shows how walkable this facility's neighborhood is compared to the average Walk Score across New York SNFs. Higher scores benefit residents, families, and staff.Click the rank badge to see the full State ranking.Click here to see the full State ranking.
Very walkable. Most errands can be accomplished on foot, and many essentials are within a short walk.

Contact Sheridan Manor Nursing Home

Staffing Data

Reporting period: October 1 – December 31, 2025 (Q4 2025). Source: CMS Payroll-Based Journal report.

Total staff 83
Employees 80
Contractors 3
Staff to resident ratio 2.02:1
1055% better than New York average
New York average ratio: 0.18:1 New York average ratio: 0.18:1See full New York ranking
Avg staff/day 30
Average shift 6.9 hours
10% worse than New York average
New York average: 7.7 hours New York average shift: 7.7 hoursSee full New York ranking
Total staff hours (quarter) 19,176

Nursing staff breakdown

Q4 2025 · Oct 1 – Dec 31 More info This data comes from the CMS Payroll-Based Journal report covering October 1 – December 31, 2025.
Registered Nurse

Manages medical care and health needs.

RN Staff 3
Average shift length Info Average shift length. Calculated as total hours divided by days worked and average staff per day. 8.4 hours

No contractors work on this role.

Licensed Practical Nurse

Assists with medical care and medications.

LPN Staff 13
Average shift length Info Average shift length. Calculated as total hours divided by days worked and average staff per day. 7.9 hours

No contractors work on this role.

Certified Nursing Assistant

Helps with daily care and mobility.

CNA Staff 35
Average shift length Info Average shift length. Calculated as total hours divided by days worked and average staff per day. 6.9 hours

No contractors work on this role.

Contractor staffing

Q4 2025 · Oct 1 – Dec 31 More info This data comes from the CMS Payroll-Based Journal report covering October 1 – December 31, 2025.

Total hours from contractors

0.7%

137 contractor hours this quarter

Occupational Therapy Aide: 1 Occupational Therapy Assistant: 1 Medical Director: 1

Staff by category

Q4 2025 · Oct 1 – Dec 31 More info This data comes from the CMS Payroll-Based Journal report covering October 1 – December 31, 2025.
Certified Nursing Assistant350358,17292100%6.9
Licensed Practical Nurse130134,22092100%7.9
Registered Nurse3038928491%8.4
Other Dietary Services Staff3038307582%7.3
Nurse Aide in Training3036526975%7.9
Physical Therapy Assistant4045236368%7.5
Respiratory Therapy Technician5055016470%7.8
Mental Health Service Worker1014796065%8
Administrator1014645863%8
Nurse Practitioner1014625863%8
Physical Therapy Aide2024496267%6.9
Speech Language Pathologist1014296166%7
Dietitian1013665964%6.2
Clinical Nurse Specialist3033304347%7
Qualified Social Worker2021775863%3.1
Occupational Therapy Aide2131404246%2.8
Medical Director011693639%1.9
Occupational Therapy Assistant011221011%2.2
35 Certified Nursing Assistant
% of Days 100%
13 Licensed Practical Nurse
% of Days 100%
3 Registered Nurse
% of Days 91%
3 Other Dietary Services Staff
% of Days 82%
3 Nurse Aide in Training
% of Days 75%
4 Physical Therapy Assistant
% of Days 68%
5 Respiratory Therapy Technician
% of Days 70%
1 Mental Health Service Worker
% of Days 65%
1 Administrator
% of Days 63%
1 Nurse Practitioner
% of Days 63%
2 Physical Therapy Aide
% of Days 67%
1 Speech Language Pathologist
% of Days 66%
1 Dietitian
% of Days 64%
3 Clinical Nurse Specialist
% of Days 47%
2 Qualified Social Worker
% of Days 63%
3 Occupational Therapy Aide
% of Days 46%
1 Medical Director
% of Days 39%
1 Occupational Therapy Assistant
% of Days 11%

Penalties and fines

Federal penalties imposed by CMS for regulatory violations, including civil money penalties (fines) and denials of payment for new Medicare/Medicaid admissions.

Source: CMS Penalties Database

No penalties in the past 3 years

No civil money penalties or payment denials were reported in the last 3 years.

Quality of care over time

These measures show how residents usually do over time at this home, based on health outcomes and preventive care.

High-risk clinical events score Info A composite score based on pressure ulcers, falls with injury, weight loss, walking ability decline, and activities of daily living decline. 15.3
56% worse than New York average

New York average: 9.8

Functional decline score Info A composite score based on activities of daily living decline, walking ability decline, and incontinence. 30.4
68% worse than New York average

New York average: 18.1

Long-stay resident measures
Significantly above average Info CMS star rating based on long-stay quality measure performance. 5 stars = significantly above average, 1 star = significantly below average.
Need for Help with Daily Activities Increased Info Percent of long-stay residents whose need for help with daily activities has increased 26.5%
61% worse than New York average

New York average: 16.4%

Walking Ability Worsened Info Percent of long-stay residents whose ability to move independently worsened 30.3%
83% worse than New York average

New York average: 16.6%

Low Risk Residents with Bowel/Bladder Incontinence Info Percent of low risk long-stay residents who lose control of their bowels or bladder 34.3%
61% worse than New York average

New York average: 21.4%

Falls with Major Injury Info Percent of long-stay residents experiencing one or more falls with major injury 2.8%
5% better than New York average

New York average: 3.0%

High Risk Residents with Pressure Ulcers Info Percent of long-stay high risk residents with pressure ulcers 10.8%
51% worse than New York average

New York average: 7.2%

Urinary Tract Infection Info Percent of long-stay residents with a urinary tract infection 4.3%
207% worse than New York average

New York average: 1.4%

Lost Too Much Weight Info Percent of long-stay residents who lose too much weight 6.3%
In line with New York average

New York average: 6.1%

Depressive Symptoms Info Percent of long-stay residents who have depressive symptoms 0.9%
95% better than New York average

New York average: 18.1%

Antipsychotic Use Info Percent of long-stay residents who received an antipsychotic medication 16.3%
30% worse than New York average

New York average: 12.6%

Pneumococcal Vaccine Info Percent of long-stay residents assessed and appropriately given the pneumococcal vaccine 74.5%
18% worse than New York average

New York average: 91.4%

Influenza Vaccine Info Percent of long-stay residents assessed and appropriately given the seasonal influenza vaccine 97.4%
In line with New York average

New York average: 95.2%

Short-stay resident measures
Below average Info CMS star rating based on short-stay quality measure performance. 5 stars = much above average, 1 star = much below average.
Pneumococcal Vaccine Info Percent of short-stay residents assessed and appropriately given the pneumococcal vaccine 88.0%
15% better than New York average

New York average: 76.6%

Antipsychotic medication increase Info Percent of short-stay residents who newly received an antipsychotic medication 2.0%
57% worse than New York average

New York average: 1.3%

Influenza Vaccine Info Percent of short-stay residents assessed and appropriately given the seasonal influenza vaccine 83.8%
6% better than New York average

New York average: 78.8%

Re-hospitalized after SNF stay Info Percentage of short-stay residents who were re-hospitalized after their nursing home admission. 26.9%
31% worse than New York average

New York average: 20.6%
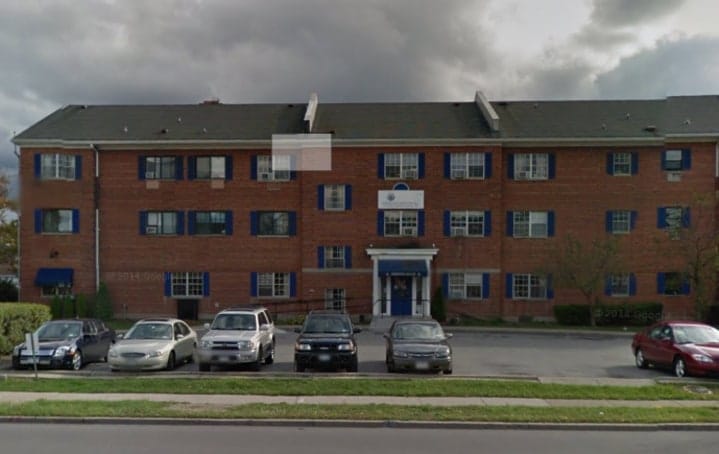
Emergency department visits Info Percentage of short-stay residents who had an outpatient emergency department visit. 17.0%
75% worse than New York average

New York average: 9.7%

Falls with major injury Info Percentage of SNF residents who experience falls with major injury during their stay. 2.4%
209% worse than New York average

New York average: 0.8%

Ability to care for self at discharge Info Percentage of residents at or above expected ability to care for themselves at discharge. 63.3%
18% better than New York average

New York average: 53.7%

Successful return to home or community Info Rate of successful return to home or community from a skilled nursing facility. 43.0%
15% worse than New York average

New York average: 50.6%

Breakdown by payment type

Medicare

26% of new residents, usually for short-term rehab.

Typical stay 1 - 2 months

Private pay

65% of new residents, often for short stays.

Typical stay 1 - 2 months

Medicaid

10% of new residents, often for long-term daily care.

Typical stay 3 years

Facility Characteristics

Source: CMS Long-Term Care Facility Characteristics (Data as of Jan 2026)

Total residents 41
Medicare
4
9.8% of residents
Medicaid
31
75.6% of residents
Private pay or other
6
14.6% of residents
Programs & Services
Residents Group

Residents meet regularly to discuss policies, care quality, and activities

Nurse Aide Training

State-approved Nurse Aide Training and Competency Evaluation Program on-site

Active Resident Council

Organized group of residents that meets regularly to discuss facility policies, quality of life, and activities.

Finances and operations

Privately-owned community
Operated by a business corporation.
Home revenue
$8.5M
Operating loss
-$167.6K
Privately-owned community Operated by a business corporation.
Home revenue
$8.5M Rank #370 / 383Revenue — State benchmarkedThis home is ranked 370th out of 383 homes in New York. Shows this facility's annual revenue compared to the New York SNF average. Higher revenue generally means more resources for staffing and capital — read alongside Payroll %.Click the rank badge to see the full State ranking.Click here to see the full State ranking.
Operating loss
-$167.6K
Payroll costs Info The portion of the home's budget spent on staff, including nurses, caregivers, and other employees who support care and operations. Rank #379 / 383Payroll — State benchmarkedThis home is ranked 379th out of 383 homes in New York. Shows total annual staff payroll benchmarked to the New York average. Higher payroll investment relative to peers often signals better staffing and less reliance on cheaper contract labor.Click the rank badge to see the full State ranking.Click here to see the full State ranking.
$2.9M
34.6% of revenue Rank #355 / 383Payroll % — State benchmarkedThis home is ranked 355th out of 383 homes in New York. Shows payroll as a percentage of revenue versus the New York average. Well-run New York SNFs typically land around 53–65% — the top third Statewide. Below 25% may signal understaffing or heavy agency use — read with Staffing ratings.Click the rank badge to see the full State ranking.Click here to see the full State ranking.
Other operating costs Info All remaining costs needed to run the home, such as food, utilities, building maintenance, supplies and administrative expenses.
$5.7M
Total costs $8.6M

Who this home usually serves

TYPE OF STAY

Primarily short stays

Residents typically stay for brief periods, with frequent admissions and discharges throughout the year.

Places of interest near Sheridan Manor Nursing Home

Address 2.2 miles from city center Info Estimated distance in miles from Tonawanda Town's city center to Sheridan Manor Nursing Home's address, calculated via Google Maps.

Calculate Travel Distance to Sheridan Manor Nursing Home

Add your location

Address

Financial Assistance for
Nursing Home in New York

Sheridan Manor Nursing Home is located in Tonawanda Town, New York.
Here are the financial assistance programs available to residents in New York.

Get Financial aid guidance

Community First Choice Option

NY Medicaid CFCO

Age 65+ or disabled
General New York resident, Medicaid- eligible, care need (not necessarily nursing home level).
Income Limits (2025) ~$2,829/month 300% FBR, individual
Asset Limits $30,182 individual, higher due to NY Medicaid expansion
NY

Higher asset limit; urban density increases demand.

Benefits
Personal care (5-7 hours/day) Respite care (240 hours/year) Home modifications ($1,500 avg.) Assistive technology ($500 avg.)

Expanded In-Home Services for the Elderly Program (EISEP)

NY EISEP

Age 60+
General New York resident, at risk of decline but not nursing home level.
Income Limits ~$2,500/month individual, varies
Asset Limits $15,000 individual
NY

Cost-sharing required above certain income; urban/rural balance.

Benefits
In-home care (3-5 hours/week) Respite (up to 10 days/year) Case management Transportation (~5 trips/month)

Senior Citizen Rent Increase Exemption (SCRIE)

NY SCRIE

Age 62+
General NYC resident, live in rent-controlled/stabilized apartment, spend >1/3 of income on rent.
Income Limits (2025) $50,000/year household
Asset Limits No strict asset cap, but income-focused eligibility.
NY

Limited to NYC’s rent-regulated units; high demand in urban areas.

Benefits
Rent freeze (e.g., covers increases of $50-$200+/month); tax credit for landlord

Senior Citizen Homeowners’ Exemption (SCHE)

NY SCHE

Age 65+
General NYC resident, own and live in a 1-3 family home, co-op, or condo.
Income Limits (2025) $58,399/year household
Asset Limits No strict asset cap, income-driven eligibility.
NY

Applies only in NYC; excludes large apartment buildings.

Benefits
Property tax reduction (5-50%, e.g., $500-$5,000/year based on income and property value)

New York Foundation for Senior Citizens (NYFSC) Home Sharing Program

NYFSC Home Sharing

Age One participant must be 60+ (host or guest)
General NYC resident, able to share living space.
Income Limits No strict limit, but targets those needing cost relief.
Asset Limits Not applicable; focus on housing need.
NY

Primarily NYC-focused; limited slots due to demand.

Benefits
Shared housing (reduces rent/living costs by 30-50%, e.g., $500-$1,000/month savings); optional light assistance between housemates

Compare Nursing Home around Buffalo

The information below is reported by the New York State Department of Health.

5 facilities compared · CMS & NY Dept. of Health data

Filter by care type
Edison Home Health Care
NH

Nursing Home Licensed facility providing 24/7 skilled nursing care for residents with complex, ongoing medical needs. Staffed by RNs, LPNs, and CNAs. Inspected and star-rated annually by CMS. Accepts Medicare (short-term rehab) and Medicaid (long-term care).

AL

Assisted Living A licensed, long-term care setting for seniors or individuals with disabilities who need help with daily activities — like bathing, dressing, and medication management — but not 24-hour skilled nursing. Offers housing, meals, and around-the-clock support while aiming to maximize resident independence.

Buffalo (Leroy)80--4.77 -7%+33%$093.0-75 74 ----335419
Sheridan Manor Nursing Home
NH

Nursing Home Licensed facility providing 24/7 skilled nursing care for residents with complex, ongoing medical needs. Staffed by RNs, LPNs, and CNAs. Inspected and star-rated annually by CMS. Accepts Medicare (short-term rehab) and Medicaid (long-term care).

AL

Assisted Living A licensed, long-term care setting for seniors or individuals with disabilities who need help with daily activities — like bathing, dressing, and medication management — but not 24-hour skilled nursing. Offers housing, meals, and around-the-clock support while aiming to maximize resident independence.

Tonawanda Town (Sheridan Drive)44 87.1% -1%4.21 -71%+18%$0147.0-40 77 -$8.5M$2.9M34.6%335366
Schofield Residence Nursing Facility
NH

Nursing Home Licensed facility providing 24/7 skilled nursing care for residents with complex, ongoing medical needs. Staffed by RNs, LPNs, and CNAs. Inspected and star-rated annually by CMS. Accepts Medicare (short-term rehab) and Medicaid (long-term care).

AL

Assisted Living A licensed, long-term care setting for seniors or individuals with disabilities who need help with daily activities — like bathing, dressing, and medication management — but not 24-hour skilled nursing. Offers housing, meals, and around-the-clock support while aiming to maximize resident independence.

Buffalo (Elmwood North)120 99.9% +13%4.10 -69%+14%$0153.8-105 60 James Cambell$25.6M$11.2M43.9%335603
Terrace View Long-Term Care
NH

Nursing Home Licensed facility providing 24/7 skilled nursing care for residents with complex, ongoing medical needs. Staffed by RNs, LPNs, and CNAs. Inspected and star-rated annually by CMS. Accepts Medicare (short-term rehab) and Medicaid (long-term care).

AL

Assisted Living A licensed, long-term care setting for seniors or individuals with disabilities who need help with daily activities — like bathing, dressing, and medication management — but not 24-hour skilled nursing. Offers housing, meals, and around-the-clock support while aiming to maximize resident independence.

Buffalo (East Side)390--5.21 +31%+45%$0155.0-379 46 ----335650
The Grand Rehabilitation and Nursing at Delaware Park
NH

Nursing Home Licensed facility providing 24/7 skilled nursing care for residents with complex, ongoing medical needs. Staffed by RNs, LPNs, and CNAs. Inspected and star-rated annually by CMS. Accepts Medicare (short-term rehab) and Medicaid (long-term care).

AL

Assisted Living A licensed, long-term care setting for seniors or individuals with disabilities who need help with daily activities — like bathing, dressing, and medication management — but not 24-hour skilled nursing. Offers housing, meals, and around-the-clock support while aiming to maximize resident independence.

Buffalo (Elmwood Village)95 92.1% +4%3.28 -40%-8%$0194.8-88 0 Elliot Strauss$11.0M$7.5M67.9%335640

Frequently Asked Questions about Sheridan Manor Nursing Home

What neighborhood is Sheridan Manor Nursing Home in?

Sheridan Manor Nursing Home is in the Sheridan Drive neighborhood.

Is Sheridan Manor Nursing Home in a walkable area?

Sheridan Manor Nursing Home has a walk score of 77. Very walkable. Most errands can be accomplished on foot, and many essentials are within a short walk.

What is the address of Sheridan Manor Nursing Home?

Sheridan Manor Nursing Home is located at 2799 Sheridan Dr, Tonawanda Town, NY 14150.

What is the phone number of Sheridan Manor Nursing Home?

(716) 837-4466 will put you in contact with the team at Sheridan Manor Nursing Home.

Is Sheridan Manor Nursing Home Medicare or Medicaid certified?

Yes — Sheridan Manor Nursing Home is a CMS-certified provider of Medicare and Medicaid.

Guides for Better Senior Living

Care Cost Calculator: See Prices in Your Area

Nursing Home Data Explorer

Don’t Wait Too Long: 7 Red Flag Signs Your Parent Needs Assisted Living Now

The True Cost of Assisted Living in 2025 – And How Families Are Paying For It

Understanding Senior Living Costs: Pricing Models, Discounts & Financial Assistance

Explore Open Rooms
1 Contact details
2 What type of senior care service are you looking for?
3 What budget do you have in mind for senior care?
4 How soon do you need to find care?
5 Additional details

Thank you for your interest!

Our team will be in touch shortly to help with next steps.