

Total health inspections
7
Massachusetts average 4.5
Last Health inspection on Jun 2025

We arrange tours, appointments, and even moving support so you don’t have to
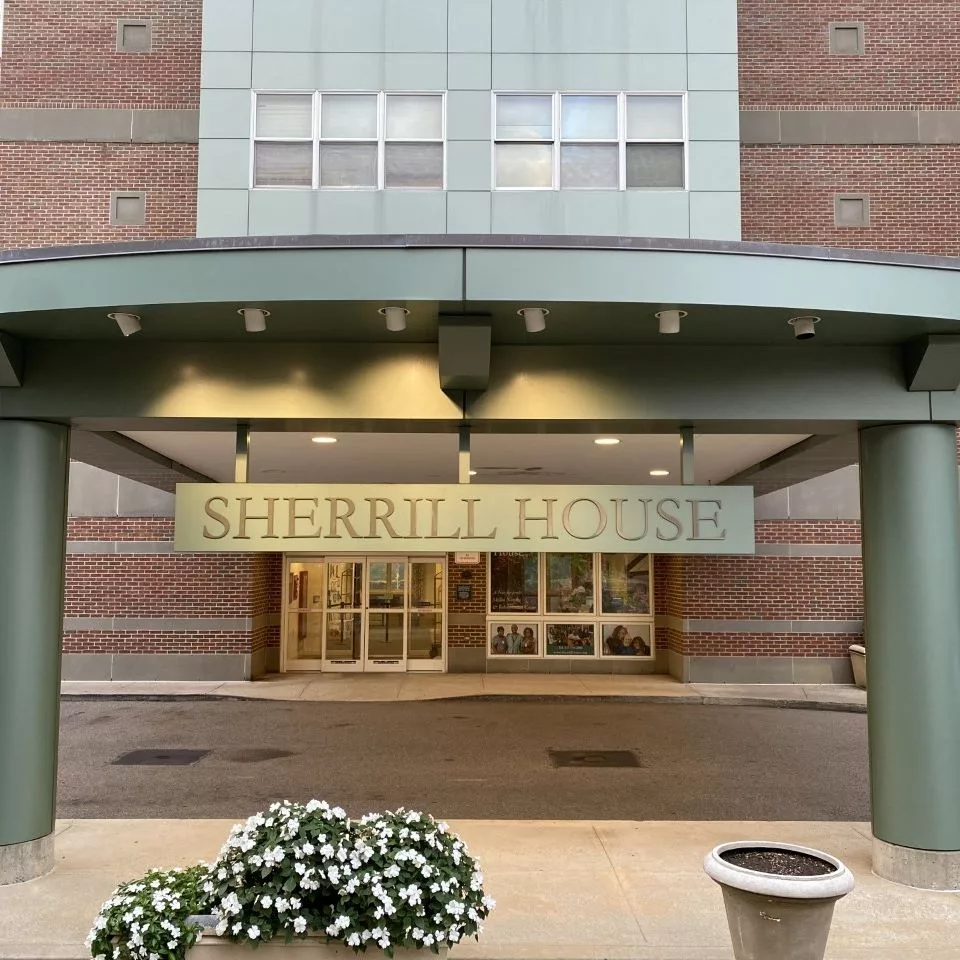

Sherrill House is a not-for-profit skilled nursing and rehabilitation center that provides graceful living for short-term or long-term residents. This skilled nursing haven also provides services for memory care. Residents of all backgrounds receive supportive assistance for everyday living with enriching activities that contribute to a high success rate for recovery. Sherrill House boasts its world-class clinical excellence that improves the quality of life for all seniors.
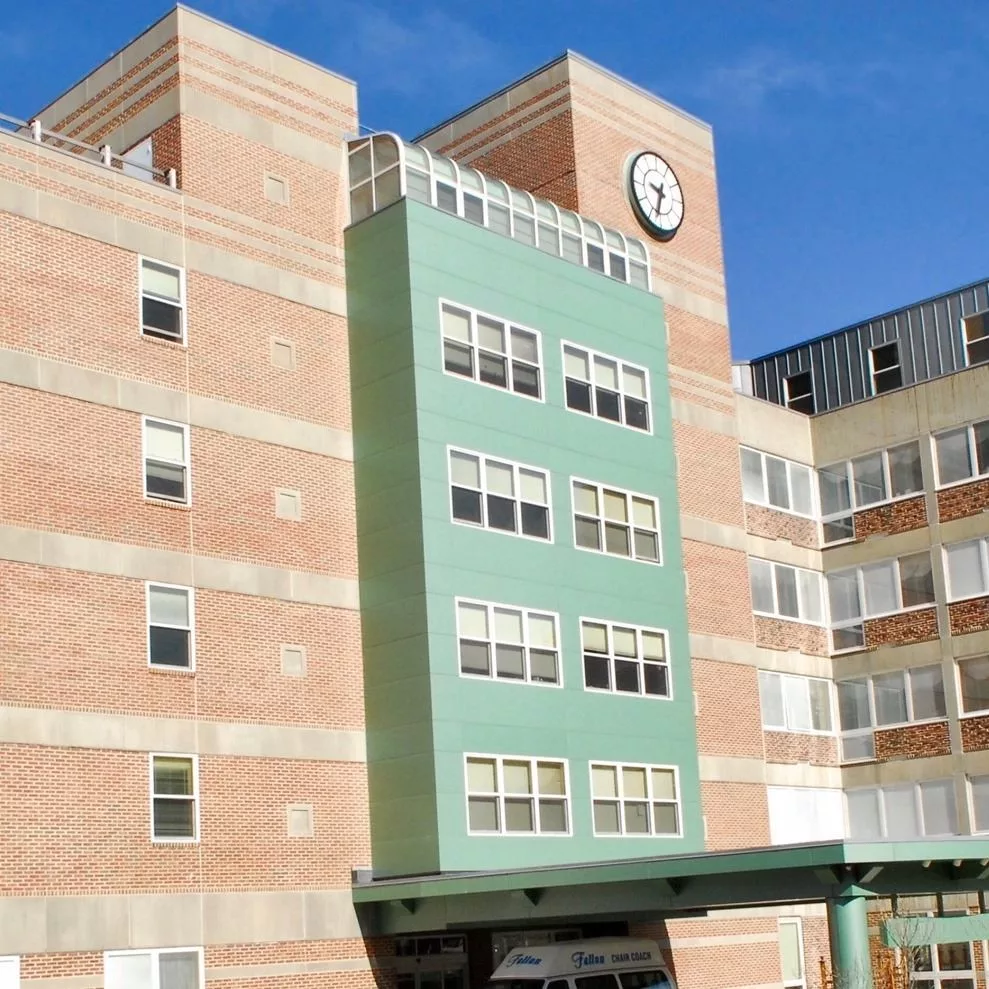
Sherrill House offers an advanced level of recovery found in their short-term and long-term services that care for stroke recovery, communication disorders, and orthopedic care, tube feeding, palliative and hospice care, pain management, and heart surgery care. They exclusively offer their Return To Home™ occupational therapy program that offers fully-equipped technology that makes the recovery period faster.
 Official CMS rating based on health inspections, staffing and quality measures.
Official CMS rating based on deficiencies found during state health inspections.
Official CMS rating based on nurse staffing hours per resident per day.
Official CMS rating based on clinical outcomes for residents.
Average daily nursing hours per resident (adjusted for acuity). Higher values indicate more nursing time per resident.
Hours of care per resident per day, broken down by staff type. Data from CMS Medicare.
Registered nurse hours per resident per day.
Licensed Practical Nurse / Licensed Vocational Nurse hours per resident per day.
Nurse aide hours per resident per day.
Total number of nurse staff hours per resident per day on weekends.
Physical therapist staff hours per resident per day.
Registered nurse hours per resident per day on weekends.
Official CMS rating based on health inspections, staffing and quality measures.
Official CMS rating based on deficiencies found during state health inspections.
Official CMS rating based on nurse staffing hours per resident per day.
Official CMS rating based on clinical outcomes for residents.
Average daily nursing hours per resident (adjusted for acuity). Higher values indicate more nursing time per resident.
Hours of care per resident per day, broken down by staff type. Data from CMS Medicare.
Registered nurse hours per resident per day.
Licensed Practical Nurse / Licensed Vocational Nurse hours per resident per day.
Nurse aide hours per resident per day.
Total number of nurse staff hours per resident per day on weekends.
Physical therapist staff hours per resident per day.
Registered nurse hours per resident per day on weekends.
Offers a balance of services and community atmosphere.
Lower occupancy suggests more openings may be available.
Most residents typically stay for a few weeks or months before returning home or moving on.
60% of new residents, usually for short-term rehab.
37% of new residents, often for short stays.
3% of new residents, often for long-term daily care.
The portion of the home's budget spent on staff, including nurses, caregivers, and other employees who support care and operations.
All remaining costs needed to run the home, such as food, utilities, building maintenance, supplies and administrative expenses.
Nursing Home 24/7 care needed
Assisted Living For seniors needing help with daily tasks but not full-time nursing.
Nursing Home 24/7 care needed
Assisted Living For seniors needing help with daily tasks but not full-time nursing.
Nursing Home 24/7 care needed
Assisted Living For seniors needing help with daily tasks but not full-time nursing.
Assisted Living For seniors needing help with daily tasks but not full-time nursing.
Independent Living For self-sufficient seniors seeking community and minimal assistance.
Memory Care Specialized care for those with Memory Loss, Alzheimer's, or dementia, ensuring safety and support.
Nursing Homes 24/7 care needed
Nursing Home 24/7 care needed
Assisted Living For seniors needing help with daily tasks but not full-time nursing.
Sherrill House 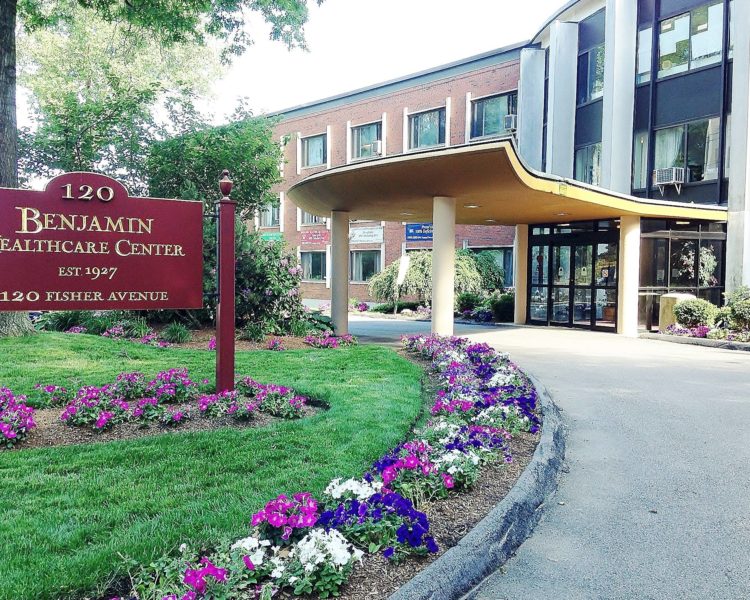 Edgar P. Benjamin Healthcare Center
 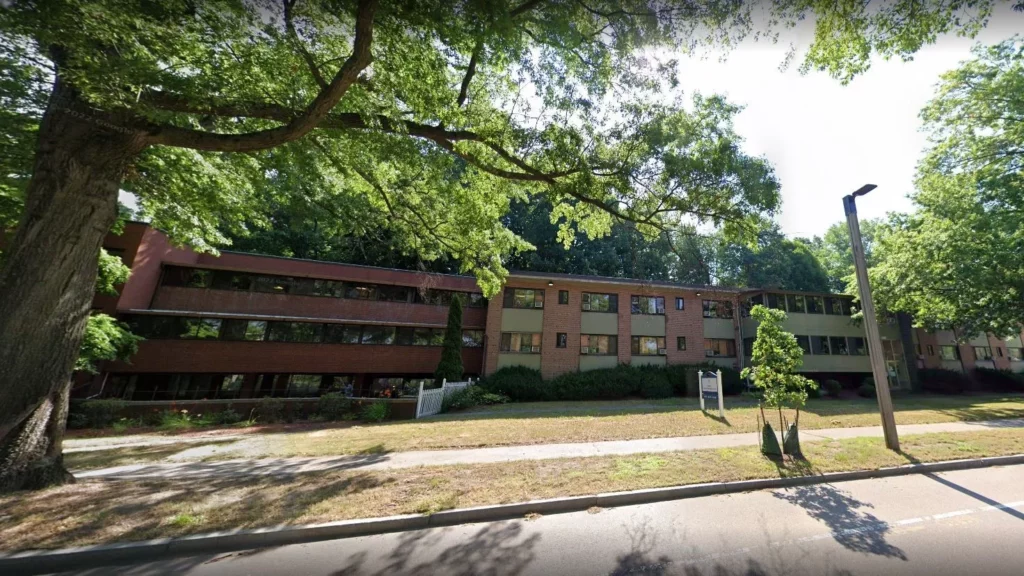 Parkway Health & Rehabilitation Center
  Marian Manor Nursing Home
![]() 3.4 miles from city center — 0.12 miles to nearest hospital (Jamaica Plain VA Medical Center)
3.4 miles from city center — 0.12 miles to nearest hospital (Jamaica Plain VA Medical Center)
![]() 135 S Huntington Ave, Boston, MA 02130
135 S Huntington Ave, Boston, MA 02130
Add your location
Source: CMS Payroll-Based Journal (Q2 2025)
| Role ⓘ | Count ⓘ | Avg Shift (hrs) ⓘ | Uses Contractors? ⓘ |
|---|---|---|---|
| Registered Nurse | 45 | 9.4 | Yes |
| Licensed Practical Nurse | 31 | 8.9 | Yes |
| Certified Nursing Assistant | 105 | 9 | Yes |
| Role ⓘ | Employees ⓘ | Contractors ⓘ | Total Staff ⓘ | Total Hours ⓘ | Days Worked ⓘ | % of Days ⓘ | Avg Shift (hrs) ⓘ |
|---|---|---|---|---|---|---|---|
| Certified Nursing Assistant | 82 | 23 | 105 | 35,480 | 91 | 100% | 9 |
| Physical Therapist | 33 | 0 | 33 | 11,713 | 91 | 100% | 7.6 |
| Registered Nurse | 21 | 24 | 45 | 9,421 | 91 | 100% | 9.4 |
| Licensed Practical Nurse | 17 | 14 | 31 | 9,360 | 91 | 100% | 8.9 |
| Other Dietary Services Staff | 9 | 0 | 9 | 2,972 | 90 | 99% | 7.4 |
| Respiratory Therapy Technician | 6 | 0 | 6 | 2,276 | 82 | 90% | 7.5 |
| Physical Therapy Assistant | 7 | 0 | 7 | 2,067 | 77 | 85% | 7.5 |
| Clinical Nurse Specialist | 3 | 0 | 3 | 1,416 | 71 | 78% | 8 |
| Mental Health Service Worker | 3 | 0 | 3 | 1,087 | 65 | 71% | 6 |
| Nurse Practitioner | 2 | 0 | 2 | 1,029 | 63 | 69% | 8.2 |
| RN Director of Nursing | 2 | 0 | 2 | 929 | 63 | 69% | 8 |
| Qualified Social Worker | 3 | 0 | 3 | 806 | 77 | 85% | 5.6 |
| Therapeutic Recreation Specialist | 1 | 0 | 1 | 558 | 74 | 81% | 7.5 |
| Administrator | 1 | 0 | 1 | 512 | 64 | 70% | 8 |
| Occupational Therapy Aide | 1 | 0 | 1 | 378 | 46 | 51% | 8.2 |
| Medical Director | 0 | 1 | 1 | 304 | 38 | 42% | 8 |
| Dietitian | 1 | 0 | 1 | 150 | 37 | 41% | 4 |
| Occupational Therapy Assistant | 0 | 1 | 1 | 64 | 14 | 15% | 4.6 |
| Physical Therapy Aide | 1 | 0 | 1 | 37 | 6 | 7% | 6.1 |
Massachusetts average 4.5
Last Health inspection on Jun 2025
Health citations are formal notices following inspections when they fail to comply with safety and care standards.
20 of 27 citations resulted from standard inspections; and 7 of 27 resulted from complaint investigations.
Massachusetts average: 0.3
Massachusetts average: 1.5
Data sourced from CMS Health Deficiencies reports. Citation severity codes range from A (least serious) to L (most serious). Immediate Jeopardy (J-L) citations indicate situations where the facility's noncompliance has placed residents at risk of death or serious harm.
Source: CMS Long-Term Care Facility Characteristics (Data as of Jan 2026)
Active councils help families stay involved in care decisions and facility operations.
These measures show how residents usually do over time at this home, based on health outcomes and preventive care.
Massachusetts average: 10.2
Massachusetts average: 20.0
Massachusetts average: 18.7%
Massachusetts average: 19.3%
Massachusetts average: 22.1%
Massachusetts average: 3.6%
Massachusetts average: 4.7%
Massachusetts average: 2.1%
Massachusetts average: 5.2%
Massachusetts average: 10.7%
Massachusetts average: 20.3%
Massachusetts average: 91.9%
Massachusetts average: 94.8%
Massachusetts average: 1.86
Massachusetts average: 1.54
Massachusetts average: 76.7%
Massachusetts average: 1.3%
Massachusetts average: 77.7%
Massachusetts average: 25.8%
Massachusetts average: 11.8%
Massachusetts average: 0.8%
Massachusetts average: 53.7%
Massachusetts average: 50.6%
Quality measures are calculated from Minimum Data Set (MDS) assessments. For most measures, lower percentages indicate better care quality.
Historical financial and operational data for Sherrill House based on CMS SNF Cost Reports.
Loading trend charts...
Care Cost Calculator: See Prices in Your Area
Nursing Home Data Explorer
Don’t Wait Too Long: 7 Red Flag Signs Your Parent Needs Assisted Living Now
The True Cost of Assisted Living in 2025 – And How Families Are Paying For It
Understanding Senior Living Costs: Pricing Models, Discounts & Financial Assistance

We help families find affordable senior communities and unlock same day discounts, Medicaid, and Medicare options tailored to your needs.
Contact us Today
Touring a community? Use this expert-backed checklist to stay organized, ask the right questions, and find the perfect fit.
We'll send you a PDF version of the touring checklist.


