Sheyenne Crossings Senior Living Apartments
Nursing Home, Assisted Living, Home Care, Hospice Care, Independent Living, Memory Care & Respite Care · West Fargo, ND
CMS overall rating Info CMS (the Centers for Medicare & Medicaid Services) is the federal agency that rates nursing home quality. Its Overall Rating runs from 1 to 5 stars, combining health inspections, staffing, and quality measures, with inspections weighted most heavily.

Sheyenne Crossings Senior Living Apartments

Nursing Home, Assisted Living, Home Care, Hospice Care, Independent Living, Memory Care & Respite Care · West Fargo, ND
CMS overall rating Info CMS (the Centers for Medicare & Medicaid Services) is the federal agency that rates nursing home quality. Its Overall Rating runs from 1 to 5 stars, combining health inspections, staffing, and quality measures, with inspections weighted most heavily.
Calculator: See prices in your area
Sheyenne Crossings Senior Living Apartments accepts Medicare, Medicaid, and private pay.

Overview of Sheyenne Crossings Senior Living Apartments

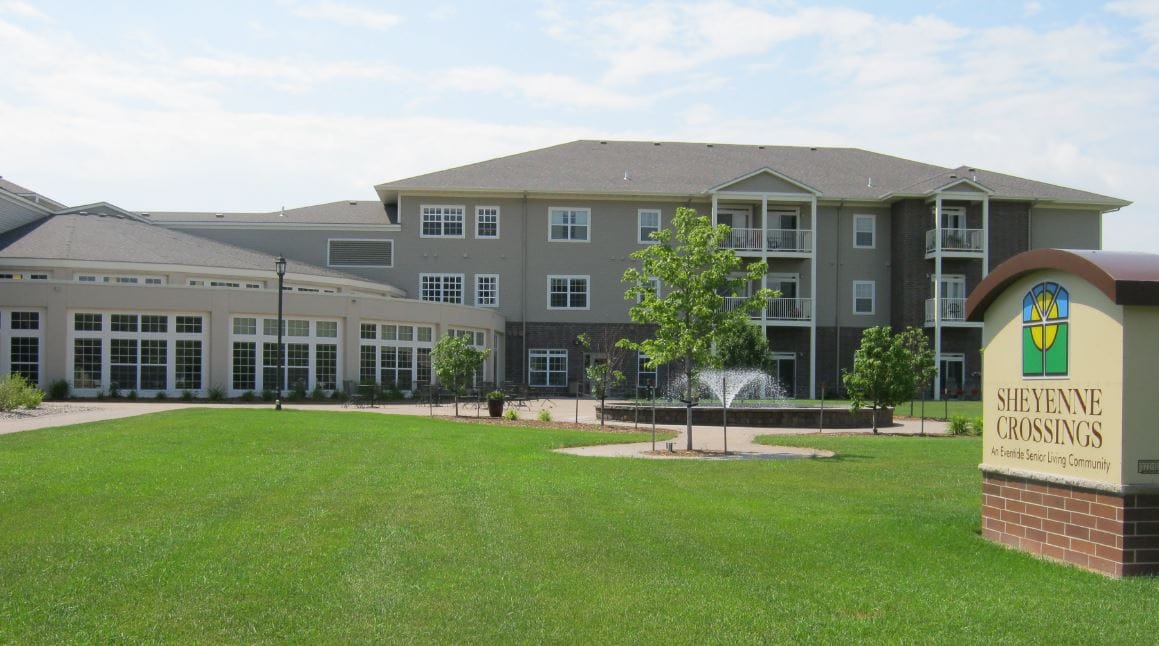
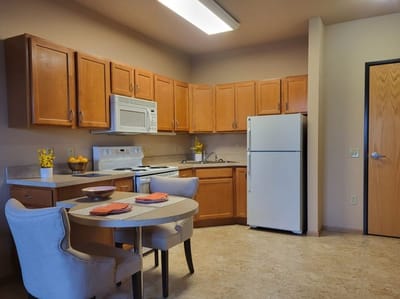
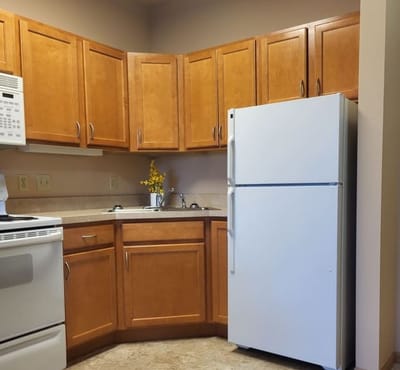
Sheyenne Crossings Senior Living Apartments is an exceptional residence offering a harmonious blend of independent living floor plans and top-notch assisted living services. Situated in the heart of West Fargo, this community is a haven for those in their golden years. Whether residents prefer a cozy studio or a spacious two-bedroom apartment, there is a living space to accommodate their preferences. The community also boasts state-of-the-art assisted living facilities, providing the necessary support and care to residents who require additional assistance.

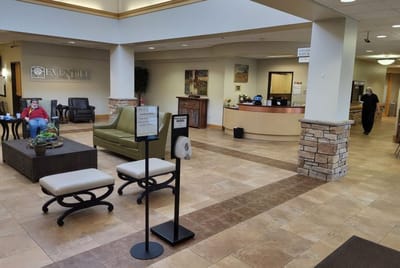
From daily wellness checks to a secure building and a professional staff available 24 hours a day, Sheyenne Crossings ensures the safety and well-being of its residents. The community goes beyond the basics, offering a range of amenities and services that enhance the living experience. Charming common areas and elegant dining spaces with high ceilings create an inviting atmosphere for socializing and relaxation. A chapel and wellness center provides spaces for spiritual enrichment and physical well-being.

(701) 478-6000

Quality ratings

Measured by Centers for Medicare & Medicaid Services (CMS)

Overall rating Info The Overall CMS Rating combines results from health inspections, staffing levels and quality measures. Health inspections carry the most weight. Staffing and quality scores can increase or decrease the final rating based on performance compared to state and national standards.
▲ 28.6% Above ND avg. ▲ 28.6% Above ND avg.ND average: 3.1Click the badge to see the full State ranking.Click here to see the full State ranking.
Health Inspection Info Based on the results of the facility's three most recent standard inspections and any complaint investigations. CMS reviews the number, scope, and severity of deficiencies, with more recent findings weighted more heavily.
▲ 41.9% Above ND avg. ▲ 41.9% Above ND avg.ND average: 2.8Click the badge to see the full State ranking.Click here to see the full State ranking.
Staffing Info Measures average nursing staff hours per resident per day, including Registered Nurses (RNs) and total nursing staff. Ratings are adjusted based on the level of care residents require and are compared to state and national benchmarks.
▼ 7.7% Below ND avg. ▼ 7.7% Below ND avg.ND average: 4.3Click the badge to see the full State ranking.Click here to see the full State ranking.
Quality Measures Info Based on clinical and physical health indicators reported to CMS, such as hospital readmissions, falls, pressure ulcers, and improvements in mobility. These measures reflect how well residents' health needs are being managed.
▲ 11.3% Above ND avg. ▲ 11.3% Above ND avg.ND average: 2.7Click the badge to see the full State ranking.Click here to see the full State ranking.

Staffing hours breakdown

Info Daily nursing hours per resident by staff type, reported to CMS. Higher is generally better — compare this facility to state and national averages to see where staffing stands.

Hours per resident per day — compared to North Dakota state averages

Total nursing care / resident Info This home is ranked 14th out of 26 homes in North Dakota for nurse hours. Total adjusted nursing hours per resident per day, combining RN, LPN, and aide time. CMS adjusts this for case-mix so facilities can be fairly compared.
5h 0m per day
Rank #14 / 26Nurse hours — State benchmarkedThis home is ranked 14th out of 26 homes in North Dakota. Shows adjusted nurse hours per resident per day benchmarked to the North Dakota average, with a ranking across 26 North Dakota facilities. More hours mean more direct care. The national average is about 3.5 hrs; below 3.0 is a red flag.Ranking totals vary by category as each rank only includes facilities that report data for that metric. Homes missing that data point aren't included in the ranking.Click the rank badge to see the full State ranking.Click here to see the full State ranking.
This facility North Dakota avg (5h 10m per day)
vs North Dakota avg
-3%

2 of 6 metrics below state avg

Standout metric LPN / LVN is +52% above state avg
Staff typeHours / Day / Residentvs state avg
Registered Nurse (RN) Info RNs hold the highest nursing license and can assess residents, interpret test results, and direct care plans. More RN hours per day often signals stronger clinical oversight and faster response to health changes. 38m per day ▼ 32% State avg: 56m per day · National avg: 41m per day
LPN / LVN Info Licensed Practical Nurses (LPNs) or Licensed Vocational Nurses (LVNs) deliver routine hands-on care — medication administration, wound dressing, and monitoring vital signs. They work under RN supervision and make up a large share of daily bedside care. 47m per day ▲ 52% State avg: 31m per day · National avg: 52m per day
Nurse Aide Info Certified Nurse Aides (CNAs) provide the most direct day-to-day assistance: bathing, dressing, feeding, and mobility. Nurse aide hours are typically the largest staffing category and directly affect residents' quality of life. 3h 17m per day ▲ 11% State avg: 2h 58m per day · National avg: 2h 20m per day
Weekend Total Nursing Info Combined nursing hours (RN + LPN + Nurse Aide) per resident per day on weekends. Staffing often drops on weekends — this figure reveals whether the facility maintains adequate coverage outside of weekday hours. 4h 16m per day ▲ 12% State avg: 3h 50m per day · National avg: 3h 27m per day
Physical Therapist Info Hours per resident per day provided by licensed Physical Therapists (PTs) or PT Assistants. PT services help residents recover mobility after injury or illness and are especially important for post-acute (short-stay) rehabilitation. 4m per day ▲ 44% State avg: 3m per day · National avg: 4m per day
Weekend RN Info Registered nurse hours specifically on weekends. Facilities sometimes reduce RN presence on Saturdays and Sundays — a low weekend RN figure compared to weekday hours can indicate reduced clinical oversight when most administrative staff are absent. 17m per day ▼ 53% State avg: 35m per day · National avg: 29m per day

Capacity and availability

Avg. Length of Stay
179 days
Bed community size
103-bed community Rank #13 / 53Bed count — State benchmarkedThis home is ranked 13th out of 53 homes in North Dakota. Shows this facility's certified or reported bed count compared to other North Dakota facilities. Larger communities may offer more amenities, programs, and on-site services for residents and families.Ranking totals vary by category as each rank only includes facilities that report data for that metric. Homes missing that data point aren't included in the ranking.Click the rank badge to see the full State ranking.Click here to see the full State ranking.
A larger shared setting that may offer more common spaces and organized community services.
Walk Score
Walk Score: 36 / 100 Rank #42 / 80Walk Score — State benchmarkedThis home is ranked 42nd out of 80 homes in North Dakota. Shows how walkable this facility's neighborhood is compared to the average Walk Score across North Dakota facilities. Higher scores benefit residents, families, and staff.Ranking totals vary by category as each rank only includes facilities that report data for that metric. Homes missing that data point aren't included in the ranking.Click the rank badge to see the full State ranking.Click here to see the full State ranking.
Somewhat walkable. A few nearby services may be reachable on foot, but most trips require transportation.

About this community

Occupancy

Occupancy rate
97%
Rank #8 / 24Occupancy rate — State benchmarkedThis home is ranked 8th out of 24 homes in North Dakota. Shows this facility's occupancy rate versus the North Dakota average, with its Statewide rank out of 24. Higher occupancy signals strong local demand and financial stability.Ranking totals vary by category as each rank only includes facilities that report data for that metric. Homes missing that data point aren't included in the ranking.Click the rank badge to see the full State ranking.Click here to see the full State ranking.
Higher than the North Dakota average: 87.8%
Occupied beds
99 / 103
Average occupied beds in North Dakota homes 62 beds

License Details

Facility TypeAssisted Living Facility
ExpirationDecember 31, 2025
CountyCass

Ownership & Operating Entity

Sheyenne Crossings Senior Living Apartments is legally operated by Sheyenne Crossing.

Staffing

Key information about the people who lead and staff this community.

Leadership

ContactTony Keelin

Contact Sheyenne Crossings Senior Living Apartments

Health Inspection History

Inspections since 2022
Total health inspections 4

North Dakota average 4.2


Last Health inspection on Dec 2024

Total health citations
11 Rank #7 / 26Health citations — State benchmarkedThis home is ranked 7th out of 26 homes in North Dakota. Shows this facility's total health deficiency citations benchmarked to the North Dakota State average, with a ranking across all 26 ND facilities. Lower citation counts earn a better rank.Ranking totals vary by category as each rank only includes facilities that report data for that metric. Homes missing that data point aren't included in the ranking.Click the rank badge to see the full State ranking.Click here to see the full State ranking.

North Dakota average 16.5

Citations per inspection
2.75 Rank #8 / 26Citations per inspection — State benchmarkedThis home is ranked 8th out of 26 homes in North Dakota. Shows average deficiency citations per CMS inspection for this facility versus the North Dakota mean across 26 facilities with citation data. Lower is better.Ranking totals vary by category as each rank only includes facilities that report data for that metric. Homes missing that data point aren't included in the ranking.Click the rank badge to see the full State ranking.Click here to see the full State ranking.

North Dakota average 3.93


Health citations are formal notices following inspections when they fail to comply with safety and care standards.

4 of 11 citations resulted from standard inspections; 1 of 11 resulted from complaint investigations; and 6 of 11 came from combined inspections (standard and complaint).

Breakdown of citation severity (last 4 years)
Critical health citations
0
100% better than North Dakota average

North Dakota average: 0.5


Serious health citations
0
100% better than North Dakota average

North Dakota average: 1

0 critical citations North Dakota average: 0.5

0 serious citations North Dakota average: 1

11 moderate citations North Dakota average: 14.8

0 minor citations North Dakota average: 0.2
Citations history (last 4 years)
Infection Control moderate citation Dec 18, 2024
Corrected

Pharmacy moderate citation Dec 18, 2024
Corrected

Care Planning moderate citation Dec 18, 2024
Corrected

Resident Rights moderate citation Dec 18, 2024
Corrected

Staffing Data

Reporting period: October 1 – December 31, 2025 (Q4 2025). Source: CMS Payroll-Based Journal report.

Total staff 143
Employees 116
Contractors 27
Staff to resident ratio 2.27 : 1
18% more staff per resident than North Dakota average
North Dakota average ratio: 1.92 : 1 North Dakota average ratio: 1.92 : 1See full North Dakota ranking
Avg staff/day 42
Average shift 7.8 hours
0% compared with North Dakota average
North Dakota average: 7.9 hours North Dakota average shift: 7.9 hoursSee full North Dakota ranking
Total staff hours (quarter) 30,313

Nursing staff breakdown

Q4 2025 · Oct 1 – Dec 31 More info This data comes from the CMS Payroll-Based Journal report covering October 1 – December 31, 2025.
Registered Nurse

Manages medical care and health needs.

RN Staff Info 16 total: 14 full-time employees and 2 contractors. 16
Average shift length Info Average shift length. Calculated as total hours divided by days worked and average staff per day. 8 hours
Licensed Practical Nurse

Assists with medical care and medications.

LPN Staff Info 16 total: 14 full-time employees and 2 contractors. 16
Average shift length Info Average shift length. Calculated as total hours divided by days worked and average staff per day. 9.7 hours
Certified Nursing Assistant

Helps with daily care and mobility.

CNA Staff Info All 60 CNA Staff are full-time employees. No contractors work on this role. 60
Average shift length Info Average shift length. Calculated as total hours divided by days worked and average staff per day. 8 hours

Contractor staffing

Q4 2025 · Oct 1 – Dec 31 More info This data comes from the CMS Payroll-Based Journal report covering October 1 – December 31, 2025.

Total hours from contractors

8.6%

2,611 contractor hours this quarter

Physical Therapy Assistant: 8 Respiratory Therapy Technician: 5 Physical Therapy Aide: 4 Speech Language Pathologist: 3 Qualified Social Worker: 2 Licensed Practical Nurse: 2 Registered Nurse: 2 Occupational Therapy Assistant: 1

Staff by category

Q4 2025 · Oct 1 – Dec 31 More info This data comes from the CMS Payroll-Based Journal report covering October 1 – December 31, 2025.
Certified Nursing Assistant6006015,66692100%8
Licensed Practical Nurse142164,26592100%9.7
Medication Aide/Technician160162,35192100%8.1
Registered Nurse142161,5549098%8
Clinical Nurse Specialist3031,4086975%7.9
Mental Health Service Worker2029606470%8
Dietitian2027086571%7.9
Physical Therapy Assistant0885537177%4.7
Nurse Practitioner1014806065%8
Occupational Therapy Aide2024787278%5.2
Administrator1014555964%7.7
Physical Therapy Aide0444386166%6.6
Speech Language Pathologist0333526368%5.4
Respiratory Therapy Technician0553396874%4.7
Other Dietary Services Staff1011511921%7.9
Qualified Social Worker0221164246%2.6
Occupational Therapy Assistant0114189%5.2
60 Certified Nursing Assistant
% of Days 100%
16 Licensed Practical Nurse
% of Days 100%
16 Medication Aide/Technician
% of Days 100%
16 Registered Nurse
% of Days 98%
3 Clinical Nurse Specialist
% of Days 75%
2 Mental Health Service Worker
% of Days 70%
2 Dietitian
% of Days 71%
8 Physical Therapy Assistant
% of Days 77%
1 Nurse Practitioner
% of Days 65%
2 Occupational Therapy Aide
% of Days 78%
1 Administrator
% of Days 64%
4 Physical Therapy Aide
% of Days 66%
3 Speech Language Pathologist
% of Days 68%
5 Respiratory Therapy Technician
% of Days 74%
1 Other Dietary Services Staff
% of Days 21%
2 Qualified Social Worker
% of Days 46%
1 Occupational Therapy Assistant
% of Days 9%

Penalties and fines

Federal penalties imposed by CMS for regulatory violations, including civil money penalties (fines) and denials of payment for new Medicare/Medicaid admissions.

Source: CMS Penalties Database

No penalties in the past 3 years

No civil money penalties or payment denials were reported in the last 3 years.

Quality of care over time

These measures show how residents usually do over time at this home, based on health outcomes and preventive care.

High-risk clinical events score Info A composite score based on pressure ulcers, falls with injury, weight loss, walking ability decline, and activities of daily living decline. 12.3
8% worse than North Dakota average

North Dakota average: 11.4

Functional decline score Info A composite score based on activities of daily living decline, walking ability decline, and incontinence. 23.2
5% worse than North Dakota average

North Dakota average: 22.0

Long-stay resident measures
Need for Help with Daily Activities Increased Info Percent of long-stay residents whose need for help with daily activities has increased 16.1%
21% better than North Dakota average

North Dakota average: 20.4%

Walking Ability Worsened Info Percent of long-stay residents whose ability to move independently worsened 29.6%
44% worse than North Dakota average

North Dakota average: 20.6%

Low Risk Residents with Bowel/Bladder Incontinence Info Percent of low risk long-stay residents who lose control of their bowels or bladder 23.9%
5% better than North Dakota average

North Dakota average: 25.0%

Falls with Major Injury Info Percent of long-stay residents experiencing one or more falls with major injury 2.4%
51% better than North Dakota average

North Dakota average: 5.0%

High Risk Residents with Pressure Ulcers Info Percent of long-stay high risk residents with pressure ulcers 6.6%
19% worse than North Dakota average

North Dakota average: 5.6%

Urinary Tract Infection Info Percent of long-stay residents with a urinary tract infection 2.0%
41% better than North Dakota average

North Dakota average: 3.4%

Lost Too Much Weight Info Percent of long-stay residents who lose too much weight 6.6%
16% worse than North Dakota average

North Dakota average: 5.7%

Depressive Symptoms Info Percent of long-stay residents who have depressive symptoms 0.0%
100% better than North Dakota average

North Dakota average: 4.4%

Antipsychotic Use Info Percent of long-stay residents who received an antipsychotic medication 14.4%
33% better than North Dakota average

North Dakota average: 21.4%

Pneumococcal Vaccine Info Percent of long-stay residents assessed and appropriately given the pneumococcal vaccine 100.0%
In line with North Dakota average

North Dakota average: 98.4%

Influenza Vaccine Info Percent of long-stay residents assessed and appropriately given the seasonal influenza vaccine 100.0%
In line with North Dakota average

North Dakota average: 98.8%

Short-stay resident measures
Pneumococcal Vaccine Info Percent of short-stay residents assessed and appropriately given the pneumococcal vaccine 92.8%
In line with North Dakota average

North Dakota average: 94.4%

Antipsychotic medication increase Info Percent of short-stay residents who newly received an antipsychotic medication 0.0%
100% better than North Dakota average

North Dakota average: 2.1%

Influenza Vaccine Info Percent of short-stay residents assessed and appropriately given the seasonal influenza vaccine 93.3%
5% better than North Dakota average

North Dakota average: 88.6%

Breakdown by payment type

Medicare

74% of new residents, usually for short-term rehab.

Typical stay 30 days

Private pay

25% of new residents, often for short stays.

Typical stay 9 - 10 months

Medicaid

1% of new residents, often for long-term daily care.

Typical stay 13 years

Facility Characteristics

Source: CMS Long-Term Care Facility Characteristics (Data as of Jan 2026)

Total residents 63
Medicare
9
14.3% of residents
Medicaid
21
33.3% of residents
Private pay or other
33
52.4% of residents
Programs & Services
Residents Group

Residents meet regularly to discuss policies, care quality, and activities

Family Member Group

Family members meet regularly to discuss policies, care quality, and activities

Active Family Council

Organized group of family members that meets regularly to discuss facility policies, resident care, and activities.

Active Resident Council

Organized group of residents that meets regularly to discuss facility policies, quality of life, and activities.

Finances and operations

Based on CMS SNF Cost Report for fiscal year ending in 09/2023.

Governmental community
Operated by a subsidized facility district.
Net patient revenue Info Net patient revenue — what the home actually collects for resident care, after contractual allowances, bad debt and discounts are subtracted from its gross charges (CMS cost report, Worksheet G-3). It covers resident care only; money the home earns from other sources is shown separately as "Other income."
$14.6M
Net patient income Info Net patient income: net patient revenue minus the home's total operating expenses. A positive figure means it earns more from resident care than it spends to deliver it; a negative figure means the opposite. It excludes non-operating "other income."
$708.0K
Governmental community Operated by a subsidized facility district.
Net patient revenue Info Net patient revenue — what the home actually collects for resident care, after contractual allowances, bad debt and discounts are subtracted from its gross charges (CMS cost report, Worksheet G-3). It covers resident care only; money the home earns from other sources is shown separately as "Other income."
$14.6M Rank #10 / 23Revenue — State benchmarkedThis home is ranked 10th out of 23 homes in North Dakota. Shows this facility's annual revenue compared to the North Dakota average. Higher revenue generally means more resources for staffing and capital — read alongside Payroll %.Ranking totals vary by category as each rank only includes facilities that report data for that metric. Homes missing that data point aren't included in the ranking.Click the rank badge to see the full State ranking.Click here to see the full State ranking.
Net patient income Info Net patient income: net patient revenue minus the home's total operating expenses. A positive figure means it earns more from resident care than it spends to deliver it; a negative figure means the opposite. It excludes non-operating "other income."
$708.0K
Other income Info Money the home earns outside of resident care — such as investments, grants, rentals and other non-operating sources (CMS cost report, Worksheet G-3). It is tracked separately from net patient revenue: it is not part of that figure, and it is not included in net patient income.
$143.4K
Payroll costs Info Staff salaries plus wage-related costs — benefits such as payroll taxes, health insurance and retirement — from the home's own accounting records (CMS cost report, Worksheet A). Contract or agency labor is counted separately, under other operating costs. Rank #12 / 23Payroll — State benchmarkedThis home is ranked 12th out of 23 homes in North Dakota. Shows total annual staff payroll benchmarked to the North Dakota average. Higher payroll investment relative to peers often signals better staffing and less reliance on cheaper contract labor.Ranking totals vary by category as each rank only includes facilities that report data for that metric. Homes missing that data point aren't included in the ranking.Click the rank badge to see the full State ranking.Click here to see the full State ranking.
$7.8M 53.3% of net patient revenue Info Payroll as a share of revenue: staff salaries and wage-related benefits divided by net patient revenue. A higher figure means more of each revenue dollar goes to staff pay. Rank #20 / 23Payroll % — State benchmarkedThis home is ranked 20th out of 23 homes in North Dakota. Shows payroll as a percentage of revenue versus the North Dakota average. Well-run North Dakota facilities typically land around 67–77% — the top third Statewide. Below 25% may signal understaffing or heavy agency use — read with Staffing ratings.Ranking totals vary by category as each rank only includes facilities that report data for that metric. Homes missing that data point aren't included in the ranking.Click the rank badge to see the full State ranking.Click here to see the full State ranking.
Other operating costs Info Everything it costs to run the home apart from payroll — food, utilities, supplies, maintenance, contract labor and administration. Calculated as total operating expense minus payroll (staff salaries and wage-related benefits).
$6.1M
Total costs Info The home's total operating expense for the year — all the costs of running it, salaries included (CMS cost report, Worksheet G-3).
$13.9M

What does this home offer?

Pets allowed icon
Pets allowed icon

Pets Allowed

Housing options icon

Housing Options: Studio / 2 Bed

Building type icon
Building type icon

Building Type: 3-storey

Transportation services icon

Transportation Services

Fitness and recreation icon

Fitness and Recreation

Who this home usually serves

TYPE OF STAY

Mostly short-term rehab stays

Most residents typically stay for a few weeks or months before returning home or moving on.

Most new residents arrive under Medicare (74% of admissions), and a typical Medicare stay runs around 30 days.

Admissions
163 total

Coverage residents most often arrive under.

Medicare 74%
Private pay 25%
Medicaid 1%
Discharges
126 total

Coverage residents most often leave under.

Medicare 76%
Private pay 21%
Medicaid 3%

Places of interest near Sheyenne Crossings Senior Living Apartments

Address 8.4 miles from city center Info Estimated distance in miles from West Fargo's city center to Sheyenne Crossings Senior Living Apartments's address, calculated via Google Maps. — 1.65 miles to nearest hospital (Vibra Hospital of Fargo)

Calculate Travel Distance to Sheyenne Crossings Senior Living Apartments

Add your location

Address

Compare Assisted Living around West Fargo

The information below is reported by the North Dakota Department of Health and Human Services, Health Facilities Division.

Sheyenne Crossings Senior Living Apartments
AL
HC
IL
MC
RC
NH
West Fargo (West Charleswood) -
103
Facility 103
ND AVG 75
Rank #13 / 53
-
36
Facility 36
ND AVG 42
Rank #42 / 80
Studio / 2 Bed
Eventide Catered Living
AL
HC
IL
MC
NC
NH
RC
Moorhead -145 A+ 44 Studio / 2 Bed
Eventide Fargo
AL
HC
IL
MC
NC
NH
RC
Fargo (Brandt Crossing) -
98
Facility 98
ND AVG 75
Rank #14 / 53
-
21
Facility 21
ND AVG 42
Rank #60 / 80
Studio / 2 Bed
Fargo Elim Care Center
AL
HC
IL
NH
RC
Fargo (River Drive) -
95
Facility 95
ND AVG 75
Rank #16 / 53
-
52
Facility 52
ND AVG 42
Rank #31 / 80
Studio / 2 Bed
Golden LivingCenter in Moorhead
AL
NH
Moorhead -42 - 48 Studio / 2 Bed

Financial Assistance for
Assisted Living in North Dakota

Sheyenne Crossings Senior Living Apartments is located in West Fargo, North Dakota.
Here are the financial assistance programs available to residents in North Dakota.

Get Financial aid guidance

Aged and Disabled Waiver

ND Medicaid A&D Waiver

Age 65+ or disabled
General North Dakota resident, Medicaid- eligible, nursing home-level care need.
Income Limits (2025) ~$2,829/month 300% FBR, individual
Asset Limits $3,000 individual, higher than most states
ND

Higher asset limit; sparse population aids rural access.

Benefits
Personal care (5-7 hours/day) Respite (240 hours/year) Adult day care (~$60/day) Home aides

Service Payments for Elderly and Disabled (SPED)

ND SPED

Age 65+ or disabled
General North Dakota resident, at risk of decline.
Income Limits ~$1,732/month individual, varies
Asset Limits $50,000 individual, higher limit
ND

Higher asset limit; rural focus.

Benefits
In-home care (2-4 hours/week) Respite (up to 5 days/year) Transportation (~5 trips/month)

Basic Care Assistance Program (BCAP)

North Dakota Basic Care Assistance Program

Age 65+ (or disabled 18+)
General ND resident, in licensed basic care facility, low-income.
Income Limits (2025) ~$1,255/month (individual, after facility costs); varies by facility rate.
Asset Limits $3,000 individual
ND

Supplements SSI; covers ~50 facilities statewide.

Benefits
Cash (~$1,000-$1,500/month) for room/board/care in basic care facilities

Family Home Care Program

North Dakota Family Home Care Program

Age 60+
General ND resident, need help with 1+ ADL, family caregiver available.
Income Limits (2025) No strict cap; prioritizes low-income ~$24,980/year
Asset Limits Not assessed; need-based.
ND

Caregiver must be family; payment varies by hours/service.

Benefits
Family caregiver payment (~$10-$15/hour, up to 20 hours/week) Respite support

Medicare Savings Program (MSP)

North Dakota Medicare Savings Program

Age 65+ or disabled
General ND resident, Medicare Part A/B.
Income Limits (2025) ~$2,510/month (QMB), ~$3,380/month (SLMB), ~$3,598/month (QI)—individual.
Asset Limits $9,430 (individual), $14,130 (couple).
ND

Three tiers; no waitlist; includes Extra Help for Part D.

Benefits
Covers Part B premiums ($174.70/month) Deductibles ($240/year) Copays (~20%)

Family Caregiver Support Program (FCSP)

North Dakota Family Caregiver Support Program

Age
General Caregivers of 60+ needing care or 55+ caregivers of others; ND resident; functional needs (2+ ADLs).
Income Limits (2025) Prioritizes ~$24,980/year (individual); no strict cap.
Asset Limits Not assessed; need-based.
ND

8 regions; rural/low-income priority.

Benefits
Respite (4-6 hours/week or 5 days/year) Adult day care ($50/day) Training Supplies (~$500/year)

VA Aid and Attendance (A&A) and Housebound Benefits

North Dakota VA Aid and Attendance/Housebound

Age 65+ or disabled veteran/spouse
General ND resident, wartime service, need for ADL help (A&A) or homebound.
Income Limits (2025) Net income < ~$1,984/month (veteran with dependent, A&A); pension offsets income.
Asset Limits ~$155,356 net worth limit
ND

High veteran demand in rural areas; ND Veterans Home option.

Benefits
Cash (~$1,433-$2,642/month veteran, ~$951-$1,318 spouse) for care costs (e.g., in-home, assisted living)

Property Tax Homestead Credit for Seniors

North Dakota Homestead Property Tax Credit

Age 65+ (or disabled)
General ND resident, homeowner, low-income.
Income Limits (2025) ~$22,500/year (individual), ~$29,500/year (couple).
Asset Limits Home value < $500,000; other assets not assessed.
ND

Credit up to $500-$1,000; applies to primary residence.

Benefits
Tax reduction (~$500-$1,000/year) on property taxes

Medicaid Personal Care Option (PCO)

North Dakota Medicaid Personal Care Option

Age 65+ (or disabled)
General ND resident, Medicaid-eligible, need help with 1+ ADL.
Income Limits (2025) ~$1,255/month (100% FPL, individual); QIT optional for excess income.
Asset Limits $3,000 (individual), $6,000 (couple) (excludes home up to $713,000, car).
ND

Self-directed option (hire family); part of Medicaid State Plan, not a waiver.

Benefits
Personal care (5-20 hours/week) Homemaker services Respite (~5 days/year)

Frequently Asked Questions about Sheyenne Crossings Senior Living Apartments

What neighborhood is Sheyenne Crossings Senior Living Apartments in?

Sheyenne Crossings Senior Living Apartments is in the West Charleswood neighborhood of West Fargo.

Who is the owner of Sheyenne Crossings Senior Living Apartments?

The legal owner and operator of Sheyenne Crossings Senior Living Apartments is Sheyenne Crossing.

Is Sheyenne Crossings Senior Living Apartments in a walkable area?

Sheyenne Crossings Senior Living Apartments has a walk score of 36. Somewhat walkable. A few nearby services may be reachable on foot, but most trips require transportation.

When does Sheyenne Crossings Senior Living Apartments's license expire?

According to ND state health department records, Sheyenne Crossings Senior Living Apartments's license expires on December 31, 2025.

What is the occupancy rate at Sheyenne Crossings Senior Living Apartments?

Sheyenne Crossings Senior Living Apartments's occupancy is 97%.

How many beds does Sheyenne Crossings Senior Living Apartments have?

Sheyenne Crossings Senior Living Apartments has 103 beds.

Are there photos of Sheyenne Crossings Senior Living Apartments?

Yes — there are 4 photos of Sheyenne Crossings Senior Living Apartments in the photo gallery on this page.

Guides for Better Senior Living

Care Cost Calculator: See Prices in Your Area

Nursing Home Data Explorer

Don’t Wait Too Long: 7 Red Flag Signs Your Parent Needs Assisted Living Now

The True Cost of Assisted Living in 2025 – And How Families Are Paying For It

Understanding Senior Living Costs: Pricing Models, Discounts & Financial Assistance