


Re-hospitalized after SNF stay
 Percentage of short-stay residents who were re-hospitalized after their nursing home admission.
24.4%
Percentage of short-stay residents who were re-hospitalized after their nursing home admission.
24.4%
Nevada average: 23.4%
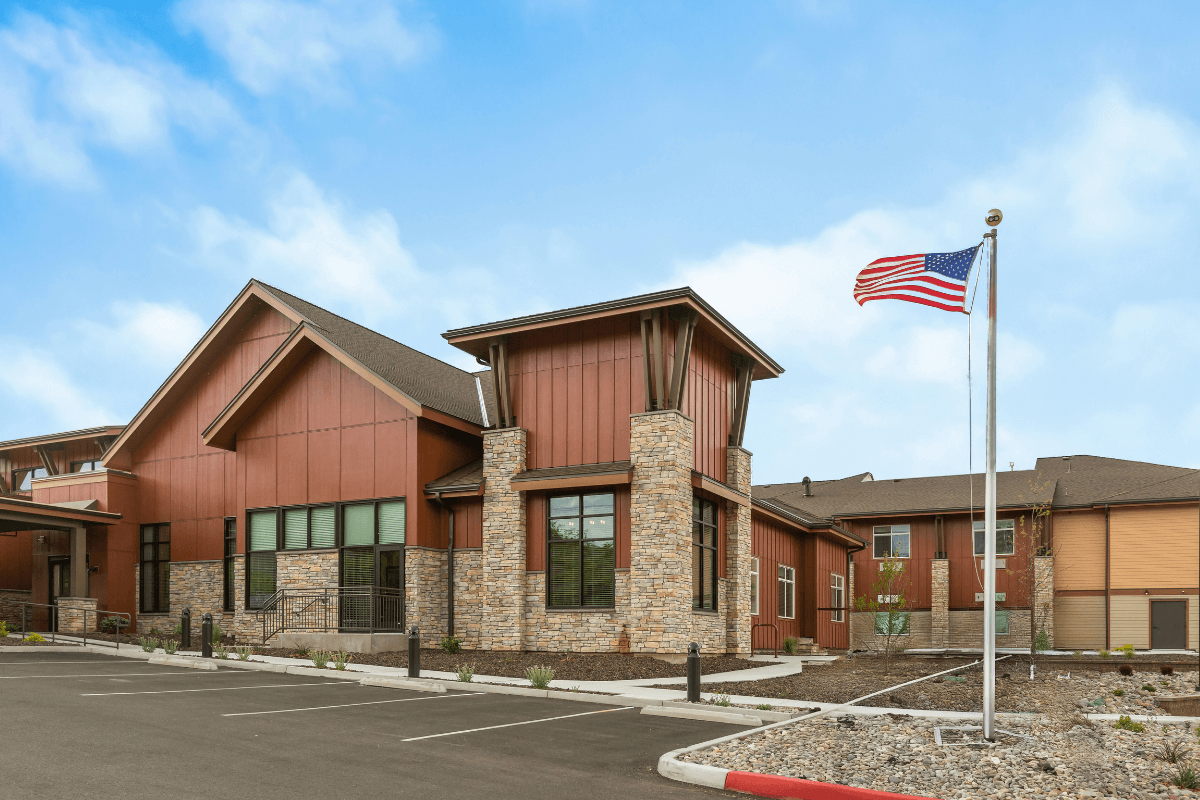


At 1001 North Mountain Street in Carson City, Nevada, Sierra Basin Post Acute runs an 80-bed skilled nursing operation in a neighborhood rated moderately walkable, Walk Score 66. That means a resident’s family can handle some errands on foot, though a car still helps for most trips.
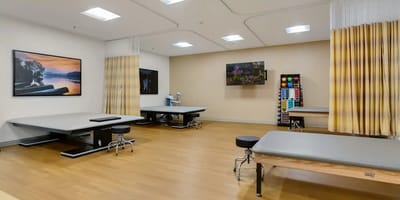
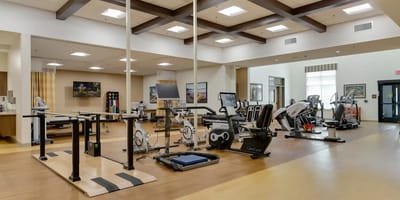
Beyond round-the-clock skilled nursing and outpatient therapy, the facility names coordinated palliative and hospice care, bariatric and digestive disease care, and cancer recovery support as distinct offerings. It also handles complex wound care, catheter management, tracheostomy care, and tube management, the kind of hands-on clinical work that separates a post-acute nursing facility from a purely residential one. An in-house rehab gym backs this up, with therapy and assessment services running six to seven days a week instead of once or twice.
Registered nurses log about an hour and five minutes per resident each day. LPNs add roughly another hour and ten minutes. Nurse aides contribute the largest share, at two and a half hours, bringing the combined nursing total to nearly four hours per resident daily.
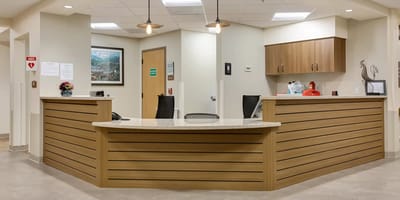
Rooms are semi-private. Residents get nutrition and dietary services, a monthly activity calendar, and help with social outings and transportation. Medicare and private pay are both accepted, covering the two most common ways families fund a stay like this.
This is a place built for people who need real medical support after a hospital stay, or ongoing skilled nursing care that goes beyond daily living help.
Staffing hours
![]() Daily nursing hours per resident by staff type, reported to CMS. Higher is generally better — compare this facility to state and national averages to see where staffing stands.
Daily nursing hours per resident by staff type, reported to CMS. Higher is generally better — compare this facility to state and national averages to see where staffing stands.
Hours per resident per day vs Nevada averages
Total nursing care
![]() This home is ranked 8th out of 40 homes in Nevada for nurse hours. Total adjusted nursing hours per resident per day, combining RN, LPN, and aide time. CMS adjusts this for case-mix so facilities can be fairly compared.
This home is ranked 8th out of 40 homes in Nevada for nurse hours. Total adjusted nursing hours per resident per day, combining RN, LPN, and aide time. CMS adjusts this for case-mix so facilities can be fairly compared.
3h 49m
6% below state avg1 of 6 metrics below state avg
Federal penalties imposed by CMS for regulatory violations, including civil money penalties (fines) and denials of payment for new Medicare/Medicaid admissions.
Source: CMS Penalties Database
No penalties in the past 3 years
No civil money penalties or payment denials were reported in the last 3 years.
These measures show how residents usually do over time at this home, based on health outcomes and preventive care.
Nevada average: 23.4%
Nevada average: 9.8%
Nevada average: 0.8%
Nevada average: 53.7%
Nevada average: 50.6%
Quality measures are calculated from Minimum Data Set (MDS) assessments. For most measures, lower percentages indicate better care quality.
69% of new residents, usually for short-term rehab.
31% of new residents, often for short stays.
Based on CMS SNF Cost Report for fiscal year ending in 12/2023.
Most residents typically stay for a few weeks or months before returning home or moving on.
Most new residents arrive under Medicare (69% of admissions), and a typical Medicare stay runs around 25 days.
Coverage residents most often arrive under.
Coverage residents most often leave under.
![]() 0.5 miles from city center
0.5 miles from city center
![]() Estimated distance in miles from Carson City's city center to Sierra Basin Post Acute's address, calculated via Google Maps.
Estimated distance in miles from Carson City's city center to Sierra Basin Post Acute's address, calculated via Google Maps.
Add your location
Info below is compiled from CMS reports & the TX Health & Human Services Commission (HHSC), senior community websites & trusted data sources such as Walk Score & BBB.
Communities are listed from highest to lowest based on our ranking methodology.
| Ormsby Post Acute Rehab | NH | Carson City | 120 | 74.2% | -7% | 3.93 | +9% | -3% | $60.5k | 100 | 12.5 | 1 | 89 | - | 46 | Pacific Northwest Snf Operations Holdings (Nv) LLC | $9.2M*Fiscal year ending 12/2022These figures are from this home's most recent complete cost report — an older period than most facilities report. Compare with that in mind. | $3.9M*Fiscal year ending 12/2022These figures are from this home's most recent complete cost report — an older period than most facilities report. Compare with that in mind. | 42.6%*Fiscal year ending 12/2022These figures are from this home's most recent complete cost report — an older period than most facilities report. Compare with that in mind. | 295067 | ||||
| Mountain View Health & Rehab | NH SNF | El Paso | 117
Facility
117
TX AVG
78
Rank
#255 / 981 |
67.9%
Facility
67.9%
TX AVG
66.3
Rank
#95 / 175 | +2% | 2.31 | -66% | -36% | $0 | 24 | 8.0 | 3 | 80 | - |
46
Facility
46
TX AVG
42
Rank
#609 / 1346 | Shari Jordan | $6.4MFiscal year ending 06/2024 | $3.9MFiscal year ending 06/2024 | 61.9%Fiscal year ending 06/2024 | 115688 |
Sierra Basin Post Acute is located in CARSON CITY, Nevada.
Here are the financial assistance programs available to residents in Nevada.
Sierra Basin Post Acute has a walk score of 66. Moderately walkable. Some errands can be accomplished on foot, with a mix of nearby amenities.
According to NV state health department records, Sierra Basin Post Acute's license number is 11697-SNF-0.
According to NV state health department records, Sierra Basin Post Acute's license expires on December 31, 2026.
Sierra Basin Post Acute's occupancy is 62.0%.
No, Sierra Basin Post Acute has a no-pet policy.
Sierra Basin Post Acute is registered as a for-profit in NV.
Sierra Basin Post Acute has 80 beds.
Care Cost Calculator: See Prices in Your Area
Nursing Home Data Explorer
Don’t Wait Too Long: 7 Red Flag Signs Your Parent Needs Assisted Living Now
The True Cost of Assisted Living in 2025 – And How Families Are Paying For It
Understanding Senior Living Costs: Pricing Models, Discounts & Financial Assistance


