Explore Open Rooms

1 Contact details
2 What type of senior care service are you looking for?
3 What budget do you have in mind for senior care?
4 How soon do you need to find care?
5 Additional details

Thank you for your interest!

Our team will be in touch shortly to help with next steps.

Nursing Home

Sligo Creek Healthcare

Nursing Home

Sligo Creek Healthcare

7525 Carroll Ave, Takoma Park, MD 20912 View map
Overview of Sligo Creek Healthcare

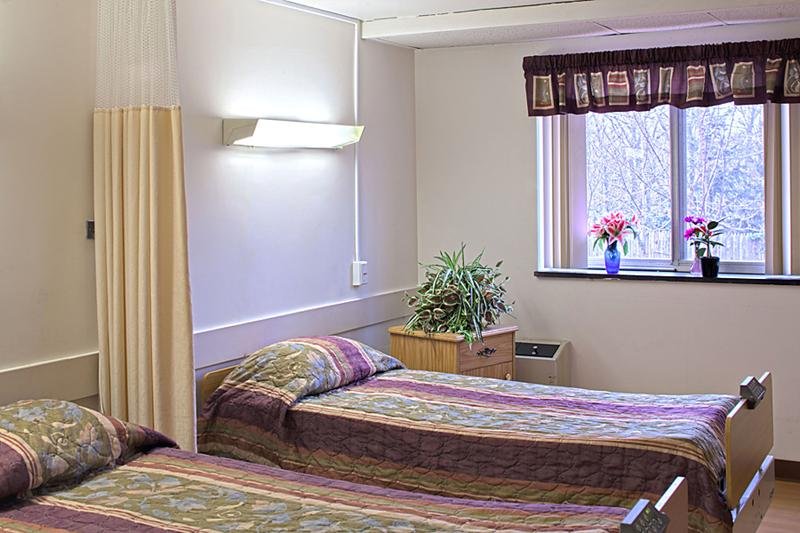
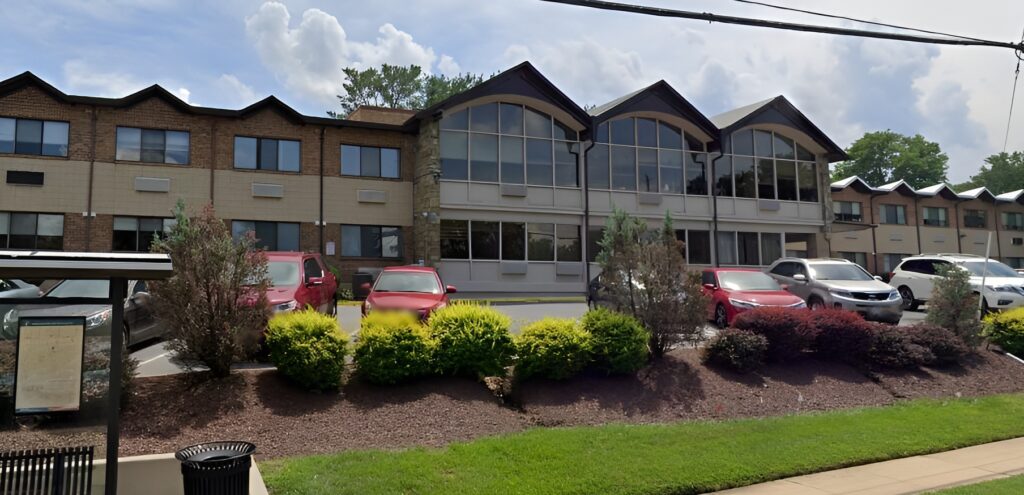
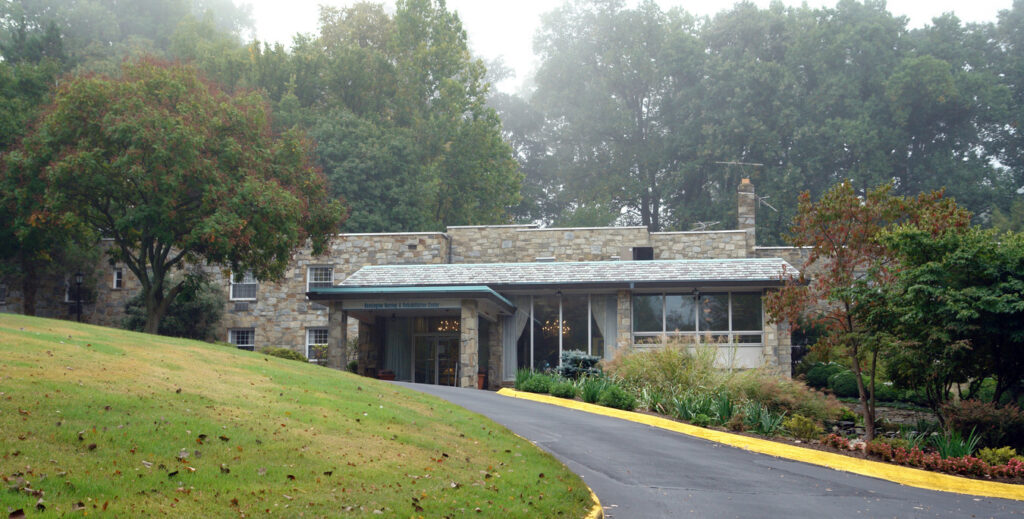
Nestled between the serene parks of Sligo Creek North Neighborhood Park and Takoma-Piney Branch Park in Takoma Park, MD, Sligo Creek Healthcare is a dependable community that offers skilled nursing. With comprehensive care from a compassionate and highly trained team attending to their needs 24/7, residents can rest assured of living comfortably in their golden years. Promoting a bright and friendly environment, the community guarantees comfort and safety while retaining residents’ independence.

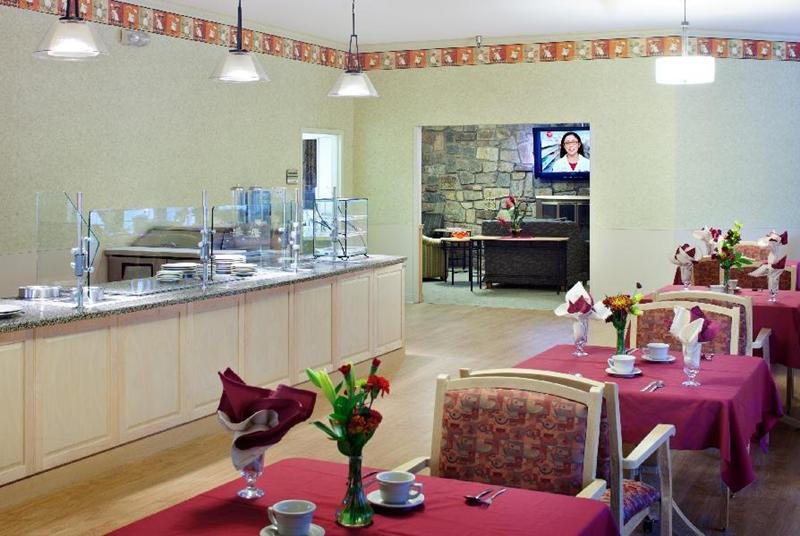
A full calendar of engaging activities and stimulating programs is also conducted for residents to remain happy and actively engaged. Mealtimes are also something to look forward to, with diverse dining options satisfying nutritional needs and preferences. The community’s comprehensive care and specially designed amenities make it an enticing option for those looking for different levels of care.

(301) 270-4200

Quality ratings

Measured by Centers for Medicare & Medicaid Services (CMS)

Overall rating Info The Overall CMS Rating combines results from health inspections, staffing levels and quality measures. Health inspections carry the most weight. Staffing and quality scores can increase or decrease the final rating based on performance compared to state and national standards.
4/5
Maryland average: 3.0/5
Health Inspection Info Based on the results of the facility's three most recent standard inspections and any complaint investigations. CMS reviews the number, scope, and severity of deficiencies, with more recent findings weighted more heavily.
3/5
Maryland average: 2.8/5
Staffing Info Measures average nursing staff hours per resident per day, including Registered Nurses (RNs) and total nursing staff. Ratings are adjusted based on the level of care residents require and are compared to state and national benchmarks.
3/5
Maryland average: 3.0/5
Quality Measures Info Based on clinical and physical health indicators reported to CMS, such as hospital readmissions, falls, pressure ulcers, and improvements in mobility. These measures reflect how well residents' health needs are being managed.
5/5
Maryland average: 3.7/5

Nursing care per resident

Info This shows how many total hours of nursing staff time are available per resident each day. Higher numbers usually mean more staff support.
3h 32m per day

This home provides 7% less nursing time per resident than the Maryland average.

Maryland average: 3h 46m per day

Staffing hours breakdown

Info Hours of care per resident per day, broken down by staff type. Data from CMS Medicare.
Staff type Facility State avg National avg
Registered Nurse (RN) Info Registered nurse hours per resident per day. 34m per day 50m per day 41m per day
Nurse Aide Info Nurse aide hours per resident per day. 1h 56m per day 2h 10m per day 2h 21m per day
Total Nursing (Weekend) Info Total number of nurse staff hours per resident per day on weekends. 3h 2m per day 3h 29m per day 3h 26m per day
Physical Therapist Info Physical therapist staff hours per resident per day. 7m per day 5m per day 4m per day
RN (Weekend) Info Registered nurse hours per resident per day on weekends. 27m per day 37m per day 29m per day

Capacity and availability

Medium-capacity home

Offers a balance of services and community atmosphere.

Total beds 102

This home usually has limited availability

Occupancy is moderate, suggesting balanced demand.

Similar demand to the Maryland average
Occupancy rate 89.4%
Residents per day (avg) 94
Occupancy rate
89.4%
Residents per day (avg)
94

Who this home usually serves

TYPE OF STAY

Mostly short-term rehab stays

Most residents typically stay for a few weeks or months before returning home or moving on.

Might be optimal for
Short stays Recovery Medicare-covered care

Breakdown by payment type

Medicare

42% of new residents, usually for short-term rehab.

Typical stay 1 - 2 months

Private pay

39% of new residents, often for short stays.

Typical stay 1 months

Medicaid

19% of new residents, often for long-term daily care.

Typical stay 1 years

Finances and operations

Privately-owned community
Operated by a business corporation.
Home revenue
$6.3M
Profit
$686.1K
Privately-owned community Operated by a business corporation.
Home revenue
$6,252,337.00
Profit
$686,147.00
Payroll costs Info The portion of the home's budget spent on staff, including nurses, caregivers, and other employees who support care and operations.
$2.2M
34.8% of revenue
Other operating costs Info All remaining costs needed to run the home, such as food, utilities, building maintenance, supplies and administrative expenses.
$3.4M
Total costs $5.6M

What does this home offer?

Accepts Medicaid icon

Accept Medicaid: Yes

Housing options icon

Housing Options: 1 Bed / 2 Bed

Building type icon
Building type icon

Building Type: Single-story

Dining services icon

Dining Services

Beauty services icon

Beauty Services

Transportation services icon

Transportation Services

Housekeeping icon
Housekeeping icon

Housekeeping Services

Recreational activities icon

Recreational Activities
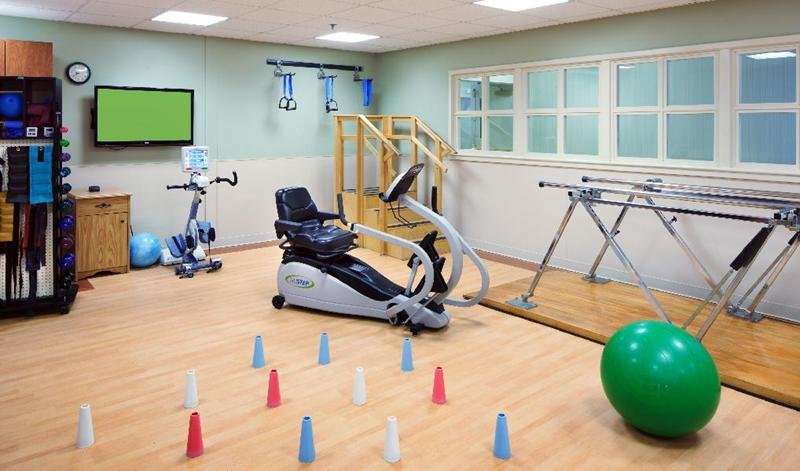
Exercise program icon

Exercise Programs

Types of Care at Sligo Creek Healthcare

Nursing Home
Contact Sligo Creek Healthcare

Health Inspection History

Inspections
Total health inspections 4

Maryland average 3.9


Last Health inspection on Oct 2025

Total health citations 42

Maryland average 49.9

Citations per inspection
10.5

Maryland average 12.81


Health citations are formal notices following inspections when they fail to comply with safety and care standards.

37 of 42 citations resulted from standard inspections; 3 of 42 resulted from complaint investigations; and 2 of 42 came from combined inspections (standard and complaint).

Breakdown of citation severity (last 3 years)
Critical Health citations More info 1
100% worse than Maryland average

Maryland average: 0.5


Serious Health citations More info 0
100% better than Maryland average

Maryland average: 0.6

1 critical citation More info Maryland average: 0.5

0 serious citations More info Maryland average: 0.6

36 moderate citations More info Maryland average: 47.2

5 minor citations More info Maryland average: 1.7
Citations history (last 3 years)
Abuse/Neglect moderate citation Info Issues related to protecting resident's from harm, including abuse, neglect, or mistreatment. Oct 21, 2025
Corrected

Quality of Care critical citation Info Issues related to how well residents receive appropriate treatment and support for their medical and daily care needs. Oct 21, 2025
Corrected

Resident Rights moderate citation Info Issues related to resident's rights, including dignity, privacy, and the ability to make decisions about their care. Oct 21, 2025
Corrected

Administration moderate citation Info Issues related to how the facility is managed, including policies, procedures, and compliance with regulations. Feb 20, 2025
Corrected

Compare Nursing Homes around Montgomery County The information below is reported by the Maryland Department of Health, Office of Health Care Quality.

5 facilities compared · CMS & MD Dept. of Health data · Updated Mar 2026

Montcare Bethesda
HC

Home Care Professional care delivered in the person's own home — from companionship and errands to skilled nursing and therapy. Allows seniors to age in place. Medicare covers skilled home health when medically necessary.

MC

Memory Care Secured, specialized care for people living with Alzheimer's or dementia. Staff trained in cognitive impairment, with higher staff-to-resident ratios and an environment designed to reduce confusion and wandering risk.

NH

Nursing Home Licensed facility providing 24/7 skilled nursing care for residents with complex, ongoing medical needs. Staffed by RNs, LPNs, and CNAs. Inspected and star-rated annually by CMS. Accepts Medicare (short-term rehab) and Medicaid (long-term care).

Bethesda
110
84.7%
+3%
3.04
-13%
-19%
0
34
0
105
-
70
Ribikow, Jack
$5,1M
$1,7M
33.7%
215095
Private / Semi-Private Rooms
Sligo Creek Healthcare
NH

Nursing Home Licensed facility providing 24/7 skilled nursing care for residents with complex, ongoing medical needs. Staffed by RNs, LPNs, and CNAs. Inspected and star-rated annually by CMS. Accepts Medicare (short-term rehab) and Medicaid (long-term care).

Takoma Park
102
89.4%
+9%
3.53
-22%
-7%
0
42
1
94
-
60
Woodside Park Md Holdco Llc
$6,3M
$2,2M
34.8%
215327
1 Bed / 2 Bed
Kensington Healthcare Center
HC

Home Care Professional care delivered in the person's own home — from companionship and errands to skilled nursing and therapy. Allows seniors to age in place. Medicare covers skilled home health when medically necessary.

MC

Memory Care Secured, specialized care for people living with Alzheimer's or dementia. Staff trained in cognitive impairment, with higher staff-to-resident ratios and an environment designed to reduce confusion and wandering risk.

NH

Nursing Home Licensed facility providing 24/7 skilled nursing care for residents with complex, ongoing medical needs. Staffed by RNs, LPNs, and CNAs. Inspected and star-rated annually by CMS. Accepts Medicare (short-term rehab) and Medicaid (long-term care).

RC

Respite Care Short-term temporary care — days to weeks — to give family caregivers a break. Full care provided during the stay. Often used after hospitalization or to trial a facility before a permanent placement decision.

Montgomery County
140
94.8%
+15%
3.83
-30%
+2%
1
42
2
136
-
32
Wo Holdings Llc
$21,3M
$6,5M
30.4%
215043
Private / Semi-Private Rooms
Montcare Wheaton
HC

Home Care Professional care delivered in the person's own home — from companionship and errands to skilled nursing and therapy. Allows seniors to age in place. Medicare covers skilled home health when medically necessary.

MC

Memory Care Secured, specialized care for people living with Alzheimer's or dementia. Staff trained in cognitive impairment, with higher staff-to-resident ratios and an environment designed to reduce confusion and wandering risk.

NH

Nursing Home Licensed facility providing 24/7 skilled nursing care for residents with complex, ongoing medical needs. Staffed by RNs, LPNs, and CNAs. Inspected and star-rated annually by CMS. Accepts Medicare (short-term rehab) and Medicaid (long-term care).

Montgomery County (Wheaton)
94
89.0%
+8%
3.10
-4%
-18%
0
58
0
89
-
63
Md3 Operator Holdco Llc
$3,3M
$1,3M
39%
215048
Private / Semi-Private Rooms
Bel Pre Healthcare Center
-
HC

Home Care Professional care delivered in the person's own home — from companionship and errands to skilled nursing and therapy. Allows seniors to age in place. Medicare covers skilled home health when medically necessary.

MC

Memory Care Secured, specialized care for people living with Alzheimer's or dementia. Staff trained in cognitive impairment, with higher staff-to-resident ratios and an environment designed to reduce confusion and wandering risk.

NH

Nursing Home Licensed facility providing 24/7 skilled nursing care for residents with complex, ongoing medical needs. Staffed by RNs, LPNs, and CNAs. Inspected and star-rated annually by CMS. Accepts Medicare (short-term rehab) and Medicaid (long-term care).

RC

Respite Care Short-term temporary care — days to weeks — to give family caregivers a break. Full care provided during the stay. Often used after hospitalization or to trial a facility before a permanent placement decision.

Montgomery County
-
-
-
-
-
-
-
-
-
0
0
0
-
F
52
-
-
-
-
-
Private / Semi-Private Rooms

Places of interest near Sligo Creek Healthcare

Address 0.5 miles from city center
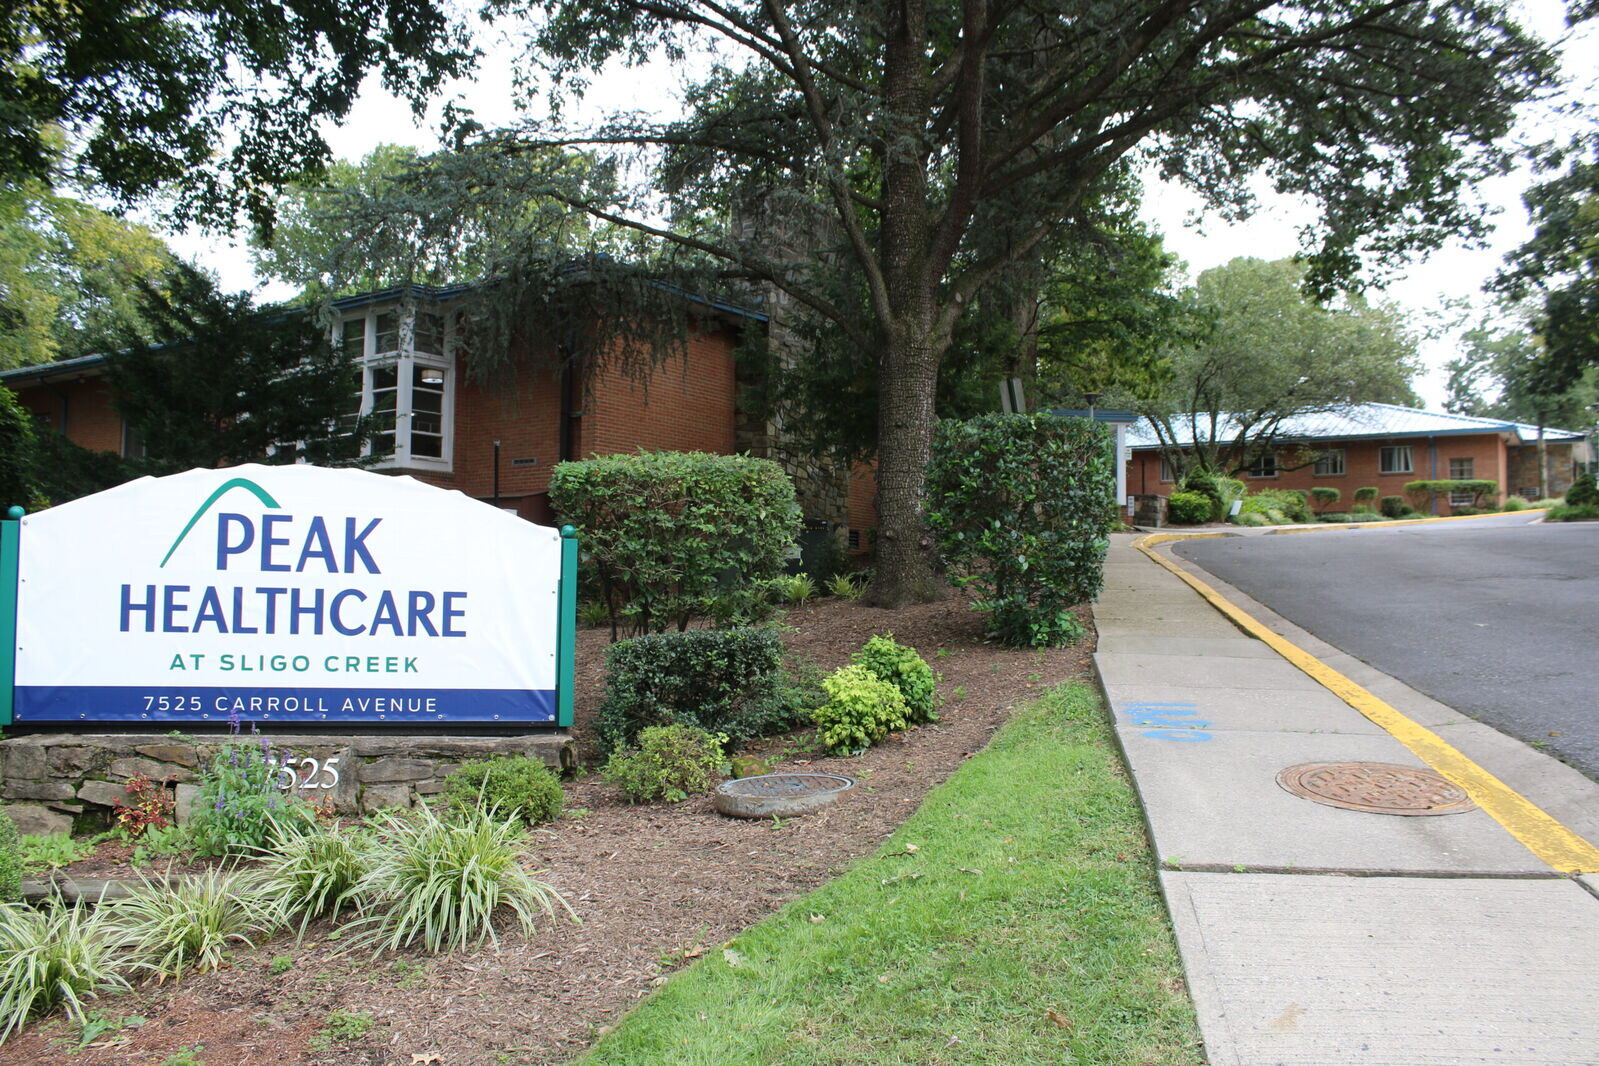
Address 7525 Carroll Ave, Takoma Park, MD 20912

Calculate Travel Distance to Sligo Creek Healthcare

Add your location

Address

Staffing Data (Q2 2025)

This data corresponds to Q2 2025 and is based on CMS Payroll-Based Journal.

Total staff 116
Employees 109
Contractors 7
Staff to resident ratio 1.26:1
30% worse than Maryland average

Maryland average ratio: 1.81:1

Avg staff/day 50
Average shift 7.8 hours
0% compared with Maryland average

Maryland average: 8 hours

Total staff hours (quarter) 35,543
Nursing staff breakdown
Registered Nurse

Manages medical care and health needs.

Total count 12
Average shift length Info Average shift length. Calculated as total hours divided by days worked and average staff per day. 8.2 hours

This role is partially covered by contractors.

Licensed Practical Nurse

Assists with medical care and medications.

Total count 21
Average shift length Info Average shift length. Calculated as total hours divided by days worked and average staff per day. 8.5 hours

No contractors work on this role.

Certified Nursing Assistant

Helps with daily care and mobility.

Total count 48
Average shift length Info Average shift length. Calculated as total hours divided by days worked and average staff per day. 8 hours

This role is partially covered by contractors.

Contractor staffing

Total hours from contractors

2%

700 contractor hours this quarter

Certified Nursing Assistant: 5 Registered Nurse: 1 Occupational Therapy Aide: 1
Staff by category
Certified Nursing Assistant4354816,61391100%8
Licensed Practical Nurse210216,55491100%8.5
Registered Nurse111123,43691100%8.2
Clinical Nurse Specialist5051,4157582%7.4
Other Dietary Services Staff20297691100%6.8
Physical Therapy Assistant4048946875%7.3
Respiratory Therapy Technician6068598088%6.8
Physical Therapy Aide2027326774%10
Medication Aide/Technician2027258897%7.8
Administrator1015126470%8
Nurse Practitioner1015126470%8
RN Director of Nursing1015126470%8
Mental Health Service Worker1015126470%8
Qualified Social Worker1014365459%8.1
Occupational Therapy Aide1123464044%8.5
Dental Services Staff1012496369%4
Therapeutic Recreation Specialist2021554853%3.2
Medical Director101651314%5
Dietitian30343910%4.3
48 Certified Nursing Assistant
% of Days 100%
21 Licensed Practical Nurse
% of Days 100%
12 Registered Nurse
% of Days 100%
5 Clinical Nurse Specialist
% of Days 82%
2 Other Dietary Services Staff
% of Days 100%
4 Physical Therapy Assistant
% of Days 75%
6 Respiratory Therapy Technician
% of Days 88%
2 Physical Therapy Aide
% of Days 74%
2 Medication Aide/Technician
% of Days 97%
1 Administrator
% of Days 70%
1 Nurse Practitioner
% of Days 70%
1 RN Director of Nursing
% of Days 70%
1 Mental Health Service Worker
% of Days 70%
1 Qualified Social Worker
% of Days 59%
2 Occupational Therapy Aide
% of Days 44%
1 Dental Services Staff
% of Days 69%
2 Therapeutic Recreation Specialist
% of Days 53%
1 Medical Director
% of Days 14%
3 Dietitian
% of Days 10%

Facility Characteristics

Source: CMS Long-Term Care Facility Characteristics (Data as of Jan 2026)

Total census
92 residents
Residents by payment source
Medicare
12 residents (13%)
Medicaid
71 residents (77.2%)
Private pay or other
9 residents (9.8%)
Programs & Services
Residents' Group

Residents meet regularly to discuss policies, care quality, and activities

Active Resident Council

Organized group of residents that meets regularly to discuss facility policies, quality of life, and activities.

Quality of care over time

These measures show how residents usually do over time at this home, based on health outcomes and preventive care.

High-risk clinical events score Info A composite score based on pressure ulcers, falls with injury, weight loss, walking ability decline, and activities of daily living decline. 6.3
51% better than Maryland average

Maryland average: 12.9

Functional decline score Info A composite score based on activities of daily living decline, walking ability decline, and incontinence. 6.8
73% better than Maryland average

Maryland average: 25.7

Long-stay resident measures
Significantly above average Maryland avg: 3.8 Info CMS star rating based on long-stay quality measure performance. 5 stars = significantly above average, 1 star = significantly below average.
Need for Help with Daily Activities Increased Info Percent of long-stay residents whose need for help with daily activities has increased 7.1%
70% better than Maryland average

Maryland average: 23.7%

Walking Ability Worsened Info Percent of long-stay residents whose ability to move independently worsened 8.1%
71% better than Maryland average

Maryland average: 27.7%

Low Risk Residents with Bowel/Bladder Incontinence Info Percent of low risk long-stay residents who lose control of their bowels or bladder 5.2%
80% better than Maryland average

Maryland average: 25.9%

Falls with Major Injury Info Percent of long-stay residents experiencing one or more falls with major injury 0.6%
72% better than Maryland average

Maryland average: 2.3%

High Risk Residents with Pressure Ulcers Info Percent of long-stay high risk residents with pressure ulcers 8.5%
31% worse than Maryland average

Maryland average: 6.5%

Urinary Tract Infection Info Percent of long-stay residents with a urinary tract infection 0.3%
79% better than Maryland average

Maryland average: 1.6%

Lost Too Much Weight Info Percent of long-stay residents who lose too much weight 7.1%
22% worse than Maryland average

Maryland average: 5.8%

Depressive Symptoms Info Percent of long-stay residents who have depressive symptoms 6.6%
67% better than Maryland average

Maryland average: 20.2%

Antipsychotic Use Info Percent of long-stay residents who received an antipsychotic medication 1.4%
89% better than Maryland average

Maryland average: 12.9%

Pneumococcal Vaccine Info Percent of long-stay residents assessed and appropriately given the pneumococcal vaccine 46.3%
50% worse than Maryland average

Maryland average: 92.0%

Influenza Vaccine Info Percent of long-stay residents assessed and appropriately given the seasonal influenza vaccine 80.9%
16% worse than Maryland average

Maryland average: 96.6%

Hospitalizations per 1,000 days Info Number of hospitalizations per 1,000 long-stay resident days. 0.75
43% better than Maryland average

Maryland average: 1.32

ED visits per 1,000 days Info Number of outpatient emergency department visits per 1,000 long-stay resident days. 0.18
85% better than Maryland average

Maryland average: 1.21

Short-stay resident measures
Significantly above average Maryland avg: 3.7 Info CMS star rating based on short-stay quality measure performance. 5 stars = much above average, 1 star = much below average.
Pneumococcal Vaccine Info Percent of short-stay residents assessed and appropriately given the pneumococcal vaccine 31.6%
60% worse than Maryland average

Maryland average: 78.4%

Antipsychotic medication increase Info Percent of short-stay residents who newly received an antipsychotic medication 0.5%
62% better than Maryland average

Maryland average: 1.4%

Influenza Vaccine Info Percent of short-stay residents assessed and appropriately given the seasonal influenza vaccine 18.1%
78% worse than Maryland average

Maryland average: 80.6%

Re-hospitalized after SNF stay Info Percentage of short-stay residents who were re-hospitalized after their nursing home admission. 13.6%
36% better than Maryland average

Maryland average: 21.2%

Emergency department visits Info Percentage of short-stay residents who had an outpatient emergency department visit. 6.0%
39% better than Maryland average

Maryland average: 9.9%

Falls with major injury Info Percentage of SNF residents who experience falls with major injury during their stay. 0.9%
22% worse than Maryland average

Maryland average: 0.8%

Ability to care for self at discharge Info Percentage of residents at or above expected ability to care for themselves at discharge. 47.4%
12% worse than Maryland average

Maryland average: 53.7%

Successful return to home or community Info Rate of successful return to home or community from a skilled nursing facility. 41.6%
18% worse than Maryland average

Maryland average: 50.6%

Penalties and fines

Federal penalties imposed by CMS for regulatory violations, including civil money penalties (fines) and denials of payment for new Medicare/Medicaid admissions.

Source: CMS Penalties Database (Data as of Jan 2026)

Total fines amount $0
100% lower than Maryland average

Maryland average: $61K

Number of fines 0
100% fewer fines than Maryland average

Maryland average: 1.5

Payment Denials Info Serious action where Medicare and/or Medicaid temporarily stops payments for new residents until issues are fixed. 1
650% more payment denials than Maryland average

Maryland average: 0.1

Fines amount comparison
This facility $0
Maryland average $61K
Penalty History

Penalties are imposed by CMS for violations of federal nursing home regulations.

Payment Denial Info Serious action where Medicare and/or Medicaid temporarily stops payments for new residents until issues are fixed. Feb 20, 2025
17 days

Last updated: Jan 2026

Guides for Better Senior Living

Care Cost Calculator: See Prices in Your Area

Nursing Home Data Explorer

Don’t Wait Too Long: 7 Red Flag Signs Your Parent Needs Assisted Living Now

The True Cost of Assisted Living in 2025 – And How Families Are Paying For It

Understanding Senior Living Costs: Pricing Models, Discounts & Financial Assistance

Financial Aid for Maryland Seniors

Get financial aid guidance

Community Options Waiver

Maryland Medicaid Community Options Waiver

Age 65+ or disabled, Maryland resident, Medicaid- eligible, nursing home-level care need.

~$2,829/month (300% FBR, individual).

$2,000 (individual), $3,000 (couple) (excludes home, car).

High urban demand; rural outreach efforts.

Senior Care Program

Maryland Senior Care

Age 65+, Maryland resident, at risk of nursing home placement.

~$2,000/month (individual, varies by county).

$11,000 (individual).

Limited funding; waitlists common in high-demand areas.

Maryland Nursing Home Medicaid

Maryland Medical Assistance (Medicaid) Nursing Home Program

Age 65+, Maryland resident, Medicaid-eligible, requires nursing home-level care.

$943/month (individual); most income applied to care costs.

$2,500 (individual), $3,000 (couple); spousal protections up to $155,356.

Home equity limit $636,000; estate recovery applies post-55.

Senior Assisted Living Subsidy Program

Maryland Senior Assisted Living Group Home Subsidy

Age 62+, Maryland resident, in or moving to approved assisted living, low/moderate income.

~$34,000/year (individual, varies by county).

Not strict; prioritizes low-income.

Not available statewide; facility must be licensed by MDH.

Veterans Aid and Attendance (A&A) Benefit

Maryland VA Aid and Attendance

Wartime veteran/spouse, age 65+ or disabled, needs ADL help, Maryland resident.

Net income minus medical expenses < $1,984/month (individual with A&A).

$155,356 (net worth limit).

High veteran population in suburban/rural areas.

Senior Prescription Drug Assistance Program (SPDAP)

Maryland Senior Prescription Drug Assistance Program

Age 65+, Maryland resident (6+ months), Medicare Part D enrolled.

$48,560/year (individual, 300% FPL).

None specified.

Supplements Medicare Part D; annual enrollment required.

Medicare Savings Programs (MSP)

Maryland Medicare Savings Programs

Age 65+, Maryland resident, Medicare Part A/B enrollee.

$2,014/month (QMB), $2,706/month (SLMB/QI, individual).

$9,090 (individual), $13,630 (couple).

Includes QMB, SLMB, QI categories.

Community Personal Assistance Services (CPAS)

Maryland Medicaid Community Personal Assistance Services

Age 65+, Maryland resident, Medicaid-eligible, needs ADL assistance.

$943/month (individual); spend-down available.

$2,500 (individual), $3,000 (couple).

Consumer-directed option allows hiring family caregivers.

Tour Icon
Planning a tour? Check our touring checklist.
Chat Icon
Thinking of living here? We can help you speak to a current resident