Kensington Healthcare Center

Nursing Home in Montgomery County

CMS overall rating Info The Overall CMS Rating is scored from 1 to 5 stars and combines results from health inspections, staffing levels, and quality measures. Health inspections carry the most weight. Staffing and quality scores can increase or decrease the final rating based on performance compared to state and national standards.

Overview of Kensington Healthcare Center

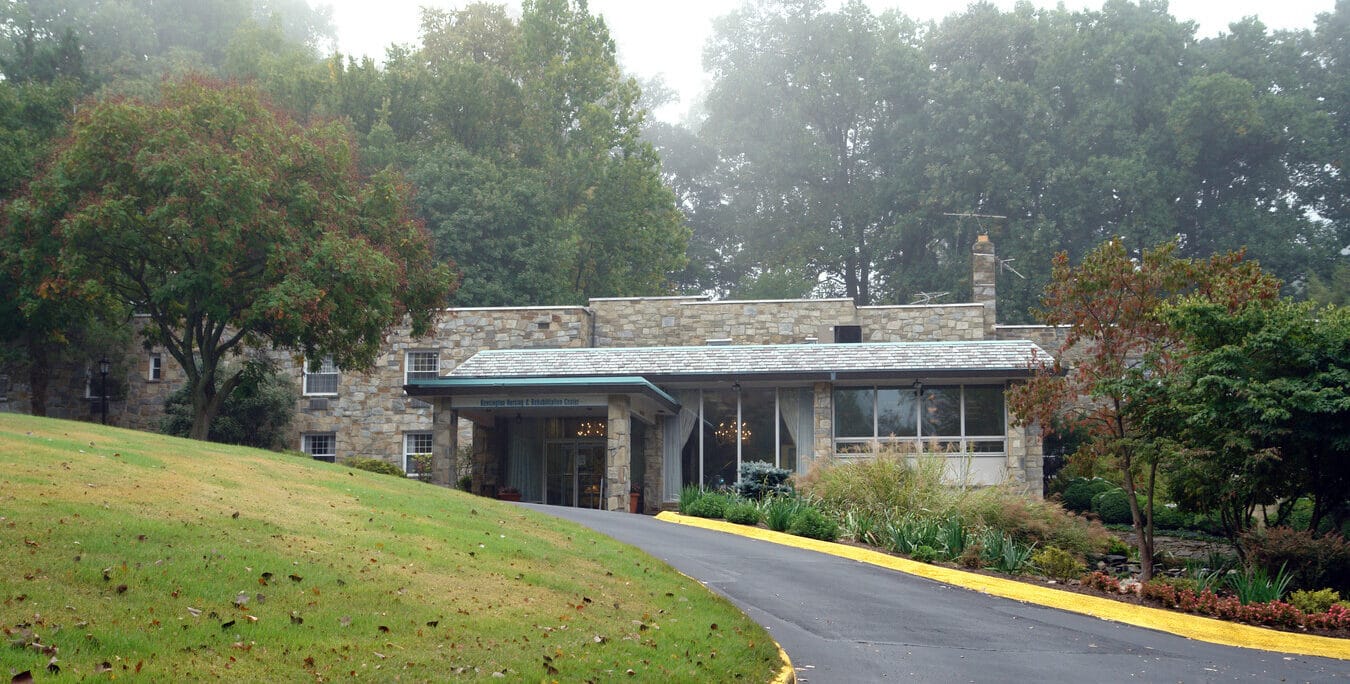
An astounding community set in the peaceful residential area of McComas Avenue, Kensington, MD, Kensington Healthcare Center offers skilled nursing. With a wide range of care services, including short-term rehabilitation, long-term care, and therapy services, residents keep peace of mind and receive the utmost care they deserve. A respectful and highly trained team helps residents with their day-to-day activities, ensuring a maintenance-free lifestyle.

Dedicated to improving residents’ well-being, the community also conducts enriching activities and engaging programs tailored to their enjoyment and wellness. Indulge in delicious and healthy meals that cater to nutritional needs and tastes. Wound care, hospice care, and respite care are also available to meet residents’ ever-changing needs. Find the care you need in the community with its comprehensive care and specially designed amenities.

(301) 933-0060

Quality ratings

Measured by Centers for Medicare & Medicaid Services (CMS)

Overall rating Info The Overall CMS Rating combines results from health inspections, staffing levels and quality measures. Health inspections carry the most weight. Staffing and quality scores can increase or decrease the final rating based on performance compared to state and national standards.
3/5 ■ Avg Maryland average: 3.0/5
Health Inspection Info Based on the results of the facility's three most recent standard inspections and any complaint investigations. CMS reviews the number, scope, and severity of deficiencies, with more recent findings weighted more heavily.
3/5 ▲ 0.2 Maryland average: 2.8/5
Staffing Info Measures average nursing staff hours per resident per day, including Registered Nurses (RNs) and total nursing staff. Ratings are adjusted based on the level of care residents require and are compared to state and national benchmarks.
3/5 ■ Avg Maryland average: 3.0/5
Quality Measures Info Based on clinical and physical health indicators reported to CMS, such as hospital readmissions, falls, pressure ulcers, and improvements in mobility. These measures reflect how well residents' health needs are being managed.
4/5 ▲ 0.3 Maryland average: 3.7/5

Staffing hours breakdown

Info Daily nursing hours per resident by staff type, reported to CMS. Higher is generally better — compare this facility to state and national averages to see where staffing stands.

Hours per resident per day — compared to Maryland state averages

Total nursing care / resident Info This home is ranked 32nd out of 112 homes in Maryland.

Total adjusted nursing hours per resident per day, combining RN, LPN, and aide time. CMS adjusts this for case-mix so facilities can be fairly compared.
3h 50m per day
Rank #32 / 112Nurse hours — state benchmarkedThis home is ranked 32nd out of 112 homes in Maryland.Shows adjusted nurse hours per resident per day benchmarked to the Maryland average, with a ranking across 112 Maryland SNFs. More hours mean more direct care. The national average is about 3.5 hrs; below 3.0 is a red flag.
This facility Maryland avg (3h 46m per day)
vs Maryland avg
+2%

6 of 6 metrics below state avg

Staff type Hours / day vs state avg
Registered Nurse (RN) Info RNs hold the highest nursing license and can assess residents, interpret test results, and direct care plans. More RN hours per day often signals stronger clinical oversight and faster response to health changes. 39m per day ▼ 22% State avg: 50m per day · National avg: 41m per day
LPN / LVN Info Licensed Practical Nurses (LPNs) or Licensed Vocational Nurses (LVNs) deliver routine hands-on care — medication administration, wound dressing, and monitoring vital signs. They work under RN supervision and make up a large share of daily bedside care. 45m per day ▼ 17% State avg: 54m per day · National avg: 52m per day
Nurse Aide Info Certified Nurse Aides (CNAs) provide the most direct day-to-day assistance: bathing, dressing, feeding, and mobility. Nurse aide hours are typically the largest staffing category and directly affect residents' quality of life. 2h 6m per day ▼ 3% State avg: 2h 10m per day · National avg: 2h 21m per day
Total Nursing (Weekend) Info Combined nursing hours (RN + LPN + Nurse Aide) per resident per day on weekends. Staffing often drops on weekends — this figure reveals whether the facility maintains adequate coverage outside of weekday hours. 2h 50m per day ▼ 19% State avg: 3h 29m per day · National avg: 3h 26m per day
Physical Therapist Info Hours per resident per day provided by licensed Physical Therapists (PTs) or PT Assistants. PT services help residents recover mobility after injury or illness and are especially important for post-acute (short-stay) rehabilitation. 2m per day ▼ 60% State avg: 5m per day · National avg: 4m per day
RN (Weekend) Info Registered nurse hours specifically on weekends. Facilities sometimes reduce RN presence on Saturdays and Sundays — a low weekend RN figure compared to weekday hours can indicate reduced clinical oversight when most administrative staff are absent. 25m per day ▼ 32% State avg: 37m per day · National avg: 29m per day

Capacity and availability

This home usually has limited availability

Occupancy between 85% and 95% suggests balanced demand.

Higher occupancy than the Maryland average: 82.4%
Occupancy rate 94.8% Rank #10 / 117Occupancy rate — state benchmarkedThis home is ranked 10th out of 117 homes in Maryland.Shows this facility's occupancy rate versus the Maryland average, with its statewide rank out of 117. Higher occupancy signals strong local demand and financial stability.
Avg. Length of Stay 189 days
Occupancy rate
94.8% Rank #10 / 117Occupancy rate — state benchmarkedThis home is ranked 10th out of 117 homes in Maryland.Shows this facility's occupancy rate versus the Maryland average, with its statewide rank out of 117. Higher occupancy signals strong local demand and financial stability.
Avg. Length of Stay
189 days

Who this home usually serves

TYPE OF STAY

Primarily long-term care, limited rehab

Most residents stay long-term, while a smaller portion are admitted for short-term rehab.

Might be optimal for
Long-term residence Daily assistance Occasional rehab needs

Breakdown by payment type

Medicare

17% of new residents, usually for short-term rehab.

Typical stay 1 - 2 months

Private pay

63% of new residents, often for short stays.

Typical stay 15 days

Medicaid

20% of new residents, often for long-term daily care.

Typical stay 2 - 3 years

Finances and operations

Privately-owned community
Operated by a business corporation.
Home revenue
$21.4M
Profit
$122.4K
Privately-owned community Operated by a business corporation.
Home revenue
$21.4M Rank #35 / 117Revenue — state benchmarkedThis home is ranked 35th out of 117 homes in Maryland.Shows this facility's annual revenue compared to the Maryland SNF average. Higher revenue generally means more resources for staffing and capital — read alongside Payroll %.
Profit
$122.4K
Payroll costs Info The portion of the home's budget spent on staff, including nurses, caregivers, and other employees who support care and operations. Rank #38 / 117Payroll — state benchmarkedThis home is ranked 38th out of 117 homes in Maryland.Shows total annual staff payroll benchmarked to the Maryland average. Higher payroll investment relative to peers often signals better staffing and less reliance on cheaper contract labor.
$6.5M
30.2% of revenue Rank #69 / 117Payroll % — state benchmarkedThis home is ranked 69th out of 117 homes in Maryland.Shows payroll as a percentage of revenue versus the Maryland average. Well-run SNFs often land around 55–65%. Below 25% may signal understaffing or heavy agency use — read with Staffing ratings.
Other operating costs Info All remaining costs needed to run the home, such as food, utilities, building maintenance, supplies and administrative expenses.
$14.8M
Total costs $21.3M
Walk Score
Walk Score: 32 / 100 Rank #71 / 99Walk Score — state benchmarkedThis home is ranked 71st out of 99 homes in Maryland.Shows how walkable this facility's neighborhood is compared to the average Walk Score across Maryland SNFs. Higher scores benefit residents, families, and staff.
Somewhat walkable. A few nearby services may be reachable on foot, but most trips require transportation.

About this community

Therapy & Rehabilitation

1 service
Rehabilitation Services

Amenities & Lifestyle

Specific ProgramsSkilled Nursing Facilities & Rehabilitation Services, Memory Care Services

What does this home offer?

Accepts Medicaid icon

Accept Medicaid: Yes

Housing options icon

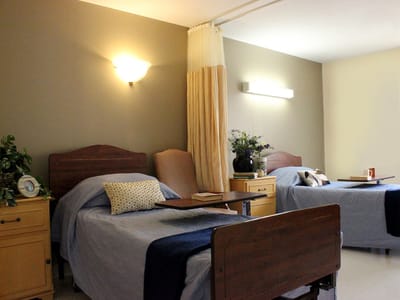
Housing Options: Private / Semi-Private Rooms

Building type icon
Building type icon

Building Type: 2-story

Dining services icon

Dining Services

Housekeeping icon
Housekeeping icon

Housekeeping Services

Recreational activities icon

Recreational Activities
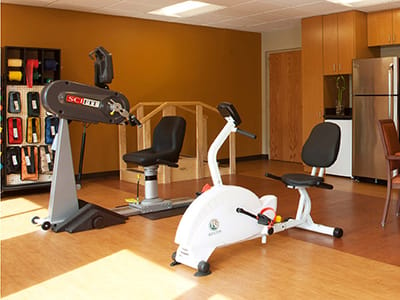
Exercise program icon

Exercise Programs

Types of Care at Kensington Healthcare Center

Nursing Home Memory Care Hospice Care Respite Care

Contact Kensington Healthcare Center

Health Inspection History

Inspections
Total health inspections 4

Maryland average 3.9


Last Health inspection on Feb 2025

Total health citations
42 Rank #61 / 116Health citations — state benchmarkedThis home is ranked 61st out of 116 homes in Maryland.Shows this facility's total health deficiency citations benchmarked to the Maryland state average, with a ranking across all 116 MD SNFs. Lower citation counts earn a better rank.

Maryland average 49.9

Citations per inspection
10.5

Maryland average 12.81


Health citations are formal notices following inspections when they fail to comply with safety and care standards.

25 of 42 citations resulted from standard inspections; 15 of 42 resulted from complaint investigations; and 2 of 42 came from combined inspections (standard and complaint).

Breakdown of citation severity (last 3 years)
Critical Health citations More info
0 Rank #29 / 55Severe citations — state benchmarkedThis home is ranked 29th out of 55 homes in Maryland.Shows citations where actual resident harm occurred, compared to the Maryland average and ranked across 55 SNFs statewide. Even a single severe citation is significant — lower is always better.
100% better than Maryland average

Maryland average: 0.5


Serious Health citations More info 2
233% worse than Maryland average

Maryland average: 0.6

0 critical citations More info Maryland average: 0.5

2 serious citations More info Maryland average: 0.6

39 moderate citations More info Maryland average: 47.2

1 minor citation More info Maryland average: 1.7
Citations history (last 3 years)
Abuse/Neglect moderate citation Info Issues related to protecting resident's from harm, including abuse, neglect, or mistreatment. Feb 27, 2025
Corrected

Abuse/Neglect moderate citation Info Issues related to protecting resident's from harm, including abuse, neglect, or mistreatment. Feb 27, 2025
Corrected

Environmental moderate citation Info Issues related to building safety, cleanliness, maintenance, and overall living conditions. Feb 27, 2025
Corrected

Environmental moderate citation Info Issues related to building safety, cleanliness, maintenance, and overall living conditions. Feb 27, 2025
Corrected

Compare Nursing Homes around Montgomery County The information below is reported by the Maryland Department of Health, Office of Health Care Quality.

5 facilities compared · CMS & MD Dept. of Health data · Updated Apr 2026

Filter by care type
Montcare Bethesda
HC

Home Care Professional care delivered in the person's own home — from companionship and errands to skilled nursing and therapy. Allows seniors to age in place. Medicare covers skilled home health when medically necessary.

MC

Memory Care Secured, specialized care for people living with Alzheimer's or dementia. Staff trained in cognitive impairment, with higher staff-to-resident ratios and an environment designed to reduce confusion and wandering risk.

NH

Nursing Home Licensed facility providing 24/7 skilled nursing care for residents with complex, ongoing medical needs. Staffed by RNs, LPNs, and CNAs. Inspected and star-rated annually by CMS. Accepts Medicare (short-term rehab) and Medicaid (long-term care).

Bethesda (Georgetown Village) 110 84.7% +3% 3.04 -13% -19% 0 34 8.5 0 105 - 70 Ribikow, Jack $5.1M $1.7M 33.7% 215095
Sligo Creek Healthcare
NH

Nursing Home Licensed facility providing 24/7 skilled nursing care for residents with complex, ongoing medical needs. Staffed by RNs, LPNs, and CNAs. Inspected and star-rated annually by CMS. Accepts Medicare (short-term rehab) and Medicaid (long-term care).

Takoma Park (Carroll Manor) 102 89.4% +9% 3.53 -22% -7% 0 42 10.5 1 94 - 60 Woodside Park Md Holdco Llc $6.3M $2.2M 34.8% 215327
Kensington Healthcare Center
HC

Home Care Professional care delivered in the person's own home — from companionship and errands to skilled nursing and therapy. Allows seniors to age in place. Medicare covers skilled home health when medically necessary.

MC

Memory Care Secured, specialized care for people living with Alzheimer's or dementia. Staff trained in cognitive impairment, with higher staff-to-resident ratios and an environment designed to reduce confusion and wandering risk.

NH

Nursing Home Licensed facility providing 24/7 skilled nursing care for residents with complex, ongoing medical needs. Staffed by RNs, LPNs, and CNAs. Inspected and star-rated annually by CMS. Accepts Medicare (short-term rehab) and Medicaid (long-term care).

RC

Respite Care Short-term temporary care — days to weeks — to give family caregivers a break. Full care provided during the stay. Often used after hospitalization or to trial a facility before a permanent placement decision.

Kensington (Mccomas Avenue) 140 94.8% +15% 3.83 -30% +2% 1 42 10.5 2 136 - 32 Wo Holdings Llc $21.4M $6.5M 30.2% 215043
Montcare Wheaton
HC

Home Care Professional care delivered in the person's own home — from companionship and errands to skilled nursing and therapy. Allows seniors to age in place. Medicare covers skilled home health when medically necessary.

MC

Memory Care Secured, specialized care for people living with Alzheimer's or dementia. Staff trained in cognitive impairment, with higher staff-to-resident ratios and an environment designed to reduce confusion and wandering risk.

NH

Nursing Home Licensed facility providing 24/7 skilled nursing care for residents with complex, ongoing medical needs. Staffed by RNs, LPNs, and CNAs. Inspected and star-rated annually by CMS. Accepts Medicare (short-term rehab) and Medicaid (long-term care).

Wheaton 94 89.0% +8% 3.10 -4% -18% 0 58 19.3 0 89 - 63 Md3 Operator Holdco Llc $3.3M $1.3M 39% 215048
Bel Pre Healthcare Center -
HC

Home Care Professional care delivered in the person's own home — from companionship and errands to skilled nursing and therapy. Allows seniors to age in place. Medicare covers skilled home health when medically necessary.

MC

Memory Care Secured, specialized care for people living with Alzheimer's or dementia. Staff trained in cognitive impairment, with higher staff-to-resident ratios and an environment designed to reduce confusion and wandering risk.

NH

Nursing Home Licensed facility providing 24/7 skilled nursing care for residents with complex, ongoing medical needs. Staffed by RNs, LPNs, and CNAs. Inspected and star-rated annually by CMS. Accepts Medicare (short-term rehab) and Medicaid (long-term care).

RC

Respite Care Short-term temporary care — days to weeks — to give family caregivers a break. Full care provided during the stay. Often used after hospitalization or to trial a facility before a permanent placement decision.

Silver Spring (Bel Pre Road) - - - - - - - - - 0 0 0.0 0 - F 52 - - - - -

Financial Assistance for
Nursing Home in Maryland

Get Financial aid guidance

Community Options Waiver

Maryland Medicaid Community Options Waiver

Age 65+ or disabled
General Maryland resident, Medicaid- eligible, nursing home-level care need.
Income Limits (2025) ~$2,829/month 300% FBR, individual
Asset Limits $2,000 (individual), $3,000 (couple) (excludes home, car).
MD

High urban demand; rural outreach efforts.

Benefits
Personal care (5-7 hours/day, e.g., bathing, dressing) Respite care (up to 240 hours/year) Adult day care ($70/day) Home modifications ($1,500 avg.)

Senior Care Program

Maryland Senior Care

Age 65+
General Maryland resident, at risk of nursing home placement.
Income Limits ~$2,000/month individual, varies by county
Asset Limits $11,000 individual
MD

Limited funding; waitlists common in high-demand areas.

Benefits
In-home care (3-5 hours/week) Respite care (up to 10 days/year) Meals (~$6/meal) Transportation (~5 trips/month) Case management

Maryland Nursing Home Medicaid

Maryland Medical Assistance (Medicaid) Nursing Home Program

Age 65+
General Maryland resident, Medicaid-eligible, requires nursing home-level care.
Income Limits (2025) $943/month (individual); most income applied to care costs.
Asset Limits $2,500 (individual), $3,000 (couple); spousal protections up to $155,356.
MD

Home equity limit $636,000; estate recovery applies post-55.

Benefits
24/7 nursing care Meals Therapy Medications (unlimited per medical need)

Senior Assisted Living Subsidy Program

Maryland Senior Assisted Living Group Home Subsidy

Age 62+
General Maryland resident, in or moving to approved assisted living, low/moderate income.
Income Limits (2025) ~$34,000/year individual, varies by county
Asset Limits Not strict; prioritizes low-income.
MD

Not available statewide; facility must be licensed by MDH.

Benefits
Personal care Meals 24-hour supervision (up to $1,500/month subsidy typical)

Veterans Aid and Attendance (A&A) Benefit

Maryland VA Aid and Attendance

Age
General Wartime veteran/spouse, age 65+ or disabled, needs ADL help, Maryland resident.
Income Limits (2025) Net income minus medical expenses < $1,984/month individual with A&A
Asset Limits $155,356 net worth limit
MD

High veteran population in suburban/rural areas.

Benefits
Cash benefit ($1,478-$2,471/month, varies by status) for care costs

Senior Prescription Drug Assistance Program (SPDAP)

Maryland Senior Prescription Drug Assistance Program

Age 65+
General Maryland resident (6+ months), Medicare Part D enrolled.
Income Limits (2025) $48,560/year individual, 300% FPL
Asset Limits None specified.
MD

Supplements Medicare Part D; annual enrollment required.

Benefits
Up to $40/month premium subsidy Reducing drug costs

Medicare Savings Programs (MSP)

Maryland Medicare Savings Programs

Age 65+
General Maryland resident, Medicare Part A/B enrollee.
Income Limits (2025) $2,014/month (QMB), $2,706/month (SLMB/QI, individual).
Asset Limits $9,090 (individual), $13,630 (couple).
MD

Includes QMB, SLMB, QI categories.

Benefits
Covers premiums (up to $174.70/month Part B) Co-pays Deductibles

Community Personal Assistance Services (CPAS)

Maryland Medicaid Community Personal Assistance Services

Age 65+
General Maryland resident, Medicaid-eligible, needs ADL assistance.
Income Limits (2025) $943/month (individual); spend-down available.
Asset Limits $2,500 (individual), $3,000 (couple).
MD

Consumer-directed option allows hiring family caregivers.

Benefits
Personal care (hours vary, typically 20-30/week) Chores Nurse supervision

Places of interest near Kensington Healthcare Center

Address 1.3 miles from city center Info Estimated distance in miles from Kensington's city center to Kensington Healthcare Center's address, calculated via Google Maps.

Calculate Travel Distance to Kensington Healthcare Center

Add your location

Address

Staffing Data (Q2 2025)

This data corresponds to Q2 2025 and is based on CMS Payroll-Based Journal.

Total staff 207
Employees 150
Contractors 57
Staff to resident ratio 1.52:1
16% worse than Maryland average

Maryland average ratio: 1.81:1

Avg staff/day 68
Average shift 7.7 hours
0% compared with Maryland average

Maryland average: 8 hours

Total staff hours (quarter) 47,864
Nursing staff breakdown
Registered Nurse

Manages medical care and health needs.

Total count 19
Average shift length Info Average shift length. Calculated as total hours divided by days worked and average staff per day. 8.3 hours

This role is partially covered by contractors.

Licensed Practical Nurse

Assists with medical care and medications.

Total count 63
Average shift length Info Average shift length. Calculated as total hours divided by days worked and average staff per day. 8 hours

This role is partially covered by contractors.

Certified Nursing Assistant

Helps with daily care and mobility.

Total count 78
Average shift length Info Average shift length. Calculated as total hours divided by days worked and average staff per day. 7.6 hours

No contractors work on this role.

Contractor staffing

Total hours from contractors

11.1%

5,310 contractor hours this quarter

Licensed Practical Nurse: 32 Physical Therapy Aide: 5 Speech Language Pathologist: 5 Respiratory Therapy Technician: 4 Physical Therapy Assistant: 4 Qualified Social Worker: 3 Registered Nurse: 2 Medical Director: 1 Qualified Activities Professional: 1
Staff by category
Certified Nursing Assistant 78 0 78 23,957 91 100% 7.6
Licensed Practical Nurse 31 32 63 9,154 91 100% 8
Registered Nurse 17 2 19 4,620 91 100% 8.3
Physical Therapy Aide 0 5 5 1,562 74 81% 8
Clinical Nurse Specialist 8 0 8 1,489 65 71% 8.5
Speech Language Pathologist 0 5 5 1,199 71 78% 6.6
Other Dietary Services Staff 2 0 2 929 88 97% 7.6
RN Director of Nursing 2 0 2 820 67 74% 8.6
Physical Therapy Assistant 0 4 4 680 70 77% 5
Respiratory Therapy Technician 0 4 4 577 64 70% 7.7
Nurse Practitioner 3 0 3 520 60 66% 8
Mental Health Service Worker 1 0 1 512 64 70% 8
Administrator 1 0 1 488 61 67% 8
Dental Services Staff 1 0 1 466 57 63% 8.2
Occupational Therapy Aide 1 0 1 383 50 55% 7.7
Qualified Social Worker 0 3 3 225 44 48% 5
Medication Aide/Technician 1 0 1 121 16 18% 7.6
Medical Director 0 1 1 39 15 16% 2.6
Occupational Therapy Assistant 1 0 1 35 6 7% 5.8
Dietitian 1 0 1 30 4 4% 7.5
Nurse Aide in Training 2 0 2 30 2 2% 7.5
Qualified Activities Professional 0 1 1 28 13 14% 2.2
78 Certified Nursing Assistant
% of Days 100%
63 Licensed Practical Nurse
% of Days 100%
19 Registered Nurse
% of Days 100%
5 Physical Therapy Aide
% of Days 81%
8 Clinical Nurse Specialist
% of Days 71%
5 Speech Language Pathologist
% of Days 78%
2 Other Dietary Services Staff
% of Days 97%
2 RN Director of Nursing
% of Days 74%
4 Physical Therapy Assistant
% of Days 77%
4 Respiratory Therapy Technician
% of Days 70%
3 Nurse Practitioner
% of Days 66%
1 Mental Health Service Worker
% of Days 70%
1 Administrator
% of Days 67%
1 Dental Services Staff
% of Days 63%
1 Occupational Therapy Aide
% of Days 55%
3 Qualified Social Worker
% of Days 48%
1 Medication Aide/Technician
% of Days 18%
1 Medical Director
% of Days 16%
1 Occupational Therapy Assistant
% of Days 7%
1 Dietitian
% of Days 4%
2 Nurse Aide in Training
% of Days 2%
1 Qualified Activities Professional
% of Days 14%

Facility Characteristics

Source: CMS Long-Term Care Facility Characteristics (Data as of Jan 2026)

Total residents 136
Medicare
2
1.5% of residents
Medicaid
119
87.5% of residents
Private pay or other
15
11% of residents
Programs & Services
Residents Group

Residents meet regularly to discuss policies, care quality, and activities

Family Member Group

Family members meet regularly to discuss policies, care quality, and activities

Active Family Council

Organized group of family members that meets regularly to discuss facility policies, resident care, and activities.

Active Resident Council

Organized group of residents that meets regularly to discuss facility policies, quality of life, and activities.

Quality of care over time

These measures show how residents usually do over time at this home, based on health outcomes and preventive care.

High-risk clinical events score Info A composite score based on pressure ulcers, falls with injury, weight loss, walking ability decline, and activities of daily living decline. 6.1
53% better than Maryland average

Maryland average: 12.9

Functional decline score Info A composite score based on activities of daily living decline, walking ability decline, and incontinence. 13.1
49% better than Maryland average

Maryland average: 25.7

Long-stay resident measures
Above average Maryland avg: 3.7 Info CMS star rating based on long-stay quality measure performance. 5 stars = significantly above average, 1 star = significantly below average.
Need for Help with Daily Activities Increased Info Percent of long-stay residents whose need for help with daily activities has increased 10.2%
57% better than Maryland average

Maryland average: 23.7%

Walking Ability Worsened Info Percent of long-stay residents whose ability to move independently worsened 8.5%
69% better than Maryland average

Maryland average: 27.7%

Low Risk Residents with Bowel/Bladder Incontinence Info Percent of low risk long-stay residents who lose control of their bowels or bladder 20.6%
20% better than Maryland average

Maryland average: 25.9%

Falls with Major Injury Info Percent of long-stay residents experiencing one or more falls with major injury 0.2%
92% better than Maryland average

Maryland average: 2.3%

High Risk Residents with Pressure Ulcers Info Percent of long-stay high risk residents with pressure ulcers 8.6%
32% worse than Maryland average

Maryland average: 6.5%

Urinary Tract Infection Info Percent of long-stay residents with a urinary tract infection 0.0%
100% better than Maryland average

Maryland average: 1.6%

Lost Too Much Weight Info Percent of long-stay residents who lose too much weight 3.0%
49% better than Maryland average

Maryland average: 5.8%

Depressive Symptoms Info Percent of long-stay residents who have depressive symptoms 6.1%
70% better than Maryland average

Maryland average: 20.2%

Antipsychotic Use Info Percent of long-stay residents who received an antipsychotic medication 16.4%
27% worse than Maryland average

Maryland average: 12.9%

Pneumococcal Vaccine Info Percent of long-stay residents assessed and appropriately given the pneumococcal vaccine 82.2%
11% worse than Maryland average

Maryland average: 92.0%

Influenza Vaccine Info Percent of long-stay residents assessed and appropriately given the seasonal influenza vaccine 99.3%
In line with Maryland average

Maryland average: 96.6%

Hospitalizations per 1,000 days Info Number of hospitalizations per 1,000 long-stay resident days. 2.61
98% worse than Maryland average

Maryland average: 1.32

ED visits per 1,000 days Info Number of outpatient emergency department visits per 1,000 long-stay resident days. 2.30
90% worse than Maryland average

Maryland average: 1.21

Short-stay resident measures
Above average Maryland avg: 3.7 Info CMS star rating based on short-stay quality measure performance. 5 stars = much above average, 1 star = much below average.
Pneumococcal Vaccine Info Percent of short-stay residents assessed and appropriately given the pneumococcal vaccine 69.1%
12% worse than Maryland average

Maryland average: 78.4%

Antipsychotic medication increase Info Percent of short-stay residents who newly received an antipsychotic medication 0.0%
100% better than Maryland average

Maryland average: 1.4%

Influenza Vaccine Info Percent of short-stay residents assessed and appropriately given the seasonal influenza vaccine 70.8%
12% worse than Maryland average

Maryland average: 80.6%

Re-hospitalized after SNF stay Info Percentage of short-stay residents who were re-hospitalized after their nursing home admission. 26.6%
25% worse than Maryland average

Maryland average: 21.2%

Emergency department visits Info Percentage of short-stay residents who had an outpatient emergency department visit. 2.9%
71% better than Maryland average

Maryland average: 9.9%

Falls with major injury Info Percentage of SNF residents who experience falls with major injury during their stay. 0.0%
100% better than Maryland average

Maryland average: 0.8%

Penalties and fines

Federal penalties imposed by CMS for regulatory violations, including civil money penalties (fines) and denials of payment for new Medicare/Medicaid admissions.

Source: CMS Penalties Database (Data as of Jan 2026)

Total fines amount $52K
16% lower than Maryland average

Maryland average: $61K

Number of fines 1 Rank #1 / 43Federal fines — state benchmarkedThis home is ranked 1st out of 43 homes in Maryland.Shows this facility's CMS fine count alongside the Maryland average, and where it ranks among all 43 skilled nursing facilities in the state. Fewer fines mean a better rank.
33% fewer fines than Maryland average

Maryland average: 1.5

Payment Denials Info Serious action where Medicare and/or Medicaid temporarily stops payments for new residents until issues are fixed. 0
100% fewer payment denials than Maryland average

Maryland average: 0.1

Fines amount comparison
This facility $52K
Maryland average $61K
Penalty History

Penalties are imposed by CMS for violations of federal nursing home regulations.

Civil Money Penalty Info Fines imposed for noncompliance, which can be assessed per day or per instance of violation. Oct 2, 2024
$52K

Last updated: Jan 2026

Guides for Better Senior Living

Care Cost Calculator: See Prices in Your Area

Nursing Home Data Explorer

Don’t Wait Too Long: 7 Red Flag Signs Your Parent Needs Assisted Living Now

The True Cost of Assisted Living in 2025 – And How Families Are Paying For It

Understanding Senior Living Costs: Pricing Models, Discounts & Financial Assistance

Tour Icon
Planning a tour? Check our touring checklist.
Chat Icon
Thinking of living here? We can help you speak to a current resident
Explore Open Rooms
1 Contact details
2 What type of senior care service are you looking for?
3 What budget do you have in mind for senior care?
4 How soon do you need to find care?
5 Additional details

Thank you for your interest!

Our team will be in touch shortly to help with next steps.