


Total staff
111
Employees
110
Contractors
1
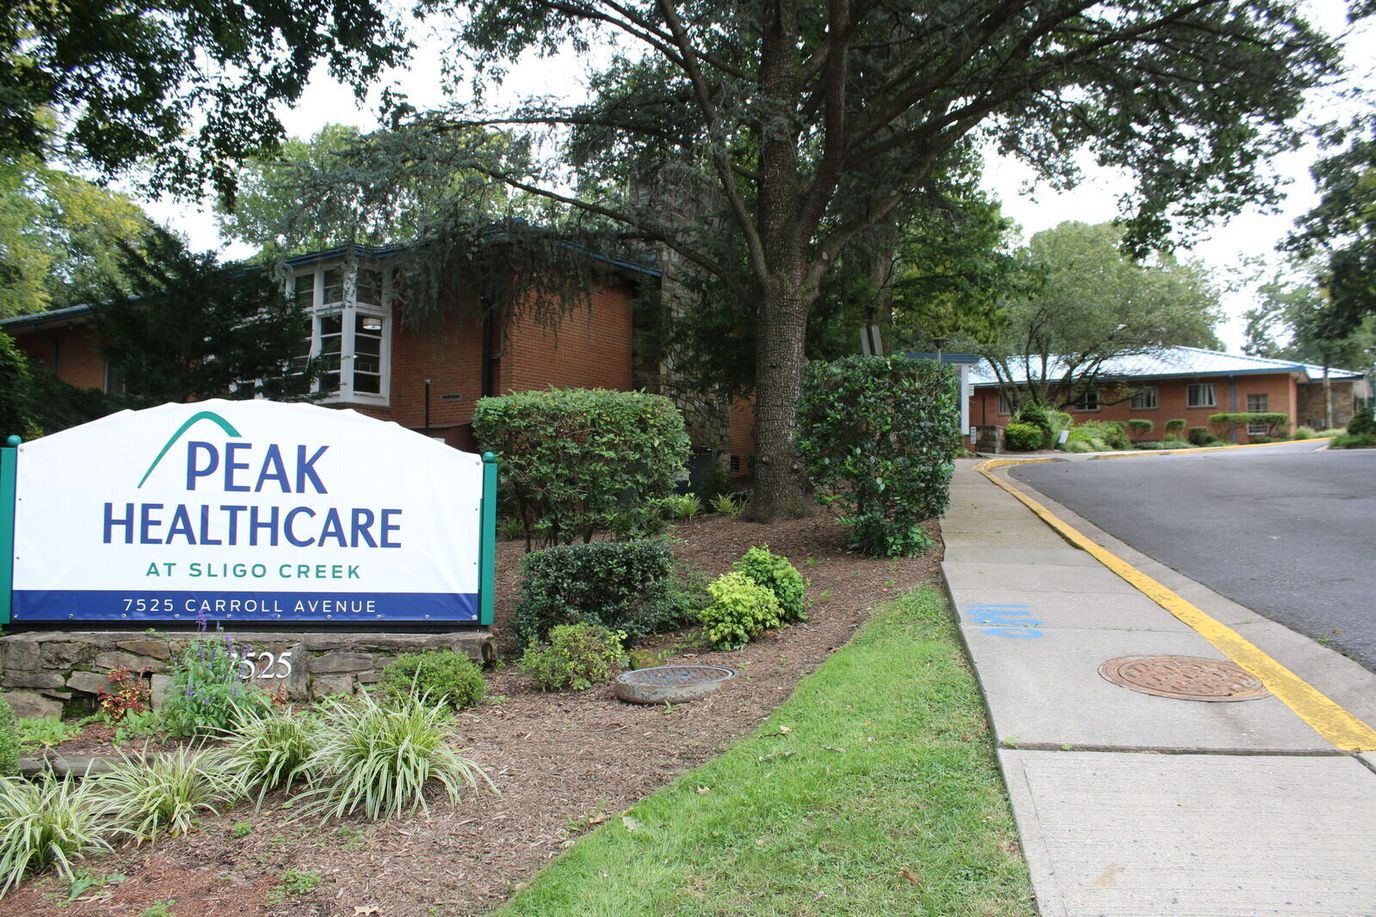


Nestled between the serene parks of Sligo Creek North Neighborhood Park and Takoma-Piney Branch Park in Takoma Park, MD, Sligo Creek Healthcare is a dependable community that offers skilled nursing. With comprehensive care from a compassionate and highly trained team attending to their needs 24/7, residents can rest assured of living comfortably in their golden years. Promoting a bright and friendly environment, the community guarantees comfort and safety while retaining residents’ independence.
A full calendar of engaging activities and stimulating programs is also conducted for residents to remain happy and actively engaged. Mealtimes are also something to look forward to, with diverse dining options satisfying nutritional needs and preferences. The community’s comprehensive care and specially designed amenities make it an enticing option for those looking for different levels of care.
| Staff type | Hours / Day / Resident | vs state avg |
|---|---|---|
|
Registered Nurse (RN)
| 37m per day | ▼ 27% State avg: 50m per day · National avg: 41m per day |
|
LPN / LVN
| 46m per day | ▼ 15% State avg: 54m per day · National avg: 52m per day |
|
Nurse Aide
| 1h 59m per day | ▼ 9% State avg: 2h 10m per day · National avg: 2h 21m per day |
|
Weekend Total Nursing
| 3h 8m per day | ▼ 10% State avg: 3h 29m per day · National avg: 3h 26m per day |
|
Physical Therapist
| 7m per day | ▲ 35% State avg: 5m per day · National avg: 4m per day |
|
Weekend RN
| 30m per day | ▼ 20% State avg: 37m per day · National avg: 29m per day |
Reporting period: October 1 – December 31, 2025 (Q4 2025). Source: CMS Payroll-Based Journal report.
Manages medical care and health needs.
Assists with medical care and medications.
Helps with daily care and mobility.
Total hours from contractors
536 contractor hours this quarter
| Certified Nursing Assistant | 46 | 0 | 46 | 16,634 | 92 | 100% | 7.2 |
| Licensed Practical Nurse | 18 | 0 | 18 | 6,510 | 92 | 100% | 7.9 |
| Registered Nurse | 14 | 1 | 15 | 3,846 | 92 | 100% | 7.4 |
| Clinical Nurse Specialist | 3 | 0 | 3 | 1,012 | 74 | 80% | 6.2 |
| Physical Therapy Assistant | 3 | 0 | 3 | 994 | 73 | 79% | 7.4 |
| Respiratory Therapy Technician | 6 | 0 | 6 | 983 | 78 | 85% | 6.3 |
| Other Dietary Services Staff | 2 | 0 | 2 | 882 | 87 | 95% | 7 |
| Physical Therapy Aide | 2 | 0 | 2 | 759 | 63 | 68% | 9.9 |
| Medication Aide/Technician | 2 | 0 | 2 | 680 | 90 | 98% | 7.6 |
| Administrator | 3 | 0 | 3 | 570 | 66 | 72% | 7.5 |
| Qualified Social Worker | 1 | 0 | 1 | 524 | 66 | 72% | 7.9 |
| Nurse Practitioner | 1 | 0 | 1 | 488 | 65 | 71% | 7.5 |
| Mental Health Service Worker | 2 | 0 | 2 | 478 | 66 | 72% | 6.4 |
| Therapeutic Recreation Specialist | 1 | 0 | 1 | 468 | 62 | 67% | 7.5 |
| Dietitian | 1 | 0 | 1 | 402 | 58 | 63% | 6.9 |
| Dental Services Staff | 2 | 0 | 2 | 273 | 67 | 73% | 3.7 |
| RN Director of Nursing | 1 | 0 | 1 | 164 | 22 | 24% | 7.5 |
| Medical Director | 1 | 0 | 1 | 65 | 13 | 14% | 5 |
| Occupational Therapy Aide | 1 | 0 | 1 | 32 | 4 | 4% | 8 |
Includes penalties issued in 2025
Federal penalties imposed by CMS for regulatory violations, including civil money penalties (fines) and denials of payment for new Medicare/Medicaid admissions.
Source: CMS Penalties Database (Data as of Jan 2026)
Maryland average: $61K
Maryland average: 1.5
Maryland average: 0.1
Penalties are imposed by CMS for violations of federal nursing home regulations.
1 penalty in the past 3 years
Feb 20, 2025 · 17 days
Last updated: Jan 2026
These measures show how residents usually do over time at this home, based on health outcomes and preventive care.
Maryland average: 12.9
Maryland average: 25.7
Maryland average: 23.7%
Maryland average: 27.7%
Maryland average: 25.9%
Maryland average: 2.3%
Maryland average: 6.5%
Maryland average: 1.6%
Maryland average: 5.8%
Maryland average: 20.2%
Maryland average: 12.9%
Maryland average: 92.0%
Maryland average: 96.6%
Maryland average: 1.32
Maryland average: 1.21
Maryland average: 78.4%
Maryland average: 1.4%
Maryland average: 80.6%
Maryland average: 21.2%
Maryland average: 9.9%
Maryland average: 0.8%
Maryland average: 53.7%
Maryland average: 50.6%
Quality measures are calculated from Minimum Data Set (MDS) assessments. For most measures, lower percentages indicate better care quality.
42% of new residents, usually for short-term rehab.
39% of new residents, often for short stays.
19% of new residents, often for long-term daily care.
Source: CMS Long-Term Care Facility Characteristics (Data as of Jan 2026)
Residents meet regularly to discuss policies, care quality, and activities
Organized group of residents that meets regularly to discuss facility policies, quality of life, and activities.
Data sourced from CMS Long-Term Care Facility Characteristics quarterly report. Payer mix reflects the current resident census by primary payment source.
Historical financial and operational data for Sligo Creek Healthcare from 2012–2022, based on CMS SNF Cost Reports.
Key figures below are for fiscal year ending in 12/2022 — the home's most recent complete cost report, an older period than most facilities report.
Based on the home's most recent complete CMS SNF Cost Report — fiscal year ending in 12/2022. This is an older period than most facilities report, so compare with that in mind.
No pets allowed
Housing Options: 1 Bed / 2 Bed
Building Type: Single-story
Beauty Services
Transportation Services
Housekeeping Services
Recreational Activities
Exercise Programs
Most residents typically stay for a few weeks or months before returning home or moving on.
New residents most often arrive under Medicare (42% of admissions), and a typical Medicare stay runs around 1 - 2 months.
Coverage residents most often arrive under.
Coverage residents most often leave under.
![]() 0.5 miles from city center
0.5 miles from city center
![]() Estimated distance in miles from Takoma Park's city center to Sligo Creek Healthcare's address, calculated via Google Maps.
Estimated distance in miles from Takoma Park's city center to Sligo Creek Healthcare's address, calculated via Google Maps.
Add your location
The information below is reported by the Maryland Department of Health, Office of Health Care Quality.
| Montcare Bethesda | NH HOS MC PC SNF | Bethesda (Georgetown Village) | 120
Facility
120
MD AVG
43
Rank
#76 / 690 |
85.3%
Facility
85.3%
MD AVG
80.8
Rank
#63 / 104 | +6% | 3.04
Facility
3.04
MD AVG
3.77
Rank
#127 / 143 | -9% | -19% | $0
Facility
$0
MD AVG
$65.0k
Rank
#1 / 145 | 34
Facility
34
MD AVG
49.9
Rank
#50 / 145 | 8.5
Facility
8.5
MD AVG
12.8
Rank
#45 / 145 | - | 102 | - |
70
Facility
70
MD AVG
43
Rank
#184 / 985 | Jack Ribikow | $10.5M*Fiscal year ending 12/2022These figures are from this home's most recent complete cost report — an older period than most facilities report. Compare with that in mind.
Facility
$10.5M*Fiscal year ending 12/2022These figures are from this home's most recent complete cost report — an older period than most facilities report. Compare with that in mind.
MD AVG
$18.7M
Rank
#121 / 144 | $5.0M*Fiscal year ending 12/2022These figures are from this home's most recent complete cost report — an older period than most facilities report. Compare with that in mind.
Facility
$5.0M*Fiscal year ending 12/2022These figures are from this home's most recent complete cost report — an older period than most facilities report. Compare with that in mind.
MD AVG
$6.5M
Rank
#127 / 144 | 47%*Fiscal year ending 12/2022These figures are from this home's most recent complete cost report — an older period than most facilities report. Compare with that in mind.
Facility
47%*Fiscal year ending 12/2022These figures are from this home's most recent complete cost report — an older period than most facilities report. Compare with that in mind.
MD AVG
38.5%
Rank
#83 / 144 | 215095 | ||||
| Asbury Methodist Village | NH AL IL MC SNF | Gaithersburg (Russell Avenue) | 164
Facility
164
MD AVG
43
Rank
#26 / 690 | - | - | 3.92
Facility
3.92
MD AVG
3.77
Rank
#41 / 143 | +40% | +4% | $0
Facility
$0
MD AVG
$65.0k
Rank
#1 / 145 | 29
Facility
29
MD AVG
49.9
Rank
#28 / 145 | 7.3
Facility
7.3
MD AVG
12.8
Rank
#25 / 145 | - | 163 | - |
41
Facility
41
MD AVG
43
Rank
#508 / 985 | Asbury Communities Inc | $28.6MFiscal year ending 12/2023
Facility
$28.6MFiscal year ending 12/2023
MD AVG
$18.7M
Rank
#11 / 144 | $18.6MFiscal year ending 12/2023
Facility
$18.6MFiscal year ending 12/2023
MD AVG
$6.5M
Rank
#11 / 144 | 64.8%Fiscal year ending 12/2023
Facility
64.8%Fiscal year ending 12/2023
MD AVG
38.5%
Rank
#90 / 144 | 215099 | ||||
| Montcare Wheaton | NH HOS MC PC SNF | Wheaton | 94
Facility
94
MD AVG
43
Rank
#144 / 690 |
94.6%
Facility
94.6%
MD AVG
80.8
Rank
#16 / 104 | +17% | 3.10
Facility
3.10
MD AVG
3.77
Rank
#119 / 143 | -19% | -18% | $0
Facility
$0
MD AVG
$65.0k
Rank
#1 / 145 | 58
Facility
58
MD AVG
49.9
Rank
#103 / 145 | 19.3
Facility
19.3
MD AVG
12.8
Rank
#126 / 145 | - | 89 | - |
63
Facility
63
MD AVG
43
Rank
#273 / 985 | Md3 Operator Holdco LLC | $10.3M*Fiscal year ending 08/2022These figures are from this home's most recent complete cost report — an older period than most facilities report. Compare with that in mind.
Facility
$10.3M*Fiscal year ending 08/2022These figures are from this home's most recent complete cost report — an older period than most facilities report. Compare with that in mind.
MD AVG
$18.7M
Rank
#114 / 144 | $6.3M*Fiscal year ending 08/2022These figures are from this home's most recent complete cost report — an older period than most facilities report. Compare with that in mind.
Facility
$6.3M*Fiscal year ending 08/2022These figures are from this home's most recent complete cost report — an older period than most facilities report. Compare with that in mind.
MD AVG
$6.5M
Rank
#115 / 144 | 60.9%*Fiscal year ending 08/2022These figures are from this home's most recent complete cost report — an older period than most facilities report. Compare with that in mind.
Facility
60.9%*Fiscal year ending 08/2022These figures are from this home's most recent complete cost report — an older period than most facilities report. Compare with that in mind.
MD AVG
38.5%
Rank
#62 / 144 | 215048 | ||||
| Sligo Creek Healthcare | NH SNF | Takoma Park (Carroll Manor) | 102
Facility
102
MD AVG
43
Rank
#109 / 690 |
93.1%
Facility
93.1%
MD AVG
80.8
Rank
#22 / 104 | +15% | 3.53
Facility
3.53
MD AVG
3.77
Rank
#69 / 143 | -2% | -7% | $12.7k
Facility
$12.7k
MD AVG
$65.0k
Rank
#99 / 145 | 42
Facility
42
MD AVG
49.9
Rank
#73 / 145 | 10.5
Facility
10.5
MD AVG
12.8
Rank
#61 / 145 | 1 | 95 | - |
60
Facility
60
MD AVG
43
Rank
#316 / 985 | Woodside Park MD Holdco LLC | $12.9M*Fiscal year ending 12/2022These figures are from this home's most recent complete cost report — an older period than most facilities report. Compare with that in mind.
Facility
$12.9M*Fiscal year ending 12/2022These figures are from this home's most recent complete cost report — an older period than most facilities report. Compare with that in mind.
MD AVG
$18.7M
Rank
#113 / 144 | $5.2M*Fiscal year ending 12/2022These figures are from this home's most recent complete cost report — an older period than most facilities report. Compare with that in mind.
Facility
$5.2M*Fiscal year ending 12/2022These figures are from this home's most recent complete cost report — an older period than most facilities report. Compare with that in mind.
MD AVG
$6.5M
Rank
#108 / 144 | 40%*Fiscal year ending 12/2022These figures are from this home's most recent complete cost report — an older period than most facilities report. Compare with that in mind.
Facility
40%*Fiscal year ending 12/2022These figures are from this home's most recent complete cost report — an older period than most facilities report. Compare with that in mind.
MD AVG
38.5%
Rank
#53 / 144 | 215327 | ||||
| Kensington Healthcare Center | NH SNF | Kensington (Mccomas Avenue) | 140
Facility
140
MD AVG
43
Rank
#50 / 690 |
90.6%
Facility
90.6%
MD AVG
80.8
Rank
#40 / 104 | +12% | 3.83
Facility
3.83
MD AVG
3.77
Rank
#47 / 143 | -6% | +2% | $96.0k
Facility
$96.0k
MD AVG
$65.0k
Rank
#140 / 145 | 42
Facility
42
MD AVG
49.9
Rank
#73 / 145 | 10.5
Facility
10.5
MD AVG
12.8
Rank
#61 / 145 | 2 | 127 | - |
32
Facility
32
MD AVG
43
Rank
#609 / 985 | Wo Holdings LLC | $17.4MFiscal year ending 12/2023
Facility
$17.4MFiscal year ending 12/2023
MD AVG
$18.7M
Rank
#60 / 144 | $7.3MFiscal year ending 12/2023
Facility
$7.3MFiscal year ending 12/2023
MD AVG
$6.5M
Rank
#70 / 144 | 41.8%Fiscal year ending 12/2023
Facility
41.8%Fiscal year ending 12/2023
MD AVG
38.5%
Rank
#108 / 144 | 215043 |
Sligo Creek Healthcare is located in Takoma Park, Maryland.
Here are the financial assistance programs available to residents in Maryland.
Sligo Creek Healthcare is in the Carroll Manor neighborhood.
Sligo Creek Healthcare has a walk score of 60. Moderately walkable. Some errands can be accomplished on foot, with a mix of nearby amenities.
Sligo Creek Healthcare's occupancy is 89.4%.
Sligo Creek Healthcare is registered as a for-profit.
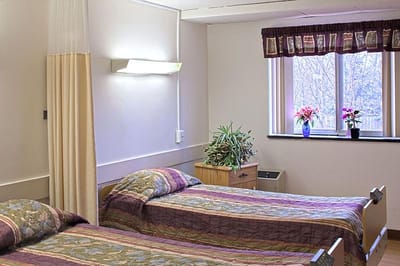
Yes — there are 5 photos of Sligo Creek Healthcare in the photo gallery on this page.
Sligo Creek Healthcare is located at 7525 Carroll Ave, Takoma Park, MD 20912.
(301) 270-4200 will put you in contact with the team at Sligo Creek Healthcare.
Care Cost Calculator: See Prices in Your Area
Nursing Home Data Explorer
Don’t Wait Too Long: 7 Red Flag Signs Your Parent Needs Assisted Living Now
The True Cost of Assisted Living in 2025 – And How Families Are Paying For It
Understanding Senior Living Costs: Pricing Models, Discounts & Financial Assistance


