SMITH CROSSING (Assisted Living)
CMS overall rating Info CMS (the Centers for Medicare & Medicaid Services) is the federal agency that rates nursing home quality. Its Overall Rating runs from 1 to 5 stars, combining health inspections, staffing, and quality measures, with inspections weighted most heavily.

SMITH CROSSING (Assisted Living)

CMS overall rating Info CMS (the Centers for Medicare & Medicaid Services) is the federal agency that rates nursing home quality. Its Overall Rating runs from 1 to 5 stars, combining health inspections, staffing, and quality measures, with inspections weighted most heavily.
Calculator: See prices in your area
SMITH CROSSING (Assisted Living) accepts Medicare and private pay.

Overview of Smith Crossing (assisted Living)

Smith Crossing is a senior living community located in Orland Park, Illinois. It offers a full continuum of health care services including assisted living, memory care, skilled nursing, and rehabilitation. The community is set on 32 scenic acres and is committed to enriching the lives of older adults.

Quality ratings

Measured by Centers for Medicare & Medicaid Services (CMS)

Overall rating Info The Overall CMS Rating combines results from health inspections, staffing levels and quality measures. Health inspections carry the most weight. Staffing and quality scores can increase or decrease the final rating based on performance compared to state and national standards.
▲ 27.0% Above IL avg. ▲ 27.0% Above IL avg.Click the badge to see the full State ranking.Click here to see the full State ranking.
Health Inspection Info Based on the results of the facility's three most recent standard inspections and any complaint investigations. CMS reviews the number, scope, and severity of deficiencies, with more recent findings weighted more heavily.
At IL avg. At IL avg.Click the badge to see the full State ranking.Click here to see the full State ranking.
Staffing Info Measures average nursing staff hours per resident per day, including Registered Nurses (RNs) and total nursing staff. Ratings are adjusted based on the level of care residents require and are compared to state and national benchmarks.
▲ 50.2% Above IL avg. ▲ 50.2% Above IL avg.Click the badge to see the full State ranking.Click here to see the full State ranking.
Quality Measures Info Based on clinical and physical health indicators reported to CMS, such as hospital readmissions, falls, pressure ulcers, and improvements in mobility. These measures reflect how well residents' health needs are being managed.
▼ 37.3% Below IL avg. ▼ 37.3% Below IL avg.Click the badge to see the full State ranking.Click here to see the full State ranking.

Staffing hours breakdown

Info Daily nursing hours per resident by staff type, reported to CMS. Higher is generally better — compare this facility to state and national averages to see where staffing stands.

Hours per resident per day — compared to Illinois state averages

Total nursing care / resident Info This home is ranked 15th out of 167 homes in Illinois for nurse hours. Total adjusted nursing hours per resident per day, combining RN, LPN, and aide time. CMS adjusts this for case-mix so facilities can be fairly compared.
5h 11m per day
Rank #15 / 167Nurse hours — State benchmarkedThis home is ranked 15th out of 167 homes in Illinois for nurse hours. Shows adjusted nurse hours per resident per day benchmarked to the Illinois average, with a ranking across 167 Illinois SNFs. More hours mean more direct care. The national average is about 3.5 hrs; below 3.0 is a red flag.Click the rank badge to see the full State ranking.Click here to see the full State ranking.
This facility Illinois avg (3h 57m per day)
vs Illinois avg
+31%

0 of 1 metrics below state avg

Standout metric Weekend Total Nursing is +60% above state avg
Staff typeHours / Day / Residentvs state avg
Weekend Total Nursing Info Combined nursing hours (RN + LPN + Nurse Aide) per resident per day on weekends. Staffing often drops on weekends — this figure reveals whether the facility maintains adequate coverage outside of weekday hours. 4h 57m per day ▲ 60% State avg: 3h 5m per day · National avg: 3h 25m per day

Capacity and availability

This home usually has limited availability

Higher occupancy than the Illinois average: 69.3%
Occupancy rate
85.6% Rank #54 / 199Occupancy rate — State benchmarkedThis home is ranked 54th out of 199 homes in Illinois for occupancy rate. Shows this facility's occupancy rate versus the Illinois average, with its Statewide rank out of 199. Higher occupancy signals strong local demand and financial stability.Click the rank badge to see the full State ranking.Click here to see the full State ranking.
Avg. Length of Stay
56 days
Bed community size
62-bed community Rank #246 / 426Bed count — State benchmarkedThis home is ranked 246th out of 426 homes in Illinois for bed count. Shows this facility's certified or reported bed count compared to other Illinois SNFs. Larger communities may offer more amenities, programs, and on-site services for residents and families.Click the rank badge to see the full State ranking.Click here to see the full State ranking.
A moderately sized community that may balance personal attention with shared amenities and social activities.
Years in operation
17 years in operation Rank #84 / 261Years in operation — State benchmarkedThis home is ranked 84th out of 261 homes in Illinois for years in operation. Shows how long this facility has been in operation compared to other Illinois SNFs. Longer operating histories may benefit residents, families, and staff.Click the rank badge to see the full State ranking.Click here to see the full State ranking.
A community with a solid operating history and experience delivering ongoing care.
Walk Score
Walk Score: 1 / 100 Rank #634 / 648Walk Score — State benchmarkedThis home is ranked 634th out of 648 homes in Illinois for walk score. Shows how walkable this facility's neighborhood is compared to the average Walk Score across Illinois SNFs. Higher scores benefit residents, families, and staff.Click the rank badge to see the full State ranking.Click here to see the full State ranking.
Car-dependent. Most errands require a car, with limited nearby walkable options.
BBB Rating
BBB Rating: A+ (Not Accredited)
An independent rating from the Better Business Bureau based on factors such as complaint history, transparency, and business practices.
How BBB ratings work

About this community

Awards

AwardsBest of Southland in both Retirement Community & Assisted Living categories

License Details

Facility TypeAssisted Living/shared Housing Establishment
StatusActive
IssuanceMay 27, 2026
ExpirationMay 26, 2027
CountyWill
License Number5101677

Ownership & Operating Entity

Owner NameWashington And Jane Smith Community-Orland Park

Staffing

Key information about the people who lead and staff this community.

Leadership

ContactMrs. Amanda Mauceri, Administrator

Therapy & Rehabilitation

3 services
Rehabilitation Services
Respite Care
Short-Term Rehab

Staffing & Medical

1 service
24-Hour Staffing

Contact Information

Additional Policies & Features

Minimum Age62

Amenities & Lifestyle

Specific ProgramsServices and Amenities, Dining Options, Video Gallery, Greenleaf Rehab, Financial Guide, For Residents, For Families, Emilie's Fund, News

Contact SMITH CROSSING (Assisted Living)

Inspection History

In Illinois, the Department of Public Health, Office of Health Care Regulation conducts annual unannounced surveys to assess compliance with state and federal healthcare facility standards.

Since 2025 · 1 year of data 6 inspections

Inspection Scorecard Info This scorecard compares key inspection, citation, and complaint metrics at this facility against the Illinois state average. Metrics rated ≥15% worse than average are highlighted in red; those ≥15% better are highlighted in green.

Since 2025 vs. Illinois state average
Overall vs. IL average 0 Worse No metrics in this bucket. 1 Better Metrics better than Illinois average:
• Total inspections (25% below)
Latest Inspection December 15, 2025

Inspections Info State inspections evaluate whether the facility meets health and safety standards.

This FacilityIL Averagevs. IL Avg
Total inspections Info Combined count of all routine and focused inspections. Excludes complaint investigations. 68 This facility has 25% fewer total inspections than a typical Illinois nursing home (6 vs. IL avg 8).↓ 25% better

Inspection Reports Summary Info An editor-reviewed summary of the themes and findings across this facility's recent inspection reports.

  • December 15, 2025 annual licensure survey found the facility fully compliant with all assisted living regulations and no deficiencies.
  • No complaints were reported or investigated at the time of the December 15, 2025 inspection.
  • The facility maintained compliance with Part 295 and 210 ILCS 9/1 Assisted Living and Shared Housing Act requirements on the most recent survey.

Health Inspection History

Inspections since 2023
Total health inspections 6

Illinois average 10.4


Last Health inspection on Jun 2025
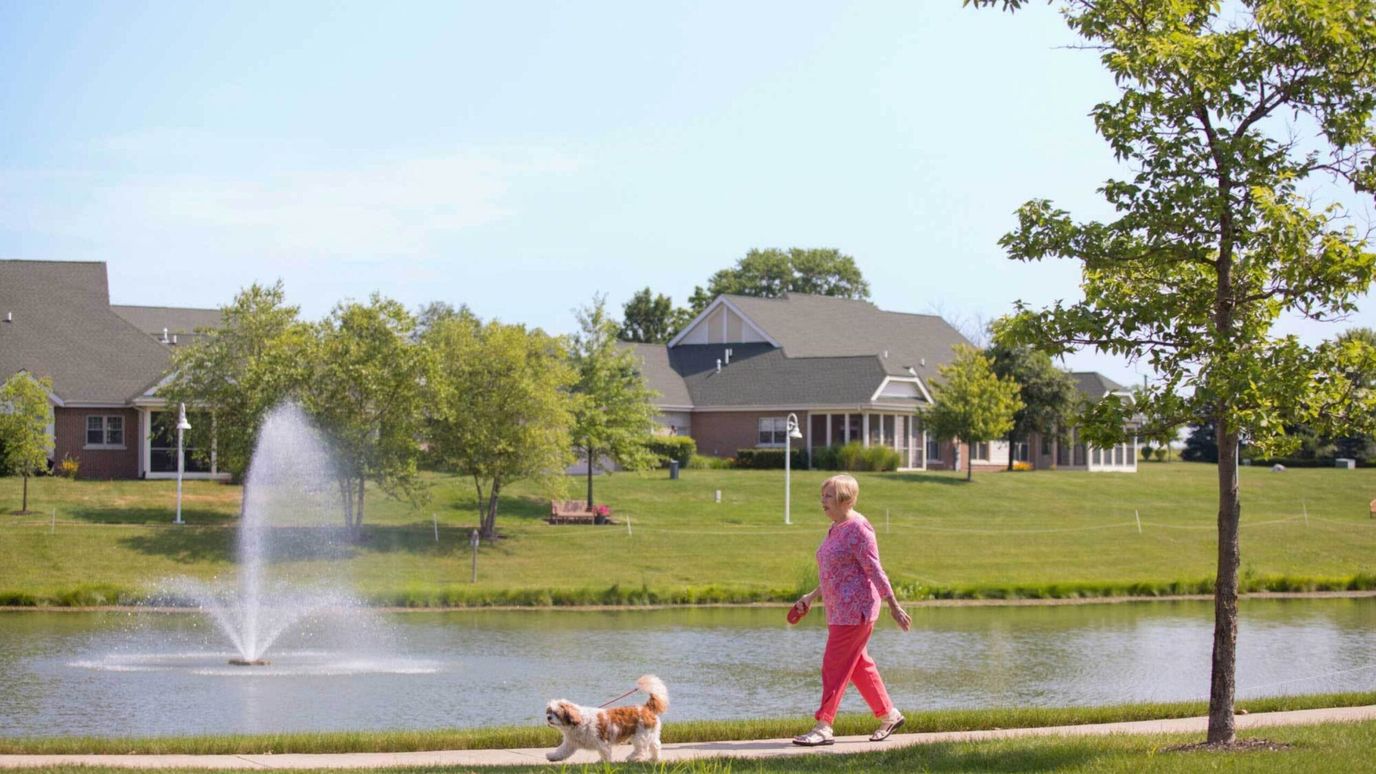
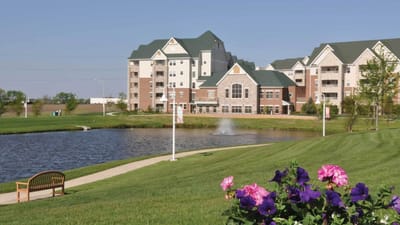
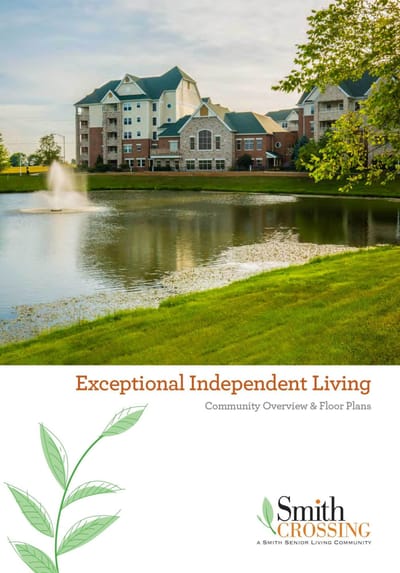
Total health citations
31 Rank #88 / 167Health citations — State benchmarkedThis home is ranked 88th out of 167 homes in Illinois for health citations. Shows this facility's total health deficiency citations benchmarked to the Illinois State average, with a ranking across all 167 IL SNFs. Lower citation counts earn a better rank.Click the rank badge to see the full State ranking.Click here to see the full State ranking.

Illinois average 36.8

Citations per inspection
5.17 Rank #146 / 167Citations per inspection — State benchmarkedThis home is ranked 146th out of 167 homes in Illinois for citations per inspection. Shows average deficiency citations per CMS inspection for this facility versus the Illinois mean across 167 SNFs with citation data. Lower is better.Click the rank badge to see the full State ranking.Click here to see the full State ranking.

Illinois average 3.68


Health citations are formal notices following inspections when they fail to comply with safety and care standards.

26 of 31 citations resulted from standard inspections; and 5 of 31 resulted from complaint investigations.

Breakdown of citation severity (last 3 years)
Critical health citations
0
100% better than Illinois average

Illinois average: 0.7


Serious health citations
4
11% worse than Illinois average

Illinois average: 3.6

0 critical citations Illinois average: 0.7

4 serious citations Illinois average: 3.6

27 moderate citations Illinois average: 32

0 minor citations Illinois average: 0.5
Citations history (last 3 years)
Infection Control moderate citation Jun 18, 2025
Corrected

Pharmacy moderate citation Jun 18, 2025
Corrected

Quality of Care moderate citation Jun 18, 2025
Corrected

Quality of Care serious citation Jun 18, 2025
Corrected

Staffing Data

Reporting period: October 1 – December 31, 2025 (Q4 2025). Source: CMS Payroll-Based Journal report.

Total staff 338
Employees 132
Contractors 206
Staff to resident ratio 4.28 : 1
138% more staff per resident than Illinois average
Illinois average ratio: 1.80 : 1 Illinois average ratio: 1.80 : 1See full Illinois ranking
Avg staff/day 76
Average shift 7.1 hours
7% worse than Illinois average
Illinois average: 7.6 hours Illinois average shift: 7.6 hoursSee full Illinois ranking
Total staff hours (quarter) 49,480

Nursing staff breakdown

Q4 2025 · Oct 1 – Dec 31 More info This data comes from the CMS Payroll-Based Journal report covering October 1 – December 31, 2025.
Registered Nurse

Manages medical care and health needs.

RN Staff Info 24 total: 23 full-time employees and 1 contractor. 24
Average shift length Info Average shift length. Calculated as total hours divided by days worked and average staff per day. 7.5 hours
Licensed Practical Nurse

Assists with medical care and medications.

LPN Staff Info 73 total: 14 full-time employees and 59 contractors. 73
Average shift length Info Average shift length. Calculated as total hours divided by days worked and average staff per day. 7.1 hours
Certified Nursing Assistant

Helps with daily care and mobility.

CNA Staff Info 184 total: 66 full-time employees and 118 contractors. 184
Average shift length Info Average shift length. Calculated as total hours divided by days worked and average staff per day. 7.2 hours

Contractor staffing

Q4 2025 · Oct 1 – Dec 31 More info This data comes from the CMS Payroll-Based Journal report covering October 1 – December 31, 2025.

Total hours from contractors

20.7%

10,260 contractor hours this quarter

Certified Nursing Assistant: 118 Licensed Practical Nurse: 59 Speech Language Pathologist: 7 Physical Therapy Aide: 6 Physical Therapy Assistant: 6 Respiratory Therapy Technician: 5 Qualified Social Worker: 2 Registered Nurse: 1 Medical Director: 1 Occupational Therapy Aide: 1

Staff by category

Q4 2025 · Oct 1 – Dec 31 More info This data comes from the CMS Payroll-Based Journal report covering October 1 – December 31, 2025.
Certified Nursing Assistant6611818422,45092100%7.2
Registered Nurse231246,61592100%7.5
Licensed Practical Nurse1459735,70192100%7.1
Other Dietary Services Staff130134,39392100%7.3
Clinical Nurse Specialist9092,8908289%7.6
Physical Therapy Aide0661,2307784%6.7
Speech Language Pathologist0779807986%5.8
Dental Services Staff2029586975%7.8
Nurse Practitioner2028636368%7.5
Qualified Social Worker0225685560%6.1
Physical Therapy Assistant0665617480%6.5
Respiratory Therapy Technician0555237885%5.7
Occupational Therapy Aide0114806470%7.5
Mental Health Service Worker1014435964%7.5
Physical Therapist1014235863%7.3
Administrator1013424751%7.3
Medical Director011616166%1
184 Certified Nursing Assistant
% of Days 100%
24 Registered Nurse
% of Days 100%
73 Licensed Practical Nurse
% of Days 100%
13 Other Dietary Services Staff
% of Days 100%
9 Clinical Nurse Specialist
% of Days 89%
6 Physical Therapy Aide
% of Days 84%
7 Speech Language Pathologist
% of Days 86%
2 Dental Services Staff
% of Days 75%
2 Nurse Practitioner
% of Days 68%
2 Qualified Social Worker
% of Days 60%
6 Physical Therapy Assistant
% of Days 80%
5 Respiratory Therapy Technician
% of Days 85%
1 Occupational Therapy Aide
% of Days 70%
1 Mental Health Service Worker
% of Days 64%
1 Physical Therapist
% of Days 63%
1 Administrator
% of Days 51%
1 Medical Director
% of Days 66%

Penalties and fines

Includes penalties issued in 2023-2025

Federal penalties imposed by CMS for regulatory violations, including civil money penalties (fines) and denials of payment for new Medicare/Medicaid admissions.

Source: CMS Penalties Database (Data as of Jan 2026)

Total fines amount $95K Rank #123 / 168Federal fines — State benchmarkedThis home is ranked 123rd out of 168 homes in Illinois for federal fines. Shows this facility's cumulative CMS federal fine dollars versus the Illinois average among facilities with fines, and where it ranks among 168 skilled nursing facilities in the pool. Lower total dollars mean a better rank.Click the rank badge to see the full State ranking.Click here to see the full State ranking.
33% lower than Illinois average

Illinois average: $143K

Number of fines 1
66% fewer fines than Illinois average

Illinois average: 3.0

Payment Denials Info Serious action where Medicare and/or Medicaid temporarily stops payments for new residents until issues are fixed. 1
6% fewer payment denials than Illinois average

Illinois average: 1.1

Fines amount comparison
This facility $95K
Illinois average $143K
Penalty History

Penalties are imposed by CMS for violations of federal nursing home regulations.

2 penalties in the past 3 years

Multiple penalties were reported in the last 3 years.

Payment Denial Info Serious action where Medicare and/or Medicaid temporarily stops payments for new residents until issues are fixed. Jun 18, 2025
4 days
Civil Money Penalty Info Fines imposed for noncompliance, which can be assessed per day or per instance of violation. Aug 10, 2023
$95K

Last updated: Jan 2026

Quality of care over time

These measures show how residents usually do over time at this home, based on health outcomes and preventive care.

High-risk clinical events score Info A composite score based on pressure ulcers, falls with injury, weight loss, walking ability decline, and activities of daily living decline. 12.0
23% worse than Illinois average

Illinois average: 9.7

Functional decline score Info A composite score based on activities of daily living decline, walking ability decline, and incontinence. 32.9
77% worse than Illinois average

Illinois average: 18.6

Long-stay resident measures
Need for Help with Daily Activities Increased Info Percent of long-stay residents whose need for help with daily activities has increased 31.1%
101% worse than Illinois average

Illinois average: 15.5%

Low Risk Residents with Bowel/Bladder Incontinence Info Percent of low risk long-stay residents who lose control of their bowels or bladder 34.6%
60% worse than Illinois average

Illinois average: 21.6%

Falls with Major Injury Info Percent of long-stay residents experiencing one or more falls with major injury 3.8%
12% worse than Illinois average

Illinois average: 3.4%

High Risk Residents with Pressure Ulcers Info Percent of long-stay high risk residents with pressure ulcers 3.6%
31% better than Illinois average

Illinois average: 5.3%

Urinary Tract Infection Info Percent of long-stay residents with a urinary tract infection 11.6%
544% worse than Illinois average

Illinois average: 1.8%

Lost Too Much Weight Info Percent of long-stay residents who lose too much weight 9.4%
44% worse than Illinois average

Illinois average: 6.5%

Depressive Symptoms Info Percent of long-stay residents who have depressive symptoms 0.0%
100% better than Illinois average

Illinois average: 48.1%

Antipsychotic Use Info Percent of long-stay residents who received an antipsychotic medication 27.5%
36% worse than Illinois average

Illinois average: 20.2%

Pneumococcal Vaccine Info Percent of long-stay residents assessed and appropriately given the pneumococcal vaccine 100.0%
12% better than Illinois average

Illinois average: 89.2%

Influenza Vaccine Info Percent of long-stay residents assessed and appropriately given the seasonal influenza vaccine 100.0%
9% better than Illinois average

Illinois average: 91.6%

Short-stay resident measures
Pneumococcal Vaccine Info Percent of short-stay residents assessed and appropriately given the pneumococcal vaccine 96.4%
41% better than Illinois average

Illinois average: 68.3%

Antipsychotic medication increase Info Percent of short-stay residents who newly received an antipsychotic medication 0.7%
71% better than Illinois average

Illinois average: 2.3%

Influenza Vaccine Info Percent of short-stay residents assessed and appropriately given the seasonal influenza vaccine 96.8%
54% better than Illinois average

Illinois average: 63.0%

Breakdown by payment type

Medicare

95% of new residents, usually for short-term rehab.

Typical stay 25 days

Private pay

5% of new residents, often for short stays.

Typical stay 2 years

Facility Characteristics

Source: CMS Long-Term Care Facility Characteristics (Data as of Jan 2026)

Total residents 79
Medicare
33
41.8% of residents
Medicaid
1
1.3% of residents
Private pay or other
45
57% of residents
Programs & Services
Residents Group

Residents meet regularly to discuss policies, care quality, and activities

CCRC

Part of a Continuing Care Retirement Community offering multiple care levels

Active Resident Council

Organized group of residents that meets regularly to discuss facility policies, quality of life, and activities.

Finances and operations

Voluntary non-profit community
Home revenue
$36.5M
Surplus of revenue
$1.7M
Voluntary non-profit community
Home revenue
$36.5M Rank #13 / 166Revenue — State benchmarkedThis home is ranked 13th out of 166 homes in Illinois for revenue. Shows this facility's annual revenue compared to the Illinois SNF average. Higher revenue generally means more resources for staffing and capital — read alongside Payroll %.Click the rank badge to see the full State ranking.Click here to see the full State ranking.
Surplus of revenue
$1.7M
Payroll costs Info The portion of the home's budget spent on staff, including nurses, caregivers, and other employees who support care and operations. Rank #13 / 166Payroll — State benchmarkedThis home is ranked 13th out of 166 homes in Illinois for payroll. Shows total annual staff payroll benchmarked to the Illinois average. Higher payroll investment relative to peers often signals better staffing and less reliance on cheaper contract labor.Click the rank badge to see the full State ranking.Click here to see the full State ranking.
$14.1M
38.5% of revenue Rank #121 / 166Payroll % — State benchmarkedThis home is ranked 121st out of 166 homes in Illinois for payroll %. Shows payroll as a percentage of revenue versus the Illinois average. Well-run Illinois SNFs typically land around 54–67% — the top third Statewide. Below 25% may signal understaffing or heavy agency use — read with Staffing ratings.Click the rank badge to see the full State ranking.Click here to see the full State ranking.
Other operating costs Info All remaining costs needed to run the home, such as food, utilities, building maintenance, supplies and administrative expenses.
$20.8M
Total costs $34.8M

Who this home usually serves

TYPE OF STAY

Mostly short-term rehab stays

Most residents typically stay for a few weeks or months before returning home or moving on.

Places of interest near SMITH CROSSING (Assisted Living)

Address 22.0 miles from city center Info Estimated distance in miles from Orland Park's city center to SMITH CROSSING (Assisted Living)'s address, calculated via Google Maps.

Calculate Travel Distance to SMITH CROSSING (Assisted Living)

Add your location

Address

Financial Assistance for
Nursing Home in Illinois

SMITH CROSSING (Assisted Living) is located in Orland Park, Illinois.
Here are the financial assistance programs available to residents in Illinois.

Get Financial aid guidance

Community Care Program

Illinois CCP

Age 60+
General Illinois resident, at risk of nursing home placement.
Income Limits (2025) ~$1,215/month individual
Asset Limits $17,500 individual, excludes home, car
IL

High demand in urban areas; waitlists possible.

Benefits
In-home care (3-5 hours/day) Adult day services ($65/day) Emergency home response systems ($30/month)

Illinois Respite Program

IL Respite (via NFCSP)

Age Caregiver of someone 60+ (or with dementia)
General Illinois resident.
Income Limits No strict limit; prioritizes low-income.
Asset Limits Not applicable.
IL

Limited slots; urban/rural balance.

Benefits
In-home respite (4-6 hours/day) Adult day care (~$65/day) Short-term facility care (up to 5 days)

Supportive Living Program (SLP)

Illinois Medicaid Supportive Living Program

Age 65+ or 22-64 with disability
General Illinois resident, Medicaid-eligible, needs moderate assistance (not nursing home-level).
Income Limits (2025) ~$2,829/month (300% FBR, individual); QIT allowed.
Asset Limits $2,000 (individual), $3,000 (couple) (excludes home, car).
IL

~200 SLP sites statewide; room/board not covered.

Benefits
Personal care (5-7 hours/day, e.g., bathing, mobility) Meals Housekeeping Medication management Respite (~240 hours/year)

Persons Who Are Elderly Waiver

Illinois Medicaid Elderly Waiver

Age 65+
General Illinois resident, Medicaid-eligible, nursing home-level care need.
Income Limits (2025) ~$2,829/month 300% FBR, individual
Asset Limits $2,000 (individual), $3,000 (couple).
IL

Part of HealthChoice Illinois; consumer-directed options available.

Benefits
Personal care (5-7 hours/day, e.g., dressing, eating) Homemaker Adult day care (~$60/day) Respite (240 hours/year) Home mods ($1,000 avg.)

Medicare Savings Program (MSP)

Illinois Medicare Savings Program

Age 65+ or disabled
General Illinois resident, Medicare Part A/B.
Income Limits (2025) ~$2,510/month (QMB), ~$3,380/month (SLMB), ~$3,598/month (QI)—individual.
Asset Limits $9,430 (individual), $14,130 (couple).
IL

Three tiers; no waitlist.

Benefits
Covers Part B premiums ($174.70/month) Deductibles ($240/year) Copays (~20%)

Optional State Supplementation (OSS)

Illinois Optional State Supplementation

Age 65+ or disabled
General Illinois resident, in approved facility, SSI recipient or low-income.
Income Limits (2025) ~$1,004/month including SSI
Asset Limits $2,000 (individual), $3,000 (couple).
IL

~$50-$500/month based on facility type.

Benefits
Cash (~$50-$500/month) for room/board in personal care homes or SLFs

VA Aid and Attendance (A&A) and Housebound Benefits

Illinois VA Aid and Attendance/Housebound

Age 65+ or disabled veteran/spouse
General Illinois resident, wartime service, need for ADL help (A&A) or homebound.
Income Limits (2025) Net income < ~$1,984/month (veteran with dependent, A&A); pension offsets income.
Asset Limits ~$155,356 net worth limit
IL

High veteran demand in urban/rural areas.

Benefits
Cash (~$1,433-$2,642/month veteran, ~$951-$1,318 spouse) for care costs (e.g., in-home, assisted living)

Compare Nursing Home around Orland Park

The information below is reported by the Illinois Department of Public Health, Office of Health Care Regulation.

2 facilities compared · CMS & IL Dept. of Health data

Filter by care type
SMITH CROSSING (Assisted Living)
NH

Nursing Home Licensed facility providing 24/7 skilled nursing care for residents with complex, ongoing medical needs. Staffed by RNs, LPNs, and CNAs. Inspected and star-rated annually by CMS. Accepts Medicare (short-term rehab) and Medicaid (long-term care).

AL

Assisted Living A licensed, long-term care setting for seniors or individuals with disabilities who need help with daily activities — like bathing, dressing, and medication management — but not 24-hour skilled nursing. Offers housing, meals, and around-the-clock support while aiming to maximize resident independence.

Orland Park (Orland Township)
62
Facility 62
IL AVG 87
Rank #246 / 426
--5.19 -50%+67%$95.2k315.2478A+
1
Facility 1
IL AVG 51
Rank #634 / 648
Andrew Anello$36.5M$14.1M38.5%146110
Heartis Village Orland Park Assisted Living
NH

Nursing Home Licensed facility providing 24/7 skilled nursing care for residents with complex, ongoing medical needs. Staffed by RNs, LPNs, and CNAs. Inspected and star-rated annually by CMS. Accepts Medicare (short-term rehab) and Medicaid (long-term care).

AL

Assisted Living A licensed, long-term care setting for seniors or individuals with disabilities who need help with daily activities — like bathing, dressing, and medication management — but not 24-hour skilled nursing. Offers housing, meals, and around-the-clock support while aiming to maximize resident independence.

MC

Memory Care Secured, specialized care for people living with Alzheimer's or dementia. Staff trained in cognitive impairment, with higher staff-to-resident ratios and an environment designed to reduce confusion and wandering risk.

Orland Park
96
Facility 96
IL AVG 87
Rank #141 / 426
--2.21 -31%-29%$231.5k553.71076-
62
Facility 62
IL AVG 51
Rank #218 / 648
Daniel Elkaim$7.9M$5.2M65.6%145879

Frequently Asked Questions about SMITH CROSSING (Assisted Living)

What neighborhood is SMITH CROSSING (Assisted Living) in?

SMITH CROSSING (Assisted Living) is in the Orland Township neighborhood of Orland Park.

Who is the owner of SMITH CROSSING (Assisted Living)?

The legal owner and operator of SMITH CROSSING (Assisted Living) is Washington And Jane Smith Community-Orland Park.

Is SMITH CROSSING (Assisted Living) in a walkable area?

SMITH CROSSING (Assisted Living) has a walk score of 1. Car-dependent. Most errands require a car, with limited nearby walkable options.

What is the license number of SMITH CROSSING (Assisted Living)?

According to IL state health department records, SMITH CROSSING (Assisted Living)'s license number is 5101677.

When does SMITH CROSSING (Assisted Living)'s license expire?

According to IL state health department records, SMITH CROSSING (Assisted Living)'s license expires on May 26, 2027.

What is the best email address for SMITH CROSSING (Assisted Living)?

The team at SMITH CROSSING (Assisted Living) can be reached at [email protected].

How many beds does SMITH CROSSING (Assisted Living) have?

SMITH CROSSING (Assisted Living) has 62 beds.

Guides for Better Senior Living

Care Cost Calculator: See Prices in Your Area

Nursing Home Data Explorer

Don’t Wait Too Long: 7 Red Flag Signs Your Parent Needs Assisted Living Now

The True Cost of Assisted Living in 2025 – And How Families Are Paying For It

Understanding Senior Living Costs: Pricing Models, Discounts & Financial Assistance

Explore Open Rooms
1 Contact details
2 What type of senior care service are you looking for?
3 What budget do you have in mind for senior care?
4 How soon do you need to find care?
5 Additional details

Thank you for your interest!

Our team will be in touch shortly to help with next steps.