SMP Health – St. Catherine South
Nursing Home, Memory Care & Hospice Care · Fargo, ND
CMS overall rating Info The Overall CMS Rating is scored from 1 to 5 stars and combines results from health inspections, staffing levels, and quality measures. Health inspections carry the most weight. Staffing and quality scores can increase or decrease the final rating based on performance compared to state and national standards.

SMP Health – St. Catherine South

Nursing Home, Memory Care & Hospice Care · Fargo, ND
CMS overall rating Info The Overall CMS Rating is scored from 1 to 5 stars and combines results from health inspections, staffing levels, and quality measures. Health inspections carry the most weight. Staffing and quality scores can increase or decrease the final rating based on performance compared to state and national standards.
Calculator: See prices in your area
SMP Health – St. Catherine South accepts Medicare, Medicaid, and private pay.

Overview of Smp Health – St. Catherine South

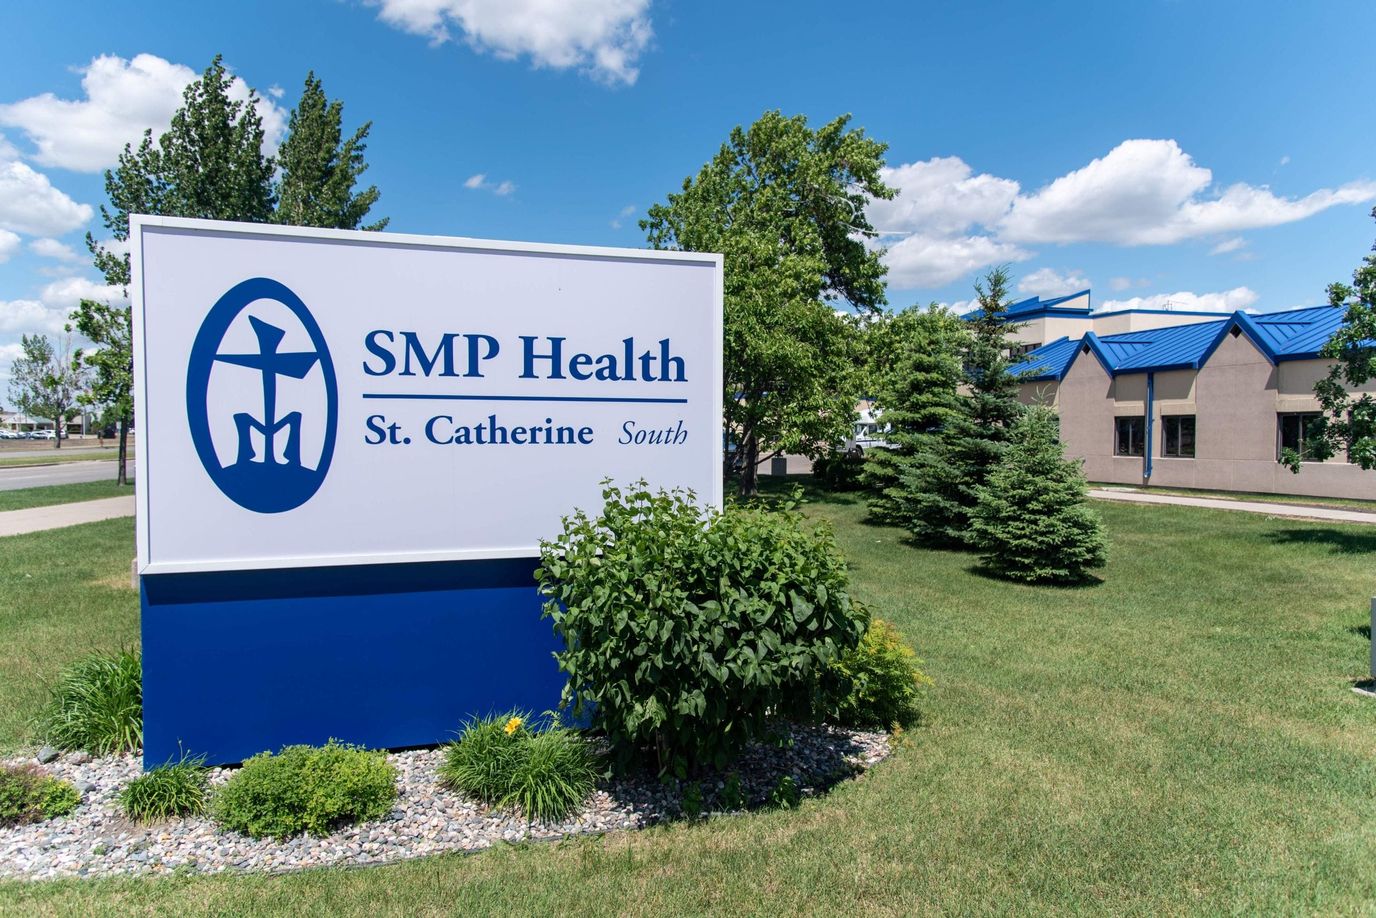
Smp Health – St. Catherine South is a dedicated team of Catholic healthcare professionals with an impressive legacy spanning over 45 years. Sponsored by the Sisters of Mary of the Presentation, this institution embodies steadfast values and a commitment to delivering exceptional nursing home services, including skilled nursing and physical care.
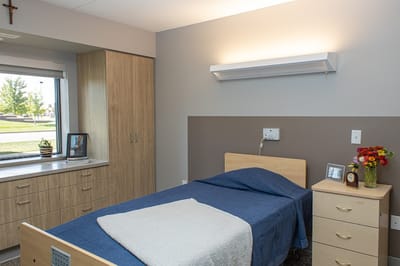
Here, community ties run deep, fostering a welcoming and inclusive atmosphere. This strong sense of camaraderie extends to their comprehensive range of offerings, encompassing rehabilitation services and adult daycare. With a profound focus on maintaining genuine relationships within the community, this institution is more than just a healthcare provider—it’s a cornerstone of support. For those seeking long-term nursing home services or looking for a place within long-term care facilities, Smp Health – St. Catherine South also stands as a reliable haven, adapting its care to meet the evolving needs of residents.

(701) 293-7750

Quality ratings

Measured by Centers for Medicare & Medicaid Services (CMS)

Overall rating Info The Overall CMS Rating combines results from health inspections, staffing levels and quality measures. Health inspections carry the most weight. Staffing and quality scores can increase or decrease the final rating based on performance compared to state and national standards.
▲ 60.7% Above ND avg. ▲ 60.7% Above ND avg.Click the badge to see the full State ranking.Click here to see the full State ranking.
Health Inspection Info Based on the results of the facility's three most recent standard inspections and any complaint investigations. CMS reviews the number, scope, and severity of deficiencies, with more recent findings weighted more heavily.
▲ 77.3% Above ND avg. ▲ 77.3% Above ND avg.Click the badge to see the full State ranking.Click here to see the full State ranking.
Staffing Info Measures average nursing staff hours per resident per day, including Registered Nurses (RNs) and total nursing staff. Ratings are adjusted based on the level of care residents require and are compared to state and national benchmarks.
▲ 15.4% Above ND avg. ▲ 15.4% Above ND avg.Click the badge to see the full State ranking.Click here to see the full State ranking.
Quality Measures Info Based on clinical and physical health indicators reported to CMS, such as hospital readmissions, falls, pressure ulcers, and improvements in mobility. These measures reflect how well residents' health needs are being managed.
▼ 25.8% Below ND avg. ▼ 25.8% Below ND avg.Click the badge to see the full State ranking.Click here to see the full State ranking.

Staffing hours breakdown

Info Daily nursing hours per resident by staff type, reported to CMS. Higher is generally better — compare this facility to state and national averages to see where staffing stands.

Hours per resident per day — compared to North Dakota state averages

Total nursing care / resident Info This home is ranked 4th out of 25 homes in North Dakota. Total adjusted nursing hours per resident per day, combining RN, LPN, and aide time. CMS adjusts this for case-mix so facilities can be fairly compared.
5h 50m per day
Rank #4 / 25Nurse hours — State benchmarkedThis home is ranked 4th out of 25 homes in North Dakota. Shows adjusted nurse hours per resident per day benchmarked to the North Dakota average, with a ranking across 25 North Dakota SNFs. More hours mean more direct care. The national average is about 3.5 hrs; below 3.0 is a red flag.Click the rank badge to see the full State ranking.Click here to see the full State ranking.
This facility North Dakota avg (5h 10m per day)
vs North Dakota avg
+13%

0 of 6 metrics below state avg

Standout metric LPN / LVN is +67% above state avg
Staff typeHours / Day / Residentvs state avg
Registered Nurse (RN) Info RNs hold the highest nursing license and can assess residents, interpret test results, and direct care plans. More RN hours per day often signals stronger clinical oversight and faster response to health changes. 1h 6m per day ▲ 20% State avg: 55m per day · National avg: 41m per day
LPN / LVN Info Licensed Practical Nurses (LPNs) or Licensed Vocational Nurses (LVNs) deliver routine hands-on care — medication administration, wound dressing, and monitoring vital signs. They work under RN supervision and make up a large share of daily bedside care. 50m per day ▲ 67% State avg: 30m per day · National avg: 52m per day
Nurse Aide Info Certified Nurse Aides (CNAs) provide the most direct day-to-day assistance: bathing, dressing, feeding, and mobility. Nurse aide hours are typically the largest staffing category and directly affect residents' quality of life. 3h 47m per day ▲ 26% State avg: 3h 0m per day · National avg: 2h 21m per day
Weekend Total Nursing Info Combined nursing hours (RN + LPN + Nurse Aide) per resident per day on weekends. Staffing often drops on weekends — this figure reveals whether the facility maintains adequate coverage outside of weekday hours. 4h 59m per day ▲ 32% State avg: 3h 46m per day · National avg: 3h 26m per day
Physical Therapist Info Hours per resident per day provided by licensed Physical Therapists (PTs) or PT Assistants. PT services help residents recover mobility after injury or illness and are especially important for post-acute (short-stay) rehabilitation. 2m per day ■ Avg State avg: 2m per day · National avg: 4m per day
Weekend RN Info Registered nurse hours specifically on weekends. Facilities sometimes reduce RN presence on Saturdays and Sundays — a low weekend RN figure compared to weekday hours can indicate reduced clinical oversight when most administrative staff are absent. 48m per day ▲ 37% State avg: 35m per day · National avg: 29m per day

Types of Care at SMP Health – St. Catherine South

Nursing Home Memory Care Hospice Care

Capacity and availability

This home usually has limited availability

Occupancy between 85% and 95% suggests balanced demand.

Higher occupancy than the North Dakota average: 87.8%
Occupancy rate 93.8% Rank #13 / 23Occupancy rate — State benchmarkedThis home is ranked 13th out of 23 homes in North Dakota. Shows this facility's occupancy rate versus the North Dakota average, with its Statewide rank out of 23. Higher occupancy signals strong local demand and financial stability.Click the rank badge to see the full State ranking.Click here to see the full State ranking.
Avg. Length of Stay 234 days
Occupancy rate
93.8% Rank #13 / 23Occupancy rate — State benchmarkedThis home is ranked 13th out of 23 homes in North Dakota. Shows this facility's occupancy rate versus the North Dakota average, with its Statewide rank out of 23. Higher occupancy signals strong local demand and financial stability.Click the rank badge to see the full State ranking.Click here to see the full State ranking.
Avg. Length of Stay
234 days
Walk Score
Walk Score: 67 / 100 Rank #16 / 80Walk Score — State benchmarkedThis home is ranked 16th out of 80 homes in North Dakota. Shows how walkable this facility's neighborhood is compared to the average Walk Score across North Dakota SNFs. Higher scores benefit residents, families, and staff.Click the rank badge to see the full State ranking.Click here to see the full State ranking.
Moderately walkable. Some errands can be accomplished on foot, with a mix of nearby amenities.

Contact SMP Health – St. Catherine South

Staffing Data

Reporting period: October 1 – December 31, 2025 (Q4 2025). Source: CMS Payroll-Based Journal report.

Total staff 170
Employees 150
Contractors 20
Staff to resident ratio 1.98:1
0% compared with North Dakota average
North Dakota average ratio: 1.92:1 North Dakota average ratio: 1.92:1See full North Dakota ranking
Avg staff/day 71
Average shift 7.6 hours
0% compared with North Dakota average
North Dakota average: 7.9 hours North Dakota average shift: 7.9 hoursSee full North Dakota ranking
Total staff hours (quarter) 49,342

Nursing staff breakdown

Q4 2025 · Oct 1 – Dec 31 More info This data comes from the CMS Payroll-Based Journal report covering October 1 – December 31, 2025.
Registered Nurse

Manages medical care and health needs.

RN Staff 23
Average shift length Info Average shift length. Calculated as total hours divided by days worked and average staff per day. 8.1 hours

No contractors work on this role.

Licensed Practical Nurse

Assists with medical care and medications.

LPN Staff 19
Average shift length Info Average shift length. Calculated as total hours divided by days worked and average staff per day. 8.4 hours

No contractors work on this role.

Certified Nursing Assistant

Helps with daily care and mobility.

CNA Staff 86
Average shift length Info Average shift length. Calculated as total hours divided by days worked and average staff per day. 7.7 hours

No contractors work on this role.

Contractor staffing

Q4 2025 · Oct 1 – Dec 31 More info This data comes from the CMS Payroll-Based Journal report covering October 1 – December 31, 2025.

Total hours from contractors

3.5%

1,745 contractor hours this quarter

Respiratory Therapy Technician: 5 Speech Language Pathologist: 4 Physical Therapy Assistant: 3 Physical Therapy Aide: 3 Qualified Social Worker: 2 Administrator: 1 Occupational Therapy Assistant: 1 Medical Director: 1

Staff by category

Q4 2025 · Oct 1 – Dec 31 More info This data comes from the CMS Payroll-Based Journal report covering October 1 – December 31, 2025.
Certified Nursing Assistant8608627,48192100%7.7
Registered Nurse230237,71392100%8.1
Licensed Practical Nurse190195,87592100%8.4
Medication Aide/Technician9092,15192100%7.2
Mental Health Service Worker3031,2596874%7.3
Clinical Nurse Specialist2029406470%8
Other Dietary Services Staff5057988390%6.5
Dental Services Staff1014916166%8
Nurse Practitioner1014675964%7.9
Occupational Therapy Aide1014226267%6.8
Physical Therapy Assistant0333967076%3.8
Speech Language Pathologist0443436571%3.8
Physical Therapy Aide0332786470%4.2
Administrator0112343538%6.7
Qualified Social Worker0222326874%3.3
Respiratory Therapy Technician0552195964%3.5
Occupational Therapy Assistant0113667%6
Medical Director011755%1.5
86 Certified Nursing Assistant
% of Days 100%
23 Registered Nurse
% of Days 100%
19 Licensed Practical Nurse
% of Days 100%
9 Medication Aide/Technician
% of Days 100%
3 Mental Health Service Worker
% of Days 74%
2 Clinical Nurse Specialist
% of Days 70%
5 Other Dietary Services Staff
% of Days 90%
1 Dental Services Staff
% of Days 66%
1 Nurse Practitioner
% of Days 64%
1 Occupational Therapy Aide
% of Days 67%
3 Physical Therapy Assistant
% of Days 76%
4 Speech Language Pathologist
% of Days 71%
3 Physical Therapy Aide
% of Days 70%
1 Administrator
% of Days 38%
2 Qualified Social Worker
% of Days 74%
5 Respiratory Therapy Technician
% of Days 64%
1 Occupational Therapy Assistant
% of Days 7%
1 Medical Director
% of Days 5%

Penalties and fines

Federal penalties imposed by CMS for regulatory violations, including civil money penalties (fines) and denials of payment for new Medicare/Medicaid admissions.

Source: CMS Penalties Database

No penalties in the past 3 years

No civil money penalties or payment denials were reported in the last 3 years.

Quality of care over time

These measures show how residents usually do over time at this home, based on health outcomes and preventive care.

High-risk clinical events score Info A composite score based on pressure ulcers, falls with injury, weight loss, walking ability decline, and activities of daily living decline. 12.0
5% worse than North Dakota average

North Dakota average: 11.4

Functional decline score Info A composite score based on activities of daily living decline, walking ability decline, and incontinence. 26.5
20% worse than North Dakota average

North Dakota average: 22.0

Long-stay resident measures
Below average North Dakota avg: 3.0 Info CMS star rating based on long-stay quality measure performance. 5 stars = significantly above average, 1 star = significantly below average.
Need for Help with Daily Activities Increased Info Percent of long-stay residents whose need for help with daily activities has increased 18.1%
11% better than North Dakota average

North Dakota average: 20.4%

Walking Ability Worsened Info Percent of long-stay residents whose ability to move independently worsened 27.6%
34% worse than North Dakota average

North Dakota average: 20.6%

Low Risk Residents with Bowel/Bladder Incontinence Info Percent of low risk long-stay residents who lose control of their bowels or bladder 33.9%
36% worse than North Dakota average

North Dakota average: 25.0%

Falls with Major Injury Info Percent of long-stay residents experiencing one or more falls with major injury 4.3%
14% better than North Dakota average

North Dakota average: 5.0%

High Risk Residents with Pressure Ulcers Info Percent of long-stay high risk residents with pressure ulcers 5.1%
9% better than North Dakota average

North Dakota average: 5.6%

Urinary Tract Infection Info Percent of long-stay residents with a urinary tract infection 1.3%
63% better than North Dakota average

North Dakota average: 3.4%

Lost Too Much Weight Info Percent of long-stay residents who lose too much weight 4.9%
13% better than North Dakota average

North Dakota average: 5.7%

Depressive Symptoms Info Percent of long-stay residents who have depressive symptoms 1.3%
71% better than North Dakota average

North Dakota average: 4.4%

Antipsychotic Use Info Percent of long-stay residents who received an antipsychotic medication 18.1%
16% better than North Dakota average

North Dakota average: 21.4%

Pneumococcal Vaccine Info Percent of long-stay residents assessed and appropriately given the pneumococcal vaccine 98.5%
In line with North Dakota average

North Dakota average: 98.4%

Influenza Vaccine Info Percent of long-stay residents assessed and appropriately given the seasonal influenza vaccine 100.0%
In line with North Dakota average

North Dakota average: 98.8%

Hospitalizations per 1,000 days Info Number of hospitalizations per 1,000 long-stay resident days. 1.86
26% worse than North Dakota average

North Dakota average: 1.48

ED visits per 1,000 days Info Number of outpatient emergency department visits per 1,000 long-stay resident days. 1.04
45% better than North Dakota average

North Dakota average: 1.90

Short-stay resident measures
Average North Dakota avg: 2.3 Info CMS star rating based on short-stay quality measure performance. 5 stars = much above average, 1 star = much below average.
Pneumococcal Vaccine Info Percent of short-stay residents assessed and appropriately given the pneumococcal vaccine 90.3%
In line with North Dakota average

North Dakota average: 94.4%

Antipsychotic medication increase Info Percent of short-stay residents who newly received an antipsychotic medication 1.7%
17% better than North Dakota average

North Dakota average: 2.1%

Influenza Vaccine Info Percent of short-stay residents assessed and appropriately given the seasonal influenza vaccine 95.7%
8% better than North Dakota average

North Dakota average: 88.6%

Re-hospitalized after SNF stay Info Percentage of short-stay residents who were re-hospitalized after their nursing home admission. 26.3%
26% worse than North Dakota average

North Dakota average: 20.9%

Emergency department visits Info Percentage of short-stay residents who had an outpatient emergency department visit. 5.6%
47% better than North Dakota average

North Dakota average: 10.6%

Falls with major injury Info Percentage of SNF residents who experience falls with major injury during their stay. 0.0%
100% better than North Dakota average

North Dakota average: 0.8%

Ability to care for self at discharge Info Percentage of residents at or above expected ability to care for themselves at discharge. 36.2%
33% worse than North Dakota average

North Dakota average: 53.7%

Successful return to home or community Info Rate of successful return to home or community from a skilled nursing facility. 46.1%
9% worse than North Dakota average

North Dakota average: 50.6%

Breakdown by payment type

Medicare

67% of new residents, usually for short-term rehab.

Typical stay 1 - 2 months

Private pay

29% of new residents, often for short stays.

Typical stay 9 - 10 months

Medicaid

4% of new residents, often for long-term daily care.

Typical stay 7 - 8 years

Facility Characteristics

Source: CMS Long-Term Care Facility Characteristics (Data as of Jan 2026)

Total residents 86
Medicare
8
9.3% of residents
Medicaid
47
54.7% of residents
Private pay or other
31
36% of residents
Programs & Services
Residents Group

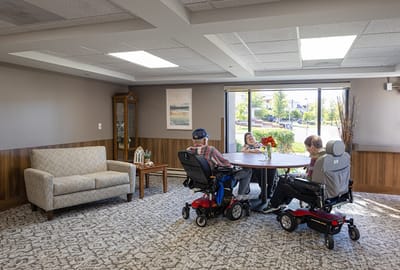
Residents meet regularly to discuss policies, care quality, and activities

Active Resident Council

Organized group of residents that meets regularly to discuss facility policies, quality of life, and activities.

Finances and operations

Voluntary non-profit community
Home revenue
$15.0M
Surplus of revenue
$888.5K
Voluntary non-profit community
Home revenue
$15.0M Rank #11 / 22Revenue — State benchmarkedThis home is ranked 11th out of 22 homes in North Dakota. Shows this facility's annual revenue compared to the North Dakota SNF average. Higher revenue generally means more resources for staffing and capital — read alongside Payroll %.Click the rank badge to see the full State ranking.Click here to see the full State ranking.
Surplus of revenue
$888.5K
Payroll costs Info The portion of the home's budget spent on staff, including nurses, caregivers, and other employees who support care and operations. Rank #10 / 22Payroll — State benchmarkedThis home is ranked 10th out of 22 homes in North Dakota. Shows total annual staff payroll benchmarked to the North Dakota average. Higher payroll investment relative to peers often signals better staffing and less reliance on cheaper contract labor.Click the rank badge to see the full State ranking.Click here to see the full State ranking.
$9.6M
63.9% of revenue Rank #9 / 22Payroll % — State benchmarkedThis home is ranked 9th out of 22 homes in North Dakota. Shows payroll as a percentage of revenue versus the North Dakota average. Well-run North Dakota SNFs typically land around 67–77% — the top third Statewide. Below 25% may signal understaffing or heavy agency use — read with Staffing ratings.Click the rank badge to see the full State ranking.Click here to see the full State ranking.
Other operating costs Info All remaining costs needed to run the home, such as food, utilities, building maintenance, supplies and administrative expenses.
$4.5M
Total costs $14.1M

Who this home usually serves

TYPE OF STAY

Mostly short-term rehab stays

Most residents typically stay for a few weeks or months before returning home or moving on.

Places of interest near SMP Health – St. Catherine South

Address 3.5 miles from city center Info Estimated distance in miles from Fargo's city center to SMP Health – St. Catherine South's address, calculated via Google Maps. — 1.08 miles to nearest hospital (Dando Vein Associates at Skin Care Doctors, Fargo, ND)

Calculate Travel Distance to SMP Health – St. Catherine South

Add your location

Address

Financial Assistance for
Nursing Home in North Dakota

SMP Health – St. Catherine South is located in Fargo, North Dakota.
Here are the financial assistance programs available to residents in North Dakota.

Get Financial aid guidance

Aged and Disabled Waiver

ND Medicaid A&D Waiver

Age 65+ or disabled
General North Dakota resident, Medicaid- eligible, nursing home-level care need.
Income Limits (2025) ~$2,829/month 300% FBR, individual
Asset Limits $3,000 individual, higher than most states
ND

Higher asset limit; sparse population aids rural access.

Benefits
Personal care (5-7 hours/day) Respite (240 hours/year) Adult day care (~$60/day) Home aides

Service Payments for Elderly and Disabled (SPED)

ND SPED

Age 65+ or disabled
General North Dakota resident, at risk of decline.
Income Limits ~$1,732/month individual, varies
Asset Limits $50,000 individual, higher limit
ND

Higher asset limit; rural focus.

Benefits
In-home care (2-4 hours/week) Respite (up to 5 days/year) Transportation (~5 trips/month)

Basic Care Assistance Program (BCAP)

North Dakota Basic Care Assistance Program

Age 65+ (or disabled 18+)
General ND resident, in licensed basic care facility, low-income.
Income Limits (2025) ~$1,255/month (individual, after facility costs); varies by facility rate.
Asset Limits $3,000 individual
ND

Supplements SSI; covers ~50 facilities statewide.

Benefits
Cash (~$1,000-$1,500/month) for room/board/care in basic care facilities

Family Home Care Program

North Dakota Family Home Care Program

Age 60+
General ND resident, need help with 1+ ADL, family caregiver available.
Income Limits (2025) No strict cap; prioritizes low-income ~$24,980/year
Asset Limits Not assessed; need-based.
ND

Caregiver must be family; payment varies by hours/service.

Benefits
Family caregiver payment (~$10-$15/hour, up to 20 hours/week) Respite support

Medicare Savings Program (MSP)

North Dakota Medicare Savings Program

Age 65+ or disabled
General ND resident, Medicare Part A/B.
Income Limits (2025) ~$2,510/month (QMB), ~$3,380/month (SLMB), ~$3,598/month (QI)—individual.
Asset Limits $9,430 (individual), $14,130 (couple).
ND

Three tiers; no waitlist; includes Extra Help for Part D.

Benefits
Covers Part B premiums ($174.70/month) Deductibles ($240/year) Copays (~20%)

Family Caregiver Support Program (FCSP)

North Dakota Family Caregiver Support Program

Age
General Caregivers of 60+ needing care or 55+ caregivers of others; ND resident; functional needs (2+ ADLs).
Income Limits (2025) Prioritizes ~$24,980/year (individual); no strict cap.
Asset Limits Not assessed; need-based.
ND

8 regions; rural/low-income priority.

Benefits
Respite (4-6 hours/week or 5 days/year) Adult day care ($50/day) Training Supplies (~$500/year)

VA Aid and Attendance (A&A) and Housebound Benefits

North Dakota VA Aid and Attendance/Housebound

Age 65+ or disabled veteran/spouse
General ND resident, wartime service, need for ADL help (A&A) or homebound.
Income Limits (2025) Net income < ~$1,984/month (veteran with dependent, A&A); pension offsets income.
Asset Limits ~$155,356 net worth limit
ND

High veteran demand in rural areas; ND Veterans Home option.

Benefits
Cash (~$1,433-$2,642/month veteran, ~$951-$1,318 spouse) for care costs (e.g., in-home, assisted living)

Property Tax Homestead Credit for Seniors

North Dakota Homestead Property Tax Credit

Age 65+ (or disabled)
General ND resident, homeowner, low-income.
Income Limits (2025) ~$22,500/year (individual), ~$29,500/year (couple).
Asset Limits Home value < $500,000; other assets not assessed.
ND

Credit up to $500-$1,000; applies to primary residence.

Benefits
Tax reduction (~$500-$1,000/year) on property taxes

Medicaid Personal Care Option (PCO)

North Dakota Medicaid Personal Care Option

Age 65+ (or disabled)
General ND resident, Medicaid-eligible, need help with 1+ ADL.
Income Limits (2025) ~$1,255/month (100% FPL, individual); QIT optional for excess income.
Asset Limits $3,000 (individual), $6,000 (couple) (excludes home up to $713,000, car).
ND

Self-directed option (hire family); part of Medicaid State Plan, not a waiver.

Benefits
Personal care (5-20 hours/week) Homemaker services Respite (~5 days/year)

Compare Nursing Home around Fargo

The information below is reported by the North Dakota Department of Health and Human Services, Health Facilities Division.

2 facilities compared · CMS & ND Dept. of Health data

Filter by care type
SMP Health – St. Catherine South
NH

Nursing Home Licensed facility providing 24/7 skilled nursing care for residents with complex, ongoing medical needs. Staffed by RNs, LPNs, and CNAs. Inspected and star-rated annually by CMS. Accepts Medicare (short-term rehab) and Medicaid (long-term care).

HC

Home Care Professional care delivered in the person's own home — from companionship and errands to skilled nursing and therapy. Allows seniors to age in place. Medicare covers skilled home health when medically necessary.

MC

Memory Care Secured, specialized care for people living with Alzheimer's or dementia. Staff trained in cognitive impairment, with higher staff-to-resident ratios and an environment designed to reduce confusion and wandering risk.

Fargo (Lincoln)91 93.8% +7%5.83 +3%+13%$0103.3-88- 67 -$15.0M$9.6M63.9%355079
Bethany Retirement Living
NH

Nursing Home Licensed facility providing 24/7 skilled nursing care for residents with complex, ongoing medical needs. Staffed by RNs, LPNs, and CNAs. Inspected and star-rated annually by CMS. Accepts Medicare (short-term rehab) and Medicaid (long-term care).

AL

Assisted Living A licensed, long-term care setting for seniors or individuals with disabilities who need help with daily activities — like bathing, dressing, and medication management — but not 24-hour skilled nursing. Offers housing, meals, and around-the-clock support while aiming to maximize resident independence.

IL

Independent Living Lifestyle-focused communities for older adults offering dining, activities, and transportation with minimal personal care. Best for active, independent seniors who want community without medical support.

MC

Memory Care Secured, specialized care for people living with Alzheimer's or dementia. Staff trained in cognitive impairment, with higher staff-to-resident ratios and an environment designed to reduce confusion and wandering risk.

Fargo (Jefferson)45 98.3% +12%5.46 -37%+6%$091.51164B- 75 American Lutheran Homes Inc$29.7M$20.9M70.2%355086

Frequently Asked Questions about SMP Health – St. Catherine South

What neighborhood is SMP Health – St. Catherine South in?

SMP Health – St. Catherine South is in the Lincoln neighborhood.

Is SMP Health – St. Catherine South in a walkable area?

SMP Health – St. Catherine South has a walk score of 67. Moderately walkable. Some errands can be accomplished on foot, with a mix of nearby amenities.

What is the phone number of SMP Health – St. Catherine South?

(701) 293-7750 will put you in contact with the team at SMP Health – St. Catherine South.

Is SMP Health – St. Catherine South Medicare or Medicaid certified?

Yes — SMP Health – St. Catherine South is a CMS-certified provider of Medicare and Medicaid.

Guides for Better Senior Living

Care Cost Calculator: See Prices in Your Area

Nursing Home Data Explorer

Don’t Wait Too Long: 7 Red Flag Signs Your Parent Needs Assisted Living Now

The True Cost of Assisted Living in 2025 – And How Families Are Paying For It

Understanding Senior Living Costs: Pricing Models, Discounts & Financial Assistance

Explore Open Rooms
1 Contact details
2 What type of senior care service are you looking for?
3 What budget do you have in mind for senior care?
4 How soon do you need to find care?
5 Additional details

Thank you for your interest!

Our team will be in touch shortly to help with next steps.