Sprenger Healthcare at Port Royal Assisted Living
CMS overall rating Info CMS (the Centers for Medicare & Medicaid Services) is the federal agency that rates nursing home quality. Its Overall Rating runs from 1 to 5 stars, combining health inspections, staffing, and quality measures, with inspections weighted most heavily.

Sprenger Healthcare at Port Royal Assisted Living

CMS overall rating Info CMS (the Centers for Medicare & Medicaid Services) is the federal agency that rates nursing home quality. Its Overall Rating runs from 1 to 5 stars, combining health inspections, staffing, and quality measures, with inspections weighted most heavily.
Calculator: See prices in your area
Sprenger Healthcare at Port Royal Assisted Living accepts Medicare and private pay.

Overview of Sprenger Healthcare at Port Royal Assisted Living

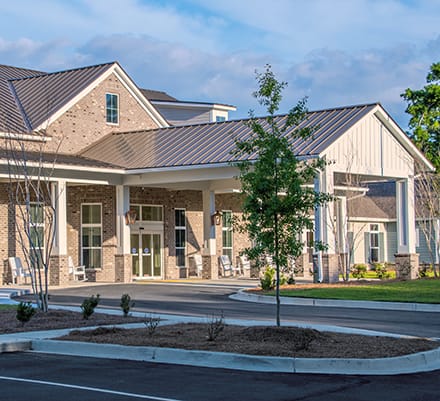
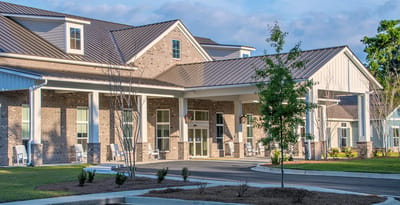
Sprenger Healthcare at Port Royal Assisted Living is a 59-bed skilled nursing and assisted living community that’s part of a continuing care retirement campus in Port Royal, Beaufort County, South Carolina. Services feature skilled nursing, short-term rehabilitation, respite care, and memory care. Administered by Teresa Griffing and owned by Sprenger Healthcare of Port Royal Inc., the facility accepts Medicare and private pay and serves primarily short-stay residents. Average stay is 31 days, and 64 percent of admissions are on private pay.

CMS rates Sprenger Healthcare at Port Royal Assisted Living 5 stars, 70.6 percent above South Carolina’s average, with above-average scores across all four sub-categories. The health inspection record is exceptional: 2 total citations across 2 inspections since 2021, ranking the facility 2nd of 113 South Carolina nursing homes by total citations and 1st in the state by citations per inspection. Zero critical or serious citations recorded, with both citations moderate and promptly corrected, and no penalties in the past three years. The health inspection sub-rating is 81.8 percent above South Carolina’s average. Long-stay functional outcomes are consistently strong. Only 3.1 percent of long-stay residents experienced increased need for daily activity assistance, 76 percent better than South Carolina’s 13.1 percent average, and 3.7 percent saw walking ability worsen, 77 percent better than the state figure. Antipsychotic use at 1.8 percent is 88 percent below South Carolina’s 14.5 percent average, and zero long-stay residents were recorded with depressive symptoms against a 2.8 percent state average. Falls with major injury at 10.6 percent among long-stay residents are 255 percent above the 3.0 percent state average, the single most significant quality concern that should be addressed with clinical leadership.

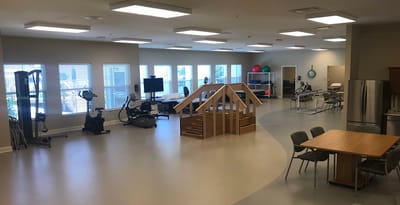
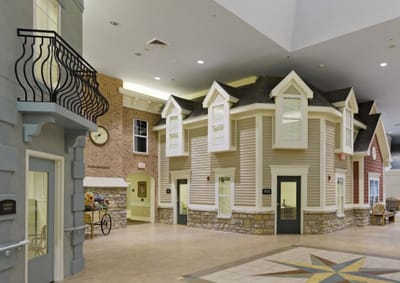
Confirmed amenities include a nurse practitioner and home health services on-site, a therapy gym, a bar with daily happy hour, and a chapel.
Sprenger Healthcare at Port Royal Assisted Living is best for Beaufort County families seeking a 5-star rated community with an outstanding clean inspection record and functional outcome measures for longer-stay residents. Families should ask about fall prevention protocols before continuing.

(843) 781-7700

Quality ratings

Measured by Centers for Medicare & Medicaid Services (CMS)

Overall rating Info The Overall CMS Rating combines results from health inspections, staffing levels and quality measures. Health inspections carry the most weight. Staffing and quality scores can increase or decrease the final rating based on performance compared to state and national standards.
▲ 36.5% Above SC avg. ▲ 36.5% Above SC avg.Click the badge to see the full State ranking.Click here to see the full State ranking.
Health Inspection Info Based on the results of the facility's three most recent standard inspections and any complaint investigations. CMS reviews the number, scope, and severity of deficiencies, with more recent findings weighted more heavily.
▲ 45.5% Above SC avg. ▲ 45.5% Above SC avg.Click the badge to see the full State ranking.Click here to see the full State ranking.
Staffing Info Measures average nursing staff hours per resident per day, including Registered Nurses (RNs) and total nursing staff. Ratings are adjusted based on the level of care residents require and are compared to state and national benchmarks.
▲ 35.6% Above SC avg. ▲ 35.6% Above SC avg.Click the badge to see the full State ranking.Click here to see the full State ranking.
Quality Measures Info Based on clinical and physical health indicators reported to CMS, such as hospital readmissions, falls, pressure ulcers, and improvements in mobility. These measures reflect how well residents' health needs are being managed.
▲ 14.6% Above SC avg. ▲ 14.6% Above SC avg.Click the badge to see the full State ranking.Click here to see the full State ranking.

Staffing hours breakdown

Info Daily nursing hours per resident by staff type, reported to CMS. Higher is generally better — compare this facility to state and national averages to see where staffing stands.

Hours per resident per day — compared to South Carolina state averages

Total nursing care / resident Info This home is ranked 47th out of 112 homes in South Carolina for nurse hours. Total adjusted nursing hours per resident per day, combining RN, LPN, and aide time. CMS adjusts this for case-mix so facilities can be fairly compared.
4h 1m per day
Rank #47 / 112Nurse hours — State benchmarkedThis home is ranked 47th out of 112 homes in South Carolina. Shows adjusted nurse hours per resident per day benchmarked to the South Carolina average, with a ranking across 112 South Carolina facilities. More hours mean more direct care. The national average is about 3.5 hrs; below 3.0 is a red flag.Click the rank badge to see the full State ranking.Click here to see the full State ranking.
This facility South Carolina avg (4h 5m per day)
vs South Carolina avg
-2%

4 of 6 metrics below state avg

Standout metric Weekend RN is +83% above state avg
Staff typeHours / Day / Residentvs state avg
Registered Nurse (RN) Info RNs hold the highest nursing license and can assess residents, interpret test results, and direct care plans. More RN hours per day often signals stronger clinical oversight and faster response to health changes. 58m per day ▲ 54% State avg: 38m per day · National avg: 41m per day
LPN / LVN Info Licensed Practical Nurses (LPNs) or Licensed Vocational Nurses (LVNs) deliver routine hands-on care — medication administration, wound dressing, and monitoring vital signs. They work under RN supervision and make up a large share of daily bedside care. 38m per day ▼ 36% State avg: 1h 0m per day · National avg: 52m per day
Nurse Aide Info Certified Nurse Aides (CNAs) provide the most direct day-to-day assistance: bathing, dressing, feeding, and mobility. Nurse aide hours are typically the largest staffing category and directly affect residents' quality of life. 1h 55m per day ▼ 14% State avg: 2h 13m per day · National avg: 2h 20m per day
Weekend Total Nursing Info Combined nursing hours (RN + LPN + Nurse Aide) per resident per day on weekends. Staffing often drops on weekends — this figure reveals whether the facility maintains adequate coverage outside of weekday hours. 3h 8m per day ▼ 7% State avg: 3h 22m per day · National avg: 3h 27m per day
Physical Therapist Info Hours per resident per day provided by licensed Physical Therapists (PTs) or PT Assistants. PT services help residents recover mobility after injury or illness and are especially important for post-acute (short-stay) rehabilitation. 3m per day ▼ 35% State avg: 5m per day · National avg: 4m per day
Weekend RN Info Registered nurse hours specifically on weekends. Facilities sometimes reduce RN presence on Saturdays and Sundays — a low weekend RN figure compared to weekday hours can indicate reduced clinical oversight when most administrative staff are absent. 46m per day ▲ 83% State avg: 25m per day · National avg: 29m per day

Capacity and availability

This home usually has availability

Lower occupancy than the South Carolina average: 82.1%
Occupancy rate
77.3% Rank #86 / 122Occupancy rate — State benchmarkedThis home is ranked 86th out of 122 homes in South Carolina. Shows this facility's occupancy rate versus the South Carolina average, with its Statewide rank out of 122. Higher occupancy signals strong local demand and financial stability.Click the rank badge to see the full State ranking.Click here to see the full State ranking.
Avg. Length of Stay
31 days
Bed community size
59-bed community Rank #225 / 309Bed count — State benchmarkedThis home is ranked 225th out of 309 homes in South Carolina. Shows this facility's certified or reported bed count compared to other South Carolina facilities. Larger communities may offer more amenities, programs, and on-site services for residents and families.Click the rank badge to see the full State ranking.Click here to see the full State ranking.
A moderately sized community that may balance personal attention with shared amenities and social activities.

About this community

License Details

Facility TypeHl- Community Residential Care Facility
StatusActive
CountyBeaufort
License NumberCRC-2016
Business TypeCorporation
CMS Certification Number425413

Ownership & Operating Entity

Sprenger Healthcare at Port Royal Assisted Living is legally operated by Sprenger Healthcare Of Port Royal Inc, and administrated by Teresa Griffing.

Owner NameSprenger Healthcare Of Port Royal Inc

Therapy & Rehabilitation

3 services
Rehabilitation Services
Respite Care
Short-Term Rehab

Contact Information

Amenities & Lifestyle

Bar With Daily Happy Hour
Chapel
Therapy Gym
Specific ProgramsHome Health, Nurse Practitioner

Contact Sprenger Healthcare at Port Royal Assisted Living

Health Inspection History

Inspections since 2021
Total health inspections 2

South Carolina average 3.9


Last Health inspection on Sep 2023

Total health citations
2 Rank #2 / 113Health citations — State benchmarkedThis home is ranked 2nd out of 113 homes in South Carolina. Shows this facility's total health deficiency citations benchmarked to the South Carolina State average, with a ranking across all 113 SC facilities. Lower citation counts earn a better rank.Click the rank badge to see the full State ranking.Click here to see the full State ranking.

South Carolina average 13.7

Citations per inspection
1 Rank #1 / 113Citations per inspection — State benchmarkedThis home is ranked 1st out of 113 homes in South Carolina. Shows average deficiency citations per CMS inspection for this facility versus the South Carolina mean across 113 facilities with citation data. Lower is better.Click the rank badge to see the full State ranking.Click here to see the full State ranking.

South Carolina average 3.44


Health citations are formal notices following inspections when they fail to comply with safety and care standards.

1 of 2 citations resulted from standard inspections; and 1 of 2 resulted from complaint investigations.

Breakdown of citation severity (last 5 years)
Critical health citations
0
100% better than South Carolina average

South Carolina average: 1


Serious health citations
0
100% better than South Carolina average

South Carolina average: 0.3

0 critical citations South Carolina average: 1

0 serious citations South Carolina average: 0.3

2 moderate citations South Carolina average: 12.3

0 minor citations South Carolina average: 0.1
Citations history (last 5 years)
Care Planning moderate citation Sep 30, 2023
Corrected

Pharmacy moderate citation Aug 20, 2021
Corrected

Staffing Data

Reporting period: October 1 – December 31, 2025 (Q4 2025). Source: CMS Payroll-Based Journal report.

Total staff 87
Employees 80
Contractors 7
Staff to resident ratio 2.07 : 1
13% more staff per resident than South Carolina average
South Carolina average ratio: 1.84 : 1 South Carolina average ratio: 1.84 : 1See full South Carolina ranking
Avg staff/day 29
Average shift 8.3 hours
5% better than South Carolina average
South Carolina average: 7.9 hours South Carolina average shift: 7.9 hoursSee full South Carolina ranking
Total staff hours (quarter) 22,096

Nursing staff breakdown

Q4 2025 · Oct 1 – Dec 31 More info This data comes from the CMS Payroll-Based Journal report covering October 1 – December 31, 2025.
Registered Nurse

Manages medical care and health needs.

RN Staff Info 12 total: 9 full-time employees and 3 contractors. 12
Average shift length Info Average shift length. Calculated as total hours divided by days worked and average staff per day. 9.5 hours
Licensed Practical Nurse

Assists with medical care and medications.

LPN Staff Info 11 total: 10 full-time employees and 1 contractor. 11
Average shift length Info Average shift length. Calculated as total hours divided by days worked and average staff per day. 9.4 hours
Certified Nursing Assistant

Helps with daily care and mobility.

CNA Staff Info 31 total: 29 full-time employees and 2 contractors. 31
Average shift length Info Average shift length. Calculated as total hours divided by days worked and average staff per day. 9.2 hours

Contractor staffing

Q4 2025 · Oct 1 – Dec 31 More info This data comes from the CMS Payroll-Based Journal report covering October 1 – December 31, 2025.

Total hours from contractors

3.4%

751 contractor hours this quarter

Registered Nurse: 3 Certified Nursing Assistant: 2 Licensed Practical Nurse: 1 Medical Director: 1

Staff by category

Q4 2025 · Oct 1 – Dec 31 More info This data comes from the CMS Payroll-Based Journal report covering October 1 – December 31, 2025.
Certified Nursing Assistant292319,47192100%9.2
Registered Nurse93123,35392100%9.5
Licensed Practical Nurse101113,16092100%9.4
Clinical Nurse Specialist3039756672%8.2
Speech Language Pathologist5057887278%6.4
Other Dietary Services Staff4047688997%7
Physical Therapy Aide6067557379%6.5
Dental Services Staff2026166065%8
Administrator1015126470%8
Nurse Practitioner1014725964%8
Dietitian1014185358%7.9
Physical Therapy Assistant5053616773%4.3
Respiratory Therapy Technician2022625964%4
Qualified Social Worker2021555560%2.7
Medical Director011312932%1.1
31 Certified Nursing Assistant
% of Days 100%
12 Registered Nurse
% of Days 100%
11 Licensed Practical Nurse
% of Days 100%
3 Clinical Nurse Specialist
% of Days 72%
5 Speech Language Pathologist
% of Days 78%
4 Other Dietary Services Staff
% of Days 97%
6 Physical Therapy Aide
% of Days 79%
2 Dental Services Staff
% of Days 65%
1 Administrator
% of Days 70%
1 Nurse Practitioner
% of Days 64%
1 Dietitian
% of Days 58%
5 Physical Therapy Assistant
% of Days 73%
2 Respiratory Therapy Technician
% of Days 64%
2 Qualified Social Worker
% of Days 60%
1 Medical Director
% of Days 32%

Penalties and fines

Federal penalties imposed by CMS for regulatory violations, including civil money penalties (fines) and denials of payment for new Medicare/Medicaid admissions.

Source: CMS Penalties Database

No penalties in the past 3 years

No civil money penalties or payment denials were reported in the last 3 years.

Quality of care over time

These measures show how residents usually do over time at this home, based on health outcomes and preventive care.

High-risk clinical events score Info A composite score based on pressure ulcers, falls with injury, weight loss, walking ability decline, and activities of daily living decline. 5.9
32% better than South Carolina average

South Carolina average: 8.7

Functional decline score Info A composite score based on activities of daily living decline, walking ability decline, and incontinence. 12.6
18% better than South Carolina average

South Carolina average: 15.5

Long-stay resident measures
Need for Help with Daily Activities Increased Info Percent of long-stay residents whose need for help with daily activities has increased 3.1%
76% better than South Carolina average

South Carolina average: 13.1%

Walking Ability Worsened Info Percent of long-stay residents whose ability to move independently worsened 3.7%
77% better than South Carolina average

South Carolina average: 16.2%

Low Risk Residents with Bowel/Bladder Incontinence Info Percent of low risk long-stay residents who lose control of their bowels or bladder 31.0%
82% worse than South Carolina average

South Carolina average: 17.0%

Falls with Major Injury Info Percent of long-stay residents experiencing one or more falls with major injury 10.6%
255% worse than South Carolina average

South Carolina average: 3.0%

High Risk Residents with Pressure Ulcers Info Percent of long-stay high risk residents with pressure ulcers 4.0%
35% better than South Carolina average

South Carolina average: 6.1%

Urinary Tract Infection Info Percent of long-stay residents with a urinary tract infection 0.8%
50% better than South Carolina average

South Carolina average: 1.6%

Lost Too Much Weight Info Percent of long-stay residents who lose too much weight 8.2%
32% worse than South Carolina average

South Carolina average: 6.2%

Depressive Symptoms Info Percent of long-stay residents who have depressive symptoms 0.0%
100% better than South Carolina average

South Carolina average: 2.8%

Antipsychotic Use Info Percent of long-stay residents who received an antipsychotic medication 1.8%
88% better than South Carolina average

South Carolina average: 14.5%

Pneumococcal Vaccine Info Percent of long-stay residents assessed and appropriately given the pneumococcal vaccine 100.0%
11% better than South Carolina average

South Carolina average: 90.5%

Influenza Vaccine Info Percent of long-stay residents assessed and appropriately given the seasonal influenza vaccine 100.0%
10% better than South Carolina average

South Carolina average: 90.6%

Short-stay resident measures
Pneumococcal Vaccine Info Percent of short-stay residents assessed and appropriately given the pneumococcal vaccine 99.4%
25% better than South Carolina average

South Carolina average: 79.5%

Antipsychotic medication increase Info Percent of short-stay residents who newly received an antipsychotic medication 0.3%
85% better than South Carolina average

South Carolina average: 1.7%

Influenza Vaccine Info Percent of short-stay residents assessed and appropriately given the seasonal influenza vaccine 96.3%
23% better than South Carolina average

South Carolina average: 78.0%

Breakdown by payment type

Medicare

36% of new residents, usually for short-term rehab.

Typical stay 18 days

Private pay

64% of new residents, often for short stays.

Typical stay 1 - 2 months

Facility Characteristics

Source: CMS Long-Term Care Facility Characteristics (Data as of Jan 2026)

Total residents 42
Medicare
5
11.9% of residents
Private pay or other
37
88.1% of residents
Programs & Services
Residents Group

Residents meet regularly to discuss policies, care quality, and activities

CCRC

Part of a Continuing Care Retirement Community offering multiple care levels

Active Resident Council

Organized group of residents that meets regularly to discuss facility policies, quality of life, and activities.

Finances and operations

Voluntary non-profit community
Operated by a church.
Home revenue
$9.1M
Operating deficit
-$46.6K
Voluntary non-profit community Operated by a church.
Home revenue
$9.1M Rank #93 / 116Revenue — State benchmarkedThis home is ranked 93rd out of 116 homes in South Carolina. Shows this facility's annual revenue compared to the South Carolina average. Higher revenue generally means more resources for staffing and capital — read alongside Payroll %.Click the rank badge to see the full State ranking.Click here to see the full State ranking.
Operating deficit
-$46.6K
Payroll costs Info The portion of the home's budget spent on staff, including nurses, caregivers, and other employees who support care and operations. Rank #99 / 116Payroll — State benchmarkedThis home is ranked 99th out of 116 homes in South Carolina. Shows total annual staff payroll benchmarked to the South Carolina average. Higher payroll investment relative to peers often signals better staffing and less reliance on cheaper contract labor.Click the rank badge to see the full State ranking.Click here to see the full State ranking.
$4.3M
46.9% of revenue Rank #64 / 116Payroll % — State benchmarkedThis home is ranked 64th out of 116 homes in South Carolina. Shows payroll as a percentage of revenue versus the South Carolina average. Well-run South Carolina facilities typically land around 53–64% — the top third Statewide. Below 25% may signal understaffing or heavy agency use — read with Staffing ratings.Click the rank badge to see the full State ranking.Click here to see the full State ranking.
Other operating costs Info All remaining costs needed to run the home, such as food, utilities, building maintenance, supplies and administrative expenses.
$4.9M
Total costs $9.2M

Who this home usually serves

TYPE OF STAY

Primarily short stays

Residents typically stay for brief periods, with frequent admissions and discharges throughout the year.

Places of interest near Sprenger Healthcare at Port Royal Assisted Living

Address 9508.5 miles from city center Info Estimated distance in miles from Port Royal's city center to Sprenger Healthcare at Port Royal Assisted Living's address, calculated via Google Maps.

Calculate Travel Distance to Sprenger Healthcare at Port Royal Assisted Living

Add your location

Address

Financial Assistance for
Nursing Home in South Carolina

Sprenger Healthcare at Port Royal Assisted Living is located in PORT ROYAL, South Carolina.
Here are the financial assistance programs available to residents in South Carolina.

Get Financial aid guidance

Community Long Term Care (CLTC)

SC Medicaid CLTC

Age 65+ or disabled
General South Carolina resident, Medicaid-eligible, nursing home-level care need.
Income Limits (2025) ~$2,829/month 300% FBR, individual
Asset Limits $2,000 (individual), $3,000 (couple).
SC

High rural demand; waitlists possible.

Benefits
Personal care (5-7 hours/day) Respite (240 hours/year) Adult day care ($60/day) Home modifications ($1,500 avg.)

South Carolina Respite Care Program

SC NFCSP Respite

Age Caregiver of someone 60+ (or with dementia)
General South Carolina resident.
Income Limits No strict limit; prioritizes low-income.
Asset Limits Not applicable.
SC

Limited slots; rural/urban balance.

Benefits
In-home respite (4-6 hours/day) Adult day care (~$60/day) Short-term facility care (up to 5 days)

Medicare Savings Program (MSP)

South Carolina Medicare Savings Program

Age 65+ or disabled
General SC resident, Medicare Part A/B.
Income Limits (2025) ~$2,510/month (QMB), ~$3,380/month (SLMB), ~$3,598/month (QI)—individual.
Asset Limits $9,430 (individual), $14,130 (couple).
SC

Three tiers; includes Extra Help for Part D; no waitlist.

Benefits
Covers Part B premiums ($174.70/month) Deductibles ($240/year) Copays (~20%)

VA Aid and Attendance (A&A) and Housebound Benefits

South Carolina VA Aid and Attendance/Housebound

Age 65+ or disabled veteran/spouse
General SC resident, wartime service, need for ADL help (A&A) or homebound.
Income Limits (2025) Net income < ~$1,984/month (veteran with dependent, A&A); pension offsets income.
Asset Limits ~$155,356 net worth limit
SC

High veteran population; supports rural/urban care needs.

Benefits
Cash (~$1,433-$2,642/month veteran, ~$951-$1,318 spouse) for care costs (e.g., in-home, assisted living)

Senior Farmers’ Market Nutrition Program (SFMNP)

South Carolina SFMNP

Age 60+
General SC resident, low-income.
Income Limits (2025) ~$2,322/month individual, 185% FPL
Asset Limits Not assessed.
SC

Vouchers (~$50/season); serves ~20,000 annually via 10 AAAs.

Benefits
Vouchers (~$50/season) for fresh produce at approved markets

Homestead Exemption Program

South Carolina Homestead Exemption

Age 65+ (or disabled/blind)
General SC resident 1+ year, homeowner.
Income Limits (2025) None; tax-based eligibility.
Asset Limits Not assessed; home-focused.
SC

Saves ~$500-$1,000/year avg.; applies to primary residence.

Benefits
Property tax exemption (~$50,000 value, ~$500-$1,000/year savings)

Elderly Simplified Application Project (ESAP)

South Carolina ESAP (SNAP for Seniors)

Age 60+
General SC resident, no earned income, not on SCCAP.
Income Limits (2025) ~$1,732/month 133% FPL, individual
Asset Limits $4,250 individual, higher than standard SNAP
SC

Simplified process; serves ~50,000 seniors annually.

Benefits
EBT card for food (~$100-$300/month based on income)

Frequently Asked Questions about Sprenger Healthcare at Port Royal Assisted Living

Who is the owner of Sprenger Healthcare at Port Royal Assisted Living?

The legal owner and operator of Sprenger Healthcare at Port Royal Assisted Living is Sprenger Healthcare Of Port Royal Inc.

What is the license number of Sprenger Healthcare at Port Royal Assisted Living?

According to SC state health department records, Sprenger Healthcare at Port Royal Assisted Living's license number is CRC-2016.

What is the best email address for Sprenger Healthcare at Port Royal Assisted Living?

The team at Sprenger Healthcare at Port Royal Assisted Living can be reached at [email protected].

Who is the administrator of Sprenger Healthcare at Port Royal Assisted Living?

Teresa Griffing is the administrator of Sprenger Healthcare at Port Royal Assisted Living.

How many beds does Sprenger Healthcare at Port Royal Assisted Living have?

Sprenger Healthcare at Port Royal Assisted Living has 59 beds.

Are there photos of Sprenger Healthcare at Port Royal Assisted Living?

Yes — there are 9 photos of Sprenger Healthcare at Port Royal Assisted Living in the photo gallery on this page.

What is the address of Sprenger Healthcare at Port Royal Assisted Living?

Sprenger Healthcare at Port Royal Assisted Living is located at 1810 RICHMOND AVE.

Guides for Better Senior Living

Care Cost Calculator: See Prices in Your Area

Nursing Home Data Explorer

Don’t Wait Too Long: 7 Red Flag Signs Your Parent Needs Assisted Living Now

The True Cost of Assisted Living in 2025 – And How Families Are Paying For It

Understanding Senior Living Costs: Pricing Models, Discounts & Financial Assistance

Explore Open Rooms
1 Contact details
2 What type of senior care service are you looking for?
3 What budget do you have in mind for senior care?
4 How soon do you need to find care?
5 Additional details

Thank you for your interest!

Our team will be in touch shortly to help with next steps.