


Total health inspections
15
Pennsylvania average 6.7
Last Health inspection on Jul 2025
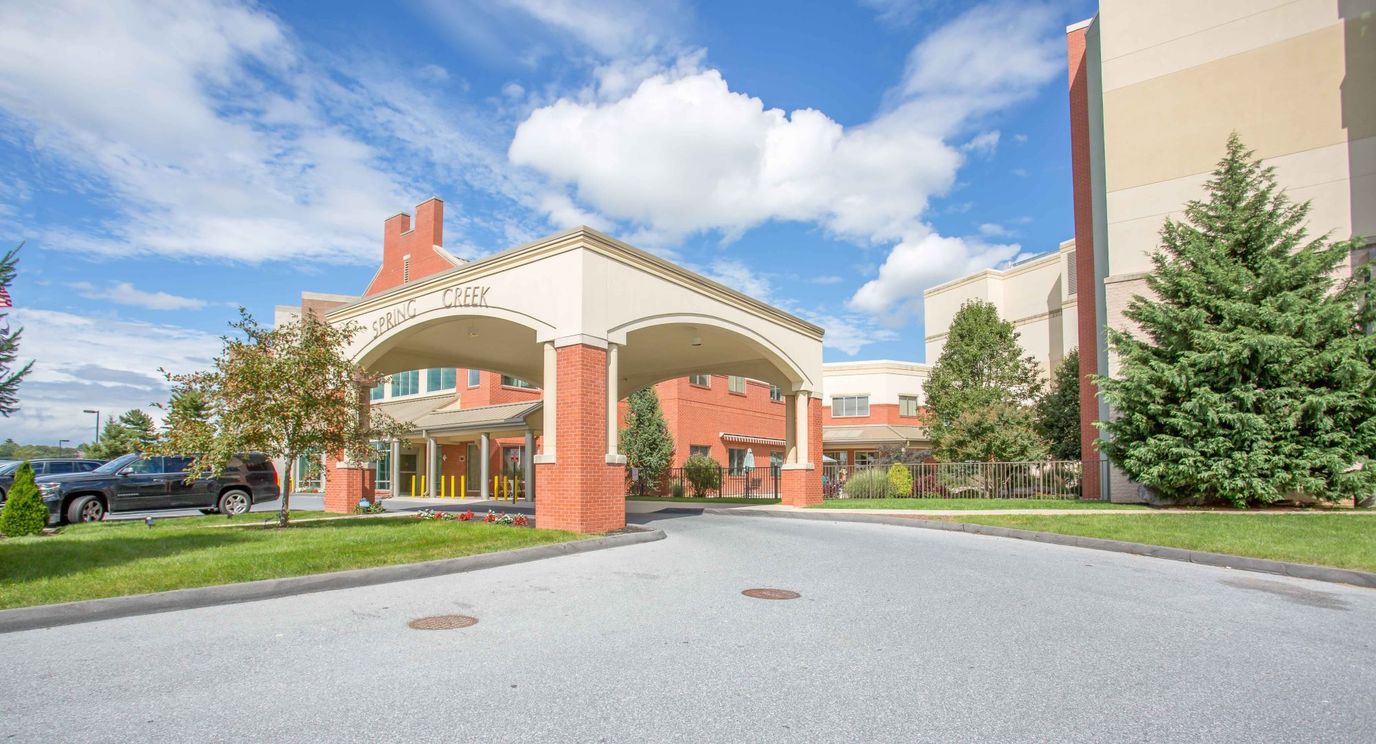

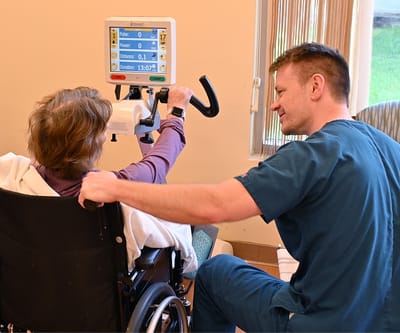

Discover Spring Creek Rehabilitation & Health Care Center nestled in the heart of Pennsylvania, expertly designed to cater to both short-term rehabilitation and long-term care needs. This exceptional gym boasts a highly skilled and competitive medical team, ensuring that residents receive the utmost care and attention. With a total of 400 beds, it stands as a pillar of healthcare excellence, conveniently located near downtown Harrisburg and close to major hospitals and healthcare providers. Accessibility is a breeze, with easy access from Interstate 83, facilitating seamless transitions for residents and their families.
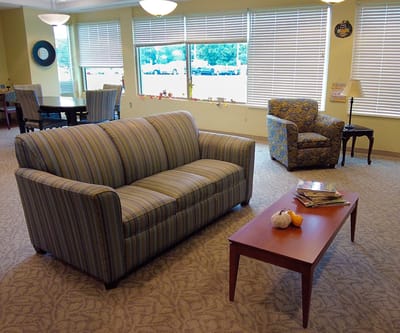
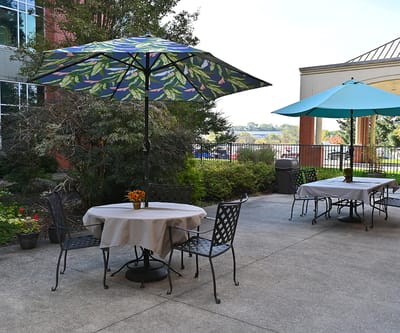
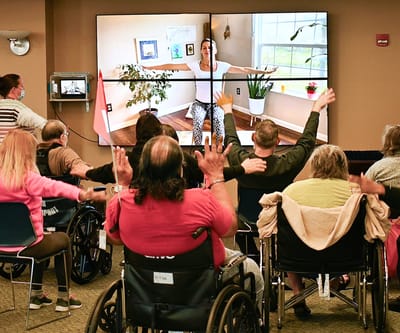
Beyond the exceptional medical services, an array of therapeutic recreation options await, designed to enhance well-being and foster a sense of joy and fulfillment. To elevate the experience further, comprehensive concierge services cater to every need, ensuring that residents can focus solely on their recovery and overall wellness. Recognizing the importance of seamless transportation, complementary services are also provided for dialysis appointments and physician visits, eliminating any logistical concerns. Moreover, the facility’s enchanting outdoor spaces serve as havens of tranquility, inviting residents to embrace the beauty of nature.
| Staff type | Hours / Day / Resident | vs state avg |
|---|---|---|
|
Registered Nurse (RN)
| 35m per day | ▼ 26% State avg: 47m per day · National avg: 41m per day |
|
LPN / LVN
| 47m per day | ▼ 14% State avg: 55m per day · National avg: 52m per day |
|
Nurse Aide
| 1h 47m per day | ▼ 19% State avg: 2h 12m per day · National avg: 2h 21m per day |
|
Weekend Total Nursing
| 2h 48m per day | ▼ 20% State avg: 3h 31m per day · National avg: 3h 26m per day |
|
Physical Therapist
| 3m per day | ▼ 51% State avg: 6m per day · National avg: 4m per day |
|
Weekend RN
| 22m per day | ▼ 34% State avg: 33m per day · National avg: 29m per day |
Key information about the people who lead and staff this community.
Pennsylvania average 6.7
Last Health inspection on Jul 2025
Pennsylvania average 31.3
Pennsylvania average 4.4
Health citations are formal notices following inspections when they fail to comply with safety and care standards.
25 of 47 citations resulted from standard inspections; 17 of 47 resulted from complaint investigations; and 5 of 47 came from combined inspections (standard and complaint).
Pennsylvania average: 0.3
Pennsylvania average: 0.6
Reporting period: October 1 – December 31, 2025 (Q4 2025). Source: CMS Payroll-Based Journal report.
Manages medical care and health needs.
Assists with medical care and medications.
Helps with daily care and mobility.
Total hours from contractors
7,215 contractor hours this quarter
| Certified Nursing Assistant | 131 | 9 | 140 | 59,879 | 92 | 100% | 8.5 |
| Licensed Practical Nurse | 51 | 6 | 57 | 25,357 | 92 | 100% | 9.5 |
| Registered Nurse | 26 | 9 | 35 | 15,528 | 92 | 100% | 9.7 |
| Other Dietary Services Staff | 12 | 0 | 12 | 3,783 | 92 | 100% | 7.7 |
| Clinical Nurse Specialist | 8 | 0 | 8 | 3,400 | 70 | 76% | 8 |
| Speech Language Pathologist | 8 | 0 | 8 | 2,906 | 79 | 86% | 7.6 |
| Physical Therapy Aide | 8 | 0 | 8 | 2,094 | 74 | 80% | 7.5 |
| Mental Health Service Worker | 7 | 0 | 7 | 2,032 | 65 | 71% | 8 |
| Respiratory Therapy Technician | 5 | 0 | 5 | 1,639 | 82 | 89% | 7.6 |
| Occupational Therapy Aide | 3 | 0 | 3 | 1,424 | 65 | 71% | 8 |
| Qualified Social Worker | 8 | 0 | 8 | 1,398 | 79 | 86% | 6.9 |
| Physical Therapy Assistant | 6 | 0 | 6 | 1,235 | 79 | 86% | 6.5 |
| RN Director of Nursing | 2 | 0 | 2 | 968 | 64 | 70% | 8 |
| Administrator | 2 | 0 | 2 | 936 | 64 | 70% | 8 |
| Nurse Practitioner | 1 | 0 | 1 | 448 | 56 | 61% | 8 |
| Therapeutic Recreation Specialist | 1 | 0 | 1 | 377 | 49 | 53% | 7.7 |
| Dietitian | 2 | 0 | 2 | 315 | 39 | 42% | 7.3 |
Includes penalties issued in 2024-2025
Federal penalties imposed by CMS for regulatory violations, including civil money penalties (fines) and denials of payment for new Medicare/Medicaid admissions.
Source: CMS Penalties Database (Data as of Jan 2026)
Pennsylvania average: $59K
Pennsylvania average: 2.1
Pennsylvania average: 0.2
Penalties are imposed by CMS for violations of federal nursing home regulations.
2 penalties in the past 3 years
Multiple penalties were reported in the last 3 years.
Last updated: Jan 2026
These measures show how residents usually do over time at this home, based on health outcomes and preventive care.
Pennsylvania average: 11.0
Pennsylvania average: 22.2
Pennsylvania average: 19.0%
Pennsylvania average: 21.1%
Pennsylvania average: 26.7%
Pennsylvania average: 3.2%
Pennsylvania average: 5.5%
Pennsylvania average: 1.8%
Pennsylvania average: 6.6%
Pennsylvania average: 5.5%
Pennsylvania average: 86.9%
Pennsylvania average: 93.5%
Pennsylvania average: 1.68
Pennsylvania average: 1.20
Pennsylvania average: 68.8%
Pennsylvania average: 1.5%
Pennsylvania average: 68.7%
Pennsylvania average: 23.1%
Pennsylvania average: 9.8%
Pennsylvania average: 0.8%
Pennsylvania average: 53.7%
Pennsylvania average: 50.6%
Quality measures are calculated from Minimum Data Set (MDS) assessments. For most measures, lower percentages indicate better care quality.
14% of new residents, usually for short-term rehab.
65% of new residents, often for short stays.
20% of new residents, often for long-term daily care.
Source: CMS Long-Term Care Facility Characteristics (Data as of Jan 2026)
Residents meet regularly to discuss policies, care quality, and activities
State-approved Nurse Aide Training and Competency Evaluation Program on-site
Organized group of residents that meets regularly to discuss facility policies, quality of life, and activities.
Data sourced from CMS Long-Term Care Facility Characteristics quarterly report. Payer mix reflects the current resident census by primary payment source.
Historical financial and operational data for Spring Creek Rehabilitation & Health Care Center from 2011–2023, based on CMS SNF Cost Reports.
Key figures below are for fiscal year ending in 12/2023.
Based on CMS SNF Cost Report for fiscal year ending in 12/2023.
Most residents stay long-term, while a smaller portion are admitted for short-term rehab.
Most new residents arrive under private pay (65% of admissions), and a typical private pay stay runs around 1 - 2 months.
Coverage residents most often arrive under.
Coverage residents most often leave under.
![]() 2.8 miles from city center
2.8 miles from city center
![]() Estimated distance in miles from Harrisburg's city center to Spring Creek Rehabilitation & Health Care Center's address, calculated via Google Maps.
— 2.43 miles to nearest hospital (UPMC Community Osteopathic)
Estimated distance in miles from Harrisburg's city center to Spring Creek Rehabilitation & Health Care Center's address, calculated via Google Maps.
— 2.43 miles to nearest hospital (UPMC Community Osteopathic)
Add your location
Info below is compiled from CMS reports & the PA Depts. of Human Services & Health, senior community websites & trusted data sources such as Walk Score & BBB.
Communities are listed from highest to lowest based on our ranking methodology.
| Homeland Center | NH HC HOS MC PC SNF | Harrisburg (Midtown) | 56
Facility
56
PA AVG
94
Rank
#421 / 553 |
83.9%
Facility
83.9%
PA AVG
68.1
Rank
#111 / 507 | +23% | 4.93
Facility
4.93
PA AVG
4.15
Rank
#49 / 181 | -46% | +19% | $0
Facility
$0
PA AVG
$61.2k
Rank
#1 / 184 | 93
Facility
93
PA AVG
83
Rank
#85 / 460 | 9
Facility
9
PA AVG
31.3
Rank
#55 / 179 | 3.0
Facility
3.0
PA AVG
4.4
Rank
#61 / 179 | - | 47 | - |
75
Facility
75
PA AVG
46
Rank
#110 / 667 | Evelyn Fry | $28.7MFiscal year ending 06/2024
Facility
$28.7MFiscal year ending 06/2024
PA AVG
$32.8M
Rank
#28 / 183 | $21.9MFiscal year ending 06/2024
Facility
$21.9MFiscal year ending 06/2024
PA AVG
$6.7M
Rank
#6 / 183 | 76.3%Fiscal year ending 06/2024
Facility
76.3%Fiscal year ending 06/2024
PA AVG
40%
Rank
#23 / 183 | 395475 | ||||
| Messiah Lifeways at Messiah Village | NH ADC AL IL MC RESC RC SNF | Mechanicsburg | 190
Facility
190
PA AVG
94
Rank
#21 / 553 |
78.4%
Facility
78.4%
PA AVG
68.1
Rank
#171 / 507 | +15% | 5.19
Facility
5.19
PA AVG
4.15
Rank
#31 / 181 | +9% | +25% | $8.0k
Facility
$8.0k
PA AVG
$61.2k
Rank
#123 / 184 | 89
Facility
89
PA AVG
83
Rank
#152 / 460 | 5
Facility
5
PA AVG
31.3
Rank
#28 / 179 | 1.7
Facility
1.7
PA AVG
4.4
Rank
#23 / 179 | - | 149 | A+ |
22
Facility
22
PA AVG
46
Rank
#520 / 667 | Messiah Lifeways | $46.8MFiscal year ending 06/2024
Facility
$46.8MFiscal year ending 06/2024
PA AVG
$32.8M
Rank
#9 / 183 | $19.5MFiscal year ending 06/2024
Facility
$19.5MFiscal year ending 06/2024
PA AVG
$6.7M
Rank
#13 / 183 | 41.6%Fiscal year ending 06/2024
Facility
41.6%Fiscal year ending 06/2024
PA AVG
40%
Rank
#153 / 183 | 395445 | ||||
| Capitol Rehabilitation & Healthcare Center | NH MC PC RC SNF | Harrisburg | 138
Facility
138
PA AVG
94
Rank
#73 / 553 |
95.1%
Facility
95.1%
PA AVG
68.1
Rank
#20 / 507 | +40% | 3.41
Facility
3.41
PA AVG
4.15
Rank
#164 / 181 | +3% | -18% | $0
Facility
$0
PA AVG
$61.2k
Rank
#1 / 184 | - | 35
Facility
35
PA AVG
31.3
Rank
#131 / 179 | 3.9
Facility
3.9
PA AVG
4.4
Rank
#100 / 179 | - | 131 | - |
33
Facility
33
PA AVG
46
Rank
#436 / 667 | Kristina Carlevale | $22.8MFiscal year ending 06/2024
Facility
$22.8MFiscal year ending 06/2024
PA AVG
$32.8M
Rank
#84 / 183 | $11.4MFiscal year ending 06/2024
Facility
$11.4MFiscal year ending 06/2024
PA AVG
$6.7M
Rank
#74 / 183 | 49.9%Fiscal year ending 06/2024
Facility
49.9%Fiscal year ending 06/2024
PA AVG
40%
Rank
#84 / 183 | 395372 | ||||
| The Gardens at Camp Hill | NH HOS MC RC SNF | Camp Hill | 95
Facility
95
PA AVG
94
Rank
#239 / 553 |
86.3%
Facility
86.3%
PA AVG
68.1
Rank
#88 / 507 | +27% | 3.99
Facility
3.99
PA AVG
4.15
Rank
#110 / 181 | +44% | -4% | $10.1k
Facility
$10.1k
PA AVG
$61.2k
Rank
#137 / 184 | - | 42
Facility
42
PA AVG
31.3
Rank
#143 / 179 | 5.3
Facility
5.3
PA AVG
4.4
Rank
#135 / 179 | 1 | 82 | - |
47
Facility
47
PA AVG
46
Rank
#319 / 667 | Hashtag Holdings LLC | $9.9MFiscal year ending 12/2023
Facility
$9.9MFiscal year ending 12/2023
PA AVG
$32.8M
Rank
#146 / 183 | $3.7MFiscal year ending 12/2023
Facility
$3.7MFiscal year ending 12/2023
PA AVG
$6.7M
Rank
#150 / 183 | 37%Fiscal year ending 12/2023
Facility
37%Fiscal year ending 12/2023
PA AVG
40%
Rank
#105 / 183 | 395123 | ||||
| Spring Creek Rehabilitation & Health Care Center | NH MC SNF | Harrisburg (East Harrisburg) | 404
Facility
404
PA AVG
94
Rank
#2 / 553 |
90.0%
Facility
90.0%
PA AVG
68.1
Rank
#60 / 507 | +32% | 3.82
Facility
3.82
PA AVG
4.15
Rank
#132 / 181 | -4% | -8% | $17.1k
Facility
$17.1k
PA AVG
$61.2k
Rank
#150 / 184 | - | 47
Facility
47
PA AVG
31.3
Rank
#151 / 179 | 3.1
Facility
3.1
PA AVG
4.4
Rank
#72 / 179 | 2 | 364 | A |
67
Facility
67
PA AVG
46
Rank
#157 / 667 | Steven Rosenzweig | $39.0MFiscal year ending 12/2023
Facility
$39.0MFiscal year ending 12/2023
PA AVG
$32.8M
Rank
#22 / 183 | $20.0MFiscal year ending 12/2023
Facility
$20.0MFiscal year ending 12/2023
PA AVG
$6.7M
Rank
#12 / 183 | 51.2%Fiscal year ending 12/2023
Facility
51.2%Fiscal year ending 12/2023
PA AVG
40%
Rank
#62 / 183 | 395074 |
Spring Creek Rehabilitation & Health Care Center is located in Harrisburg, Pennsylvania.
Here are the financial assistance programs available to residents in Pennsylvania.
Spring Creek Rehabilitation & Health Care Center is in the East Harrisburg neighborhood of Harrisburg.
Spring Creek Rehabilitation & Health Care Center has a walk score of 67. Moderately walkable. Some errands can be accomplished on foot, with a mix of nearby amenities.
Spring Creek Rehabilitation & Health Care Center's occupancy is 84.4%.
Spring Creek Rehabilitation & Health Care Center has been operating for approximately 19 years, based on available licensing and registration records.
No, Spring Creek Rehabilitation & Health Care Center has a no-pet policy.
Spring Creek Rehabilitation & Health Care Center is registered as a for-profit in PA.
Yes — there are 11 photos of Spring Creek Rehabilitation & Health Care Center in the photo gallery on this page.
Care Cost Calculator: See Prices in Your Area
Nursing Home Data Explorer
Don’t Wait Too Long: 7 Red Flag Signs Your Parent Needs Assisted Living Now
The True Cost of Assisted Living in 2025 – And How Families Are Paying For It
Understanding Senior Living Costs: Pricing Models, Discounts & Financial Assistance


