The Gardens at West Shore
Nursing Home, Memory Care, Palliative Care & Respite Care · Harrisburg, PA
CMS overall rating Info CMS (the Centers for Medicare & Medicaid Services) is the federal agency that rates nursing home quality. Its Overall Rating runs from 1 to 5 stars, combining health inspections, staffing, and quality measures, with inspections weighted most heavily.

The Gardens at West Shore

Nursing Home, Memory Care, Palliative Care & Respite Care · Harrisburg, PA
CMS overall rating Info CMS (the Centers for Medicare & Medicaid Services) is the federal agency that rates nursing home quality. Its Overall Rating runs from 1 to 5 stars, combining health inspections, staffing, and quality measures, with inspections weighted most heavily.
Calculator: See prices in your area
The Gardens at West Shore accepts Medicare, Medicaid, and private pay.

Overview of The Gardens at West Shore

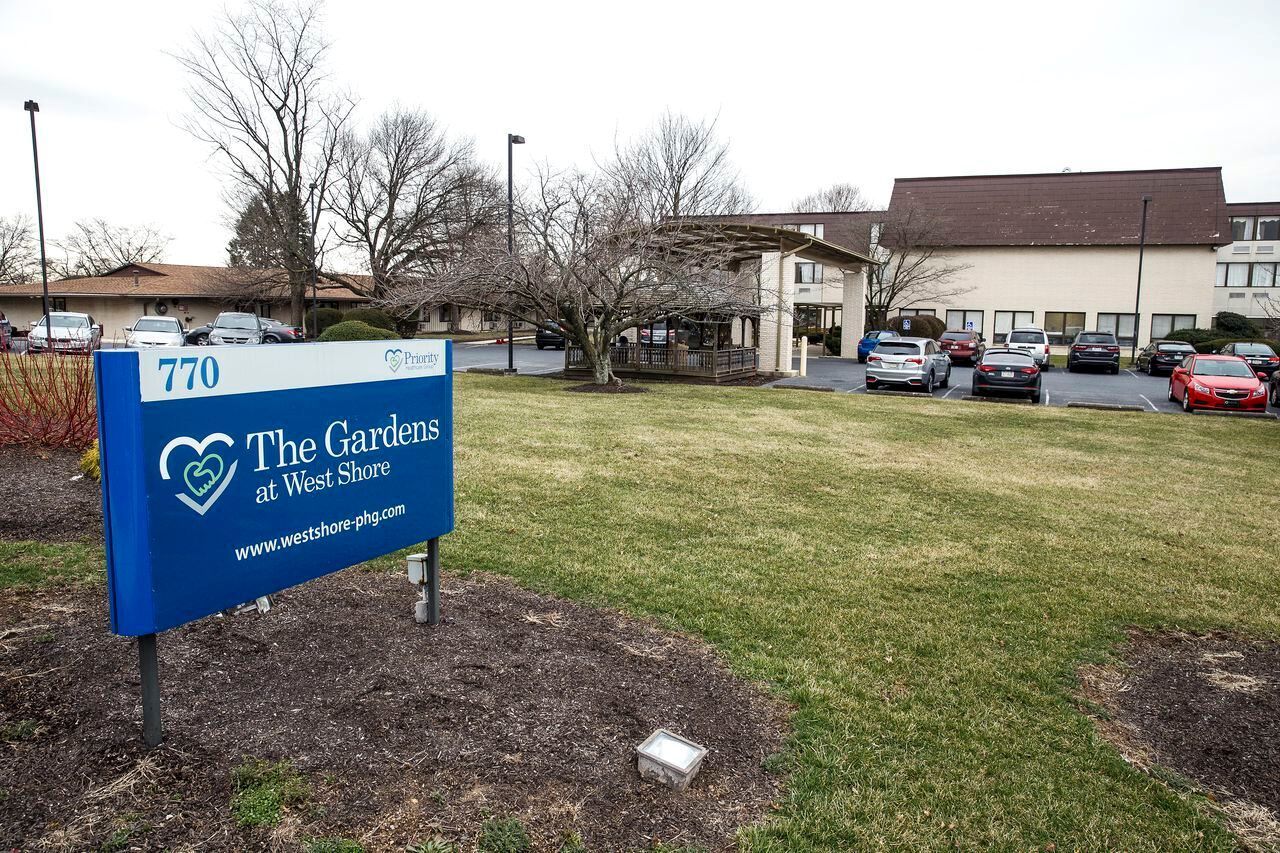
Situated in close proximity to Geisinger Holy Spirit Hospital, The Gardens at West Shore exists as a distinguished senior home in the picturesque region of Camp Hill, Pennsylvania, offering a wide range of unparalleled services. The home prides itself on delivering unparalleled post-acute care and short-term rehabilitation services. The facility’s proficient team specializes in administering personalized therapies tailored to address the distinct needs of each individual. Additionally, the facility features a secure memory care unit dedicated to providing specialized care for patients with memory impairments.
For seniors looking for a memory care facility that considers a wide variety of insurances, The Gardens at West Shore accepts medicare and medicaid. This commitment to inclusivity ensures that individuals from diverse backgrounds can access and benefit from the facility’s exceptional services. Beyond the standard offerings, The Gardens at West Shore excels in the field of psychiatric rounding, ensuring comprehensive mental health support for residents. The facility’s meticulously planned activities are thoughtfully designed to enhance residents’ quality of life, fostering a sense of purpose and joy.

(717) 763-7070

Quality ratings

Measured by Centers for Medicare & Medicaid Services (CMS)

Overall rating Info The Overall CMS Rating combines results from health inspections, staffing levels and quality measures. Health inspections carry the most weight. Staffing and quality scores can increase or decrease the final rating based on performance compared to state and national standards.
▼ 66.6% Below PA avg. ▼ 66.6% Below PA avg.PA average: 3.0Click the badge to see the full State ranking.Click here to see the full State ranking.
Health Inspection Info Based on the results of the facility's three most recent standard inspections and any complaint investigations. CMS reviews the number, scope, and severity of deficiencies, with more recent findings weighted more heavily.
▼ 64.3% Below PA avg. ▼ 64.3% Below PA avg.PA average: 2.8Click the badge to see the full State ranking.Click here to see the full State ranking.
Staffing Info Measures average nursing staff hours per resident per day, including Registered Nurses (RNs) and total nursing staff. Ratings are adjusted based on the level of care residents require and are compared to state and national benchmarks.
▲ 17.9% Above PA avg. ▲ 17.9% Above PA avg.PA average: 3.4Click the badge to see the full State ranking.Click here to see the full State ranking.
Quality Measures Info Based on clinical and physical health indicators reported to CMS, such as hospital readmissions, falls, pressure ulcers, and improvements in mobility. These measures reflect how well residents' health needs are being managed.
▼ 11.6% Below PA avg. ▼ 11.6% Below PA avg.PA average: 3.4Click the badge to see the full State ranking.Click here to see the full State ranking.

Staffing hours breakdown

Info Daily nursing hours per resident by staff type, reported to CMS. Higher is generally better — compare this facility to state and national averages to see where staffing stands.

Hours per resident per day — compared to Pennsylvania state averages

Total nursing care / resident Info This home is ranked 99th out of 207 homes in Pennsylvania for nurse hours. Total adjusted nursing hours per resident per day, combining RN, LPN, and aide time. CMS adjusts this for case-mix so facilities can be fairly compared.
4h 11m per day
Rank #99 / 207Nurse hours — State benchmarkedThis home is ranked 99th out of 207 homes in Pennsylvania. Shows adjusted nurse hours per resident per day benchmarked to the Pennsylvania average, with a ranking across 207 Pennsylvania facilities. More hours mean more direct care. The national average is about 3.5 hrs; below 3.0 is a red flag.Ranking totals vary by category as each rank only includes facilities that report data for that metric. Homes missing that data point aren't included in the ranking.Click the rank badge to see the full State ranking.Click here to see the full State ranking.
This facility Pennsylvania avg (4h 9m per day)
vs Pennsylvania avg
+1%

6 of 6 metrics below state avg

Staff typeHours / Day / Residentvs state avg
Registered Nurse (RN) Info RNs hold the highest nursing license and can assess residents, interpret test results, and direct care plans. More RN hours per day often signals stronger clinical oversight and faster response to health changes. 41m per day ▼ 12% State avg: 47m per day · National avg: 41m per day
LPN / LVN Info Licensed Practical Nurses (LPNs) or Licensed Vocational Nurses (LVNs) deliver routine hands-on care — medication administration, wound dressing, and monitoring vital signs. They work under RN supervision and make up a large share of daily bedside care. 28m per day ▼ 50% State avg: 55m per day · National avg: 52m per day
Nurse Aide Info Certified Nurse Aides (CNAs) provide the most direct day-to-day assistance: bathing, dressing, feeding, and mobility. Nurse aide hours are typically the largest staffing category and directly affect residents' quality of life. 2h 4m per day ▼ 6% State avg: 2h 12m per day · National avg: 2h 21m per day
Weekend Total Nursing Info Combined nursing hours (RN + LPN + Nurse Aide) per resident per day on weekends. Staffing often drops on weekends — this figure reveals whether the facility maintains adequate coverage outside of weekday hours. 3h 0m per day ▼ 15% State avg: 3h 31m per day · National avg: 3h 26m per day
Physical Therapist Info Hours per resident per day provided by licensed Physical Therapists (PTs) or PT Assistants. PT services help residents recover mobility after injury or illness and are especially important for post-acute (short-stay) rehabilitation. 3m per day ▼ 50% State avg: 6m per day · National avg: 4m per day
Weekend RN Info Registered nurse hours specifically on weekends. Facilities sometimes reduce RN presence on Saturdays and Sundays — a low weekend RN figure compared to weekday hours can indicate reduced clinical oversight when most administrative staff are absent. 31m per day ▼ 5% State avg: 33m per day · National avg: 29m per day

Capacity and availability

Avg. Length of Stay
257 days
Bed community size
309-bed community Rank #5 / 555Bed count — State benchmarkedThis home is ranked 5th out of 555 homes in Pennsylvania. Shows this facility's certified or reported bed count compared to other Pennsylvania facilities. Larger communities may offer more amenities, programs, and on-site services for residents and families.Ranking totals vary by category as each rank only includes facilities that report data for that metric. Homes missing that data point aren't included in the ranking.Click the rank badge to see the full State ranking.Click here to see the full State ranking.
A large-scale community that may provide a wide range of amenities, services, and structured programs.
Walk Score
Walk Score: 40 / 100 Rank #383 / 668Walk Score — State benchmarkedThis home is ranked 383rd out of 668 homes in Pennsylvania. Shows how walkable this facility's neighborhood is compared to the average Walk Score across Pennsylvania facilities. Higher scores benefit residents, families, and staff.Ranking totals vary by category as each rank only includes facilities that report data for that metric. Homes missing that data point aren't included in the ranking.Click the rank badge to see the full State ranking.Click here to see the full State ranking.
Somewhat walkable. A few nearby services may be reachable on foot, but most trips require transportation.
BBB Rating
BBB Rating: F (Not Accredited)
An independent rating from the Better Business Bureau based on factors such as complaint history, transparency, and business practices.
How BBB ratings work

About this community

License Details

CMS Certification Number395223

Contact The Gardens at West Shore

Inspection History

In Pennsylvania, the Department of Human Services (for assisted living facilities) and the Department of Health (for nursing homes) conduct unannounced inspections to verify adherence to state regulations.

Since 2023 · 3 years of data 60 citations
We don't publish a score for nursing homes with fewer than three inspections on record. This would unfairly reward providers with limited inspection history or those that have not been operating long enough to be cited.

Inspection score unavailable

Not enough inspection history to generate a score.

Average score for Pennsylvania nursing homes: B 83/100

Inspection score not available. Not enough inspection history to score against the Pennsylvania benchmark.

Inspection Scorecard Info This scorecard compares key inspection, citation, and complaint metrics at this facility against the Pennsylvania state average. Metrics rated ≥15% worse than average are highlighted in red; those ≥15% better are highlighted in green.

Since 2023 vs. Pennsylvania state average
Overall vs. PA average 0 Worse No metrics in this bucket. 2 Better Metrics better than Pennsylvania average:
• Total citations (5% below)
• Citations per year (5% below)
Latest Inspection December 26, 2025 Complaint Investigation

Citations Info Citations are formal regulatory issues recorded during state inspections.

This FacilityPA Averagevs. PA Avg
Total citations Info Formal regulatory issues recorded by inspectors across all inspection types. 6063 This facility has 5% fewer total citations than a typical Pennsylvania nursing home (60 vs. PA avg 63).↓ 5% better Rank #1 / 482 Total citations — State benchmarked This home is ranked 1st out of 482 homes in Pennsylvania. Shows this facility's total citations compared to the Pennsylvania average among 482 comparable communities in the ranking pool. Ranking totals vary by category as each rank only includes facilities that report data for that metric. Homes missing that data point aren't included in the ranking.
Citations per year Info Average citations per year since 2023. 2021 This facility has 5% fewer citations per year than a typical Pennsylvania nursing home (20 vs. PA avg 21).↓ 5% better

Inspection Reports Summary Info An editor-reviewed summary of the themes and findings across this facility's recent inspection reports.

  • December 26, 2025 complaint investigation substantiated mold, mildew, and foul odor in one of three shower rooms, with facility acknowledging and committing to immediate cleaning.
  • August 7, 2025 annual inspection found eight deficiencies including call light inaccessibility, psychotropic medication misuse, inaccurate assessments, incomplete care plans, inadequate care and kitchen safety violations.
  • February 22, 2024 complaint investigation substantiated neglect for Resident 4 left in wet briefs and infection from failure to provide catheter care for Resident 2 causing actual harm.

Health Inspection History

Inspections since 2023
Total health inspections 17

Pennsylvania average 6.7


Last Health inspection on Aug 2025

Total health citations
65 Rank #196 / 207Health citations — State benchmarkedThis home is ranked 196th out of 207 homes in Pennsylvania. Shows this facility's total health deficiency citations benchmarked to the Pennsylvania State average, with a ranking across all 207 PA facilities. Lower citation counts earn a better rank.Ranking totals vary by category as each rank only includes facilities that report data for that metric. Homes missing that data point aren't included in the ranking.Click the rank badge to see the full State ranking.Click here to see the full State ranking.

Pennsylvania average 31.3

Citations per inspection
3.82 Rank #109 / 207Citations per inspection — State benchmarkedThis home is ranked 109th out of 207 homes in Pennsylvania. Shows average deficiency citations per CMS inspection for this facility versus the Pennsylvania mean across 207 facilities with citation data. Lower is better.Ranking totals vary by category as each rank only includes facilities that report data for that metric. Homes missing that data point aren't included in the ranking.Click the rank badge to see the full State ranking.Click here to see the full State ranking.

Pennsylvania average 4.4


Health citations are formal notices following inspections when they fail to comply with safety and care standards.

35 of 65 citations resulted from standard inspections; 27 of 65 resulted from complaint investigations; and 3 of 65 came from combined inspections (standard and complaint).

Breakdown of citation severity (last 3 years)
Critical health citations
2
567% worse than Pennsylvania average

Pennsylvania average: 0.3


Serious health citations
2
233% worse than Pennsylvania average

Pennsylvania average: 0.6

2 critical citations Pennsylvania average: 0.3

2 serious citations Pennsylvania average: 0.6

61 moderate citations Pennsylvania average: 29.5

0 minor citations Pennsylvania average: 0.8
Citations history (last 3 years)
Abuse/Neglect moderate citation Aug 07, 2025
Corrected

Nutrition moderate citation Aug 07, 2025
Corrected

Pharmacy moderate citation Aug 07, 2025
Corrected

Quality of Care moderate citation Aug 07, 2025
Corrected

Staffing Data

Reporting period: October 1 – December 31, 2025 (Q4 2025). Source: CMS Payroll-Based Journal report.

Total staff 192
Employees 164
Contractors 28
Staff to resident ratio 1.05 : 1
43% fewer staff per resident than Pennsylvania average
Pennsylvania average ratio: 1.83 : 1 Pennsylvania average ratio: 1.83 : 1See full Pennsylvania ranking
Avg staff/day 77
Average shift 8.6 hours
10% better than Pennsylvania average
Pennsylvania average: 7.8 hours Pennsylvania average shift: 7.8 hoursSee full Pennsylvania ranking
Total staff hours (quarter) 60,890

Nursing staff breakdown

Q4 2025 · Oct 1 – Dec 31 More info This data comes from the CMS Payroll-Based Journal report covering October 1 – December 31, 2025.
Registered Nurse

Manages medical care and health needs.

RN Staff Info All 23 RN Staff are full-time employees. No contractors work on this role. 23
Average shift length Info Average shift length. Calculated as total hours divided by days worked and average staff per day. 9.1 hours
Licensed Practical Nurse

Assists with medical care and medications.

LPN Staff Info 36 total: 21 full-time employees and 15 contractors. 36
Average shift length Info Average shift length. Calculated as total hours divided by days worked and average staff per day. 8.3 hours
Certified Nursing Assistant

Helps with daily care and mobility.

CNA Staff Info 98 total: 87 full-time employees and 11 contractors. 98
Average shift length Info Average shift length. Calculated as total hours divided by days worked and average staff per day. 8.8 hours

Contractor staffing

Q4 2025 · Oct 1 – Dec 31 More info This data comes from the CMS Payroll-Based Journal report covering October 1 – December 31, 2025.

Total hours from contractors

1%

614 contractor hours this quarter

Licensed Practical Nurse: 15 Certified Nursing Assistant: 11 Medical Director: 1 Occupational Therapy Assistant: 1

Staff by category

Q4 2025 · Oct 1 – Dec 31 More info This data comes from the CMS Payroll-Based Journal report covering October 1 – December 31, 2025.
Certified Nursing Assistant87119834,70992100%8.8
Registered Nurse230239,25492100%9.1
Licensed Practical Nurse2115366,83892100%8.3
Other Dietary Services Staff5052,75992100%8.6
Clinical Nurse Specialist6061,9206470%8
RN Director of Nursing2028946773%7.6
Mental Health Service Worker2028896470%8
Respiratory Therapy Technician5058476571%7.6
Administrator1014966267%8
Dietitian1014966267%8
Nurse Practitioner1014565762%8
Qualified Social Worker3034045762%7.1
Physical Therapy Assistant3033914448%8.7
Dental Services Staff1012163336%6.5
Physical Therapy Aide2021162325%4
Occupational Therapy Aide1011081415%7.7
Occupational Therapy Assistant01153910%5.8
Medical Director011463942%1.2
98 Certified Nursing Assistant
% of Days 100%
23 Registered Nurse
% of Days 100%
36 Licensed Practical Nurse
% of Days 100%
5 Other Dietary Services Staff
% of Days 100%
6 Clinical Nurse Specialist
% of Days 70%
2 RN Director of Nursing
% of Days 73%
2 Mental Health Service Worker
% of Days 70%
5 Respiratory Therapy Technician
% of Days 71%
1 Administrator
% of Days 67%
1 Dietitian
% of Days 67%
1 Nurse Practitioner
% of Days 62%
3 Qualified Social Worker
% of Days 62%
3 Physical Therapy Assistant
% of Days 48%
1 Dental Services Staff
% of Days 36%
2 Physical Therapy Aide
% of Days 25%
1 Occupational Therapy Aide
% of Days 15%
1 Occupational Therapy Assistant
% of Days 10%
1 Medical Director
% of Days 42%

Penalties and fines

Includes penalties issued in 2024

Federal penalties imposed by CMS for regulatory violations, including civil money penalties (fines) and denials of payment for new Medicare/Medicaid admissions.

Source: CMS Penalties Database (Data as of Jan 2026)

Total fines amount $68K Rank #191 / 210Federal fines — State benchmarkedThis home is ranked 191st out of 210 homes in Pennsylvania. Shows this facility's cumulative CMS federal fine dollars versus the Pennsylvania average among facilities with fines, and where it ranks among 210 facilities in the pool. Lower total dollars mean a better rank.Ranking totals vary by category as each rank only includes facilities that report data for that metric. Homes missing that data point aren't included in the ranking.Click the rank badge to see the full State ranking.Click here to see the full State ranking.
14% higher than Pennsylvania average

Pennsylvania average: $59K

Number of fines 3
45% more fines than Pennsylvania average

Pennsylvania average: 2.1

Payment Denials Info Serious action where Medicare and/or Medicaid temporarily stops payments for new residents until issues are fixed. 0
100% fewer payment denials than Pennsylvania average

Pennsylvania average: 0.2

Fines amount comparison
This facility $68K
Pennsylvania average $59K
Penalty History

Penalties are imposed by CMS for violations of federal nursing home regulations.

1 penalty in the past 3 years

Feb 22, 2024 · $23K

Civil Money Penalty Info Fines imposed for noncompliance, which can be assessed per day or per instance of violation. Feb 22, 2024
$23K

Last updated: Jan 2026

Quality of care over time

These measures show how residents usually do over time at this home, based on health outcomes and preventive care.

High-risk clinical events score Info A composite score based on pressure ulcers, falls with injury, weight loss, walking ability decline, and activities of daily living decline. 9.7
12% better than Pennsylvania average

Pennsylvania average: 11.0

Functional decline score Info A composite score based on activities of daily living decline, walking ability decline, and incontinence. 20.7
7% better than Pennsylvania average

Pennsylvania average: 22.2

Long-stay resident measures
Above average Pennsylvania avg: 3.7 Info CMS star rating based on long-stay quality measure performance. 5 stars = significantly above average, 1 star = significantly below average.
Need for Help with Daily Activities Increased Info Percent of long-stay residents whose need for help with daily activities has increased 15.8%
17% better than Pennsylvania average

Pennsylvania average: 19.0%

Walking Ability Worsened Info Percent of long-stay residents whose ability to move independently worsened 17.3%
18% better than Pennsylvania average

Pennsylvania average: 21.1%

Low Risk Residents with Bowel/Bladder Incontinence Info Percent of low risk long-stay residents who lose control of their bowels or bladder 29.2%
9% worse than Pennsylvania average

Pennsylvania average: 26.7%

Falls with Major Injury Info Percent of long-stay residents experiencing one or more falls with major injury 2.2%
31% better than Pennsylvania average

Pennsylvania average: 3.2%

High Risk Residents with Pressure Ulcers Info Percent of long-stay high risk residents with pressure ulcers 3.1%
45% better than Pennsylvania average

Pennsylvania average: 5.5%

Urinary Tract Infection Info Percent of long-stay residents with a urinary tract infection 2.8%
60% worse than Pennsylvania average

Pennsylvania average: 1.8%

Lost Too Much Weight Info Percent of long-stay residents who lose too much weight 10.2%
54% worse than Pennsylvania average

Pennsylvania average: 6.6%

Depressive Symptoms Info Percent of long-stay residents who have depressive symptoms 1.1%
80% better than Pennsylvania average

Pennsylvania average: 5.5%

Antipsychotic Use Info Percent of long-stay residents who received an antipsychotic medication 21.4%
25% worse than Pennsylvania average

Pennsylvania average: 17.1%

Pneumococcal Vaccine Info Percent of long-stay residents assessed and appropriately given the pneumococcal vaccine 36.5%
58% worse than Pennsylvania average

Pennsylvania average: 86.9%

Influenza Vaccine Info Percent of long-stay residents assessed and appropriately given the seasonal influenza vaccine 89.3%
In line with Pennsylvania average

Pennsylvania average: 93.5%

Short-stay resident measures
Significantly below average Pennsylvania avg: 3.2 Info CMS star rating based on short-stay quality measure performance. 5 stars = much above average, 1 star = much below average.
Pneumococcal Vaccine Info Percent of short-stay residents assessed and appropriately given the pneumococcal vaccine 6.9%
90% worse than Pennsylvania average

Pennsylvania average: 68.8%

Antipsychotic medication increase Info Percent of short-stay residents who newly received an antipsychotic medication 2.4%
52% worse than Pennsylvania average

Pennsylvania average: 1.5%

Influenza Vaccine Info Percent of short-stay residents assessed and appropriately given the seasonal influenza vaccine 8.5%
88% worse than Pennsylvania average

Pennsylvania average: 68.7%

Re-hospitalized after SNF stay Info Percentage of short-stay residents who were re-hospitalized after their nursing home admission. 33.5%
45% worse than Pennsylvania average

Pennsylvania average: 23.1%

Emergency department visits Info Percentage of short-stay residents who had an outpatient emergency department visit. 13.6%
39% worse than Pennsylvania average

Pennsylvania average: 9.8%

Falls with major injury Info Percentage of SNF residents who experience falls with major injury during their stay. 2.7%
251% worse than Pennsylvania average

Pennsylvania average: 0.8%

Ability to care for self at discharge Info Percentage of residents at or above expected ability to care for themselves at discharge. 27.6%
49% worse than Pennsylvania average

Pennsylvania average: 53.7%

Successful return to home or community Info Rate of successful return to home or community from a skilled nursing facility. 37.2%
26% worse than Pennsylvania average

Pennsylvania average: 50.6%

Breakdown by payment type

Medicare

67% of new residents, usually for short-term rehab.

Typical stay 11 days

Private pay

4% of new residents, often for short stays.

Typical stay 1 years

Medicaid

29% of new residents, often for long-term daily care.

Typical stay 2 - 3 years

Facility Characteristics

Source: CMS Long-Term Care Facility Characteristics (Data as of Jan 2026)

Total residents 183
Medicare
1
0.5% of residents
Medicaid
151
82.5% of residents
Private pay or other
31
16.9% of residents
Programs & Services
Residents Group

Residents meet regularly to discuss policies, care quality, and activities

Active Resident Council

Organized group of residents that meets regularly to discuss facility policies, quality of life, and activities.

Finances and operations

Based on CMS SNF Cost Report for fiscal year ending in 12/2023.

Voluntary non-profit community
Operated by a church.
Net patient revenue Info Net patient revenue — what the home actually collects for resident care, after contractual allowances, bad debt and discounts are subtracted from its gross charges (CMS cost report, Worksheet G-3). It covers resident care only; money the home earns from other sources is shown separately as "Other income."
$20.0M
Net patient income Info Net patient income: net patient revenue minus the home's total operating expenses. A positive figure means it earns more from resident care than it spends to deliver it; a negative figure means the opposite. It excludes non-operating "other income."
$365.7K
Voluntary non-profit community Operated by a church.
Net patient revenue Info Net patient revenue — what the home actually collects for resident care, after contractual allowances, bad debt and discounts are subtracted from its gross charges (CMS cost report, Worksheet G-3). It covers resident care only; money the home earns from other sources is shown separately as "Other income."
$20.0M Rank #62 / 209Revenue — State benchmarkedThis home is ranked 62nd out of 209 homes in Pennsylvania. Shows this facility's annual revenue compared to the Pennsylvania average. Higher revenue generally means more resources for staffing and capital — read alongside Payroll %.Ranking totals vary by category as each rank only includes facilities that report data for that metric. Homes missing that data point aren't included in the ranking.Click the rank badge to see the full State ranking.Click here to see the full State ranking.
Net patient income Info Net patient income: net patient revenue minus the home's total operating expenses. A positive figure means it earns more from resident care than it spends to deliver it; a negative figure means the opposite. It excludes non-operating "other income."
$365.7K
Other income Info Money the home earns outside of resident care — such as investments, grants, rentals and other non-operating sources (CMS cost report, Worksheet G-3). It is tracked separately from net patient revenue: it is not part of that figure, and it is not included in net patient income.
$702.2K
Payroll costs Info Staff salaries plus wage-related costs — benefits such as payroll taxes, health insurance and retirement — from the home's own accounting records (CMS cost report, Worksheet A). Contract or agency labor is counted separately, under other operating costs. Rank #80 / 209Payroll — State benchmarkedThis home is ranked 80th out of 209 homes in Pennsylvania. Shows total annual staff payroll benchmarked to the Pennsylvania average. Higher payroll investment relative to peers often signals better staffing and less reliance on cheaper contract labor.Ranking totals vary by category as each rank only includes facilities that report data for that metric. Homes missing that data point aren't included in the ranking.Click the rank badge to see the full State ranking.Click here to see the full State ranking.
$7.5M 37.3% of net patient revenue Info Payroll as a share of revenue: staff salaries and wage-related benefits divided by net patient revenue. A higher figure means more of each revenue dollar goes to staff pay. Rank #163 / 209Payroll % — State benchmarkedThis home is ranked 163rd out of 209 homes in Pennsylvania. Shows payroll as a percentage of revenue versus the Pennsylvania average. Well-run Pennsylvania facilities typically land around 53–61% — the top third Statewide. Below 25% may signal understaffing or heavy agency use — read with Staffing ratings.Ranking totals vary by category as each rank only includes facilities that report data for that metric. Homes missing that data point aren't included in the ranking.Click the rank badge to see the full State ranking.Click here to see the full State ranking.
Other operating costs Info Everything it costs to run the home apart from payroll — food, utilities, supplies, maintenance, contract labor and administration. Calculated as total operating expense minus payroll (staff salaries and wage-related benefits).
$12.2M
Total costs Info The home's total operating expense for the year — all the costs of running it, salaries included (CMS cost report, Worksheet G-3).
$19.7M

Who this home usually serves

TYPE OF STAY

Mostly short-term rehab stays

Most residents typically stay for a few weeks or months before returning home or moving on.

Most new residents arrive under Medicare (67% of admissions), and a typical Medicare stay runs around 11 days.

Admissions
240 total

Coverage residents most often arrive under.

Medicare 67%
Private pay 4%
Medicaid 29%
Discharges
256 total

Coverage residents most often leave under.

Medicare 18%
Private pay 32%
Medicaid 51%

Places of interest near The Gardens at West Shore

Address 3.0 miles from city center Info Estimated distance in miles from Camp Hill's city center to The Gardens at West Shore's address, calculated via Google Maps. — 0.18 miles to nearest hospital (Select Specialty Hospital - Camp Hill)

Calculate Travel Distance to The Gardens at West Shore

Add your location

Address

Compare Nursing Home around Harrisburg

The information below is reported by the Pennsylvania Department of Human Services and Department of Health.

5 facilities compared · CMS & PA Dept. of Health data

Messiah Lifeways at Messiah Village
NH
ADC
AL
IL
MC
NC
RC
Mechanicsburg
190
Facility 190
PA AVG 94
Rank #21 / 555
78.4%
Facility 78.4%
PA AVG 78.7%
Rank #172 / 518
0%
5.19
Facility 5.19
PA AVG 4.15
Rank #32 / 207
+9%+25%
$8.0k
Facility $8.0k
PA AVG $61.2k
Rank #142 / 210
89
Facility 89
PA AVG 83
Rank #152 / 460
5
Facility 5
PA AVG 31.3
Rank #31 / 207
1.7
Facility 1.7
PA AVG 4.4
Rank #27 / 207
-149A+
22
Facility 22
PA AVG 46
Rank #521 / 668
Messiah Lifeways
$46.8M
Facility $46.8M
PA AVG $32.8M
Rank #11 / 209
$19.5M
Facility $19.5M
PA AVG $6.7M
Rank #15 / 209
41.6%
Facility 41.6%
PA AVG 40%
Rank #176 / 209
395445
Homeland Center
NH
HC
MC
NC
PC
Harrisburg (Midtown)
56
Facility 56
PA AVG 94
Rank #422 / 555
83.9%
Facility 83.9%
PA AVG 78.7%
Rank #108 / 518
+7%
4.93
Facility 4.93
PA AVG 4.15
Rank #52 / 207
-46%+19%
$0
Facility $0
PA AVG $61.2k
Rank #1 / 210
93
Facility 93
PA AVG 83
Rank #85 / 460
9
Facility 9
PA AVG 31.3
Rank #60 / 207
3.0
Facility 3.0
PA AVG 4.4
Rank #71 / 207
-47-
75
Facility 75
PA AVG 46
Rank #111 / 668
Evelyn Fry
$28.7M
Facility $28.7M
PA AVG $32.8M
Rank #32 / 209
$21.9M
Facility $21.9M
PA AVG $6.7M
Rank #8 / 209
76.3%
Facility 76.3%
PA AVG 40%
Rank #23 / 209
395475
Spring Creek Rehabilitation & Health Care Center
NH
MC
NC
Harrisburg (East Harrisburg)
404
Facility 404
PA AVG 94
Rank #2 / 555
84.4%
Facility 84.4%
PA AVG 78.7%
Rank #100 / 518
+7%
3.82
Facility 3.82
PA AVG 4.15
Rank #148 / 207
-4%-8%
$17.1k
Facility $17.1k
PA AVG $61.2k
Rank #170 / 210
-
47
Facility 47
PA AVG 31.3
Rank #173 / 207
3.1
Facility 3.1
PA AVG 4.4
Rank #83 / 207
2364A
67
Facility 67
PA AVG 46
Rank #158 / 668
Steven Rosenzweig
$39.0M
Facility $39.0M
PA AVG $32.8M
Rank #26 / 209
$20.0M
Facility $20.0M
PA AVG $6.7M
Rank #14 / 209
51.2%
Facility 51.2%
PA AVG 40%
Rank #67 / 209
395074
Oak Hill Village
NH
AL
IL
MC
PC
Middletown (North Union Street)
40
Facility 40
PA AVG 94
Rank #495 / 555
65.0%
Facility 65.0%
PA AVG 78.7%
Rank #313 / 518
-17%
3.31
Facility 3.31
PA AVG 4.15
Rank #196 / 207
+41%-20%
$61.3k
Facility $61.3k
PA AVG $61.2k
Rank #194 / 210
97
Facility 97
PA AVG 83
Rank #30 / 460
73
Facility 73
PA AVG 31.3
Rank #201 / 207
4.9
Facility 4.9
PA AVG 4.4
Rank #139 / 207
726-
21
Facility 21
PA AVG 46
Rank #524 / 668
Matthew Pavalko
$18.4M
Facility $18.4M
PA AVG $32.8M
Rank #122 / 209
$8.5M
Facility $8.5M
PA AVG $6.7M
Rank #103 / 209
46.3%
Facility 46.3%
PA AVG 40%
Rank #70 / 209
395347
The Gardens at West Shore
NH
MC
PC
RC
Camp Hill
309
Facility 309
PA AVG 94
Rank #5 / 555
--
4.19
Facility 4.19
PA AVG 4.15
Rank #99 / 207
0%+1%
$51.5k
Facility $51.5k
PA AVG $61.2k
Rank #191 / 210
-
65
Facility 65
PA AVG 31.3
Rank #196 / 207
3.8
Facility 3.8
PA AVG 4.4
Rank #109 / 207
438F
40
Facility 40
PA AVG 46
Rank #383 / 668
Michael Stuck
$20.0M
Facility $20.0M
PA AVG $32.8M
Rank #62 / 209
$7.5M
Facility $7.5M
PA AVG $6.7M
Rank #80 / 209
37.3%
Facility 37.3%
PA AVG 40%
Rank #163 / 209
395223

Financial Assistance for
Nursing Home in Pennsylvania

The Gardens at West Shore is located in Camp Hill, Pennsylvania.
Here are the financial assistance programs available to residents in Pennsylvania.

Get Financial aid guidance

Community HealthChoices (CHC)

PA Medicaid CHC

Age 65+ or disabled
General Pennsylvania resident, Medicaid-eligible, nursing home-level care need.
Income Limits (2025) ~$2,829/month 300% FBR, individual
Asset Limits $2,000 (individual), $3,000 (couple) (excludes home, car).
PA

Managed care model; high urban demand (e.g., Philadelphia, Pittsburgh).

Benefits
Personal care (5-7 hours/day, e.g., bathing, dressing) Respite care (up to 240 hours/year) Adult day care ($70/day) Home modifications ($1,500 avg.)

Pennsylvania OPTIONS Program

PA OPTIONS

Age 60+
General Pennsylvania resident, at risk of nursing home placement.
Income Limits ~$2,000/month individual, varies by region
Asset Limits $8,000 individual
PA

Cost-sharing required above certain income; rural/urban balance.

Benefits
In-home care (3-5 hours/week) Respite (up to 10 days/year) Adult day care (~$70/day) Transportation (~5 trips/month)

Living Independence for the Elderly (LIFE)

Pennsylvania LIFE (PACE)

Age 55+
General PA resident (specific counties), NFLOC, safe with LIFE support.
Income Limits (2025) ~$2,829/month (Medicaid-eligible); private pay option available.
Asset Limits $2,000 (individual), $3,000 (couple) for Medicaid enrollees.
PA

16 providers in 25 counties (e.g., Allegheny, Luzerne); LIFE branding unique to PA.

Benefits
Personal care (5-7 hours/day) Medical care Meals Transportation Respite Therapies

Medicare Savings Program (MSP)

Pennsylvania Medicare Savings Program

Age 65+ or disabled
General PA resident, Medicare Part A/B.
Income Limits (2025) ~$2,510/month (QMB), ~$3,380/month (SLMB), ~$3,598/month (QI)—individual.
Asset Limits $9,430 (individual), $14,130 (couple).
PA

Three tiers; includes Extra Help for Part D; no waitlist.

Benefits
Covers Part B premiums ($174.70/month) Deductibles ($240/year) Copays (~20%)

Family Caregiver Support Program (FCSP)

Pennsylvania Family Caregiver Support Program

Age
General Caregivers of 60+ needing care or 55+ caregivers of others; PA resident; functional needs (2+ ADLs).
Income Limits (2025) No strict cap; reimbursements up to $600/month if care recipient income < ~$2,322/month 185% FPL
Asset Limits Not assessed; need-based.
PA

High demand; includes grandparent caregivers.

Benefits
Respite (4-6 hours/week or 5 days/year) Adult day care ($60/day) Supplies (~$2,000/year) Caregiver training

VA Aid and Attendance (A&A) and Housebound Benefits

Pennsylvania VA Aid and Attendance/Housebound

Age 65+ or disabled veteran/spouse
General PA resident, wartime service, need for ADL help (A&A) or homebound.
Income Limits (2025) Net income < ~$1,984/month (veteran with dependent, A&A); pension offsets income.
Asset Limits ~$155,356 net worth limit
PA

High veteran population; supports rural/urban care needs.

Benefits
Cash (~$1,433-$2,642/month veteran, ~$951-$1,318 spouse) for care costs (e.g., in-home, assisted living)

Property Tax/Rent Rebate Program (PTRR)

Pennsylvania Property Tax/Rent Rebate Program

Age 65+
General PA resident, homeowner/renter (or widow/er 50+, disabled 18+).
Income Limits (2025) ~$45,000/year individual or couple, excludes half of Social Security
Asset Limits Not assessed; income-focused.
PA

Rebates up to $1,000; ~600,000 eligible annually.

Benefits
Rebates ($250-$1,000 based on income; e.g., $1,000 if income < $8,000)

Senior Farmers’ Market Nutrition Program (SFMNP)

Pennsylvania SFMNP

Age 60+
General PA resident, low-income.
Income Limits (2025) ~$2,322/month individual, 185% FPL
Asset Limits Not assessed.
PA

Vouchers (~$50/season) via 52 AAAs; serves ~200,000 annually.

Benefits
Vouchers (~$50/season) for fresh produce at approved markets

Frequently Asked Questions about The Gardens at West Shore

Is The Gardens at West Shore in a walkable area?

The Gardens at West Shore has a walk score of 40. Somewhat walkable. A few nearby services may be reachable on foot, but most trips require transportation.

What is the occupancy rate at The Gardens at West Shore?

The Gardens at West Shore's occupancy is 52.9%.

Are there photos of The Gardens at West Shore?

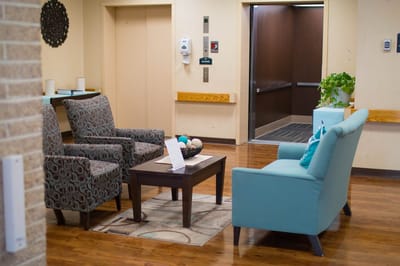
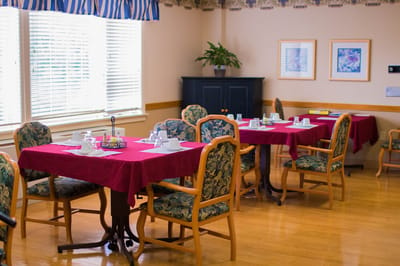
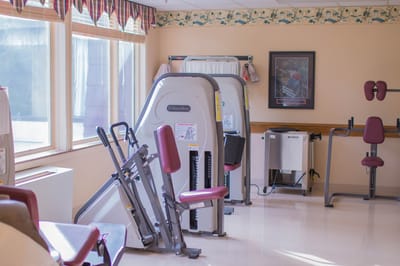
Yes — there are 4 photos of The Gardens at West Shore in the photo gallery on this page.

What is the phone number of The Gardens at West Shore?

(717) 763-7070 will put you in contact with the team at The Gardens at West Shore.

Is The Gardens at West Shore Medicare or Medicaid certified?

Yes — The Gardens at West Shore is a CMS-certified provider of Medicare and Medicaid.

Guides for Better Senior Living

Care Cost Calculator: See Prices in Your Area

Nursing Home Data Explorer

Don’t Wait Too Long: 7 Red Flag Signs Your Parent Needs Assisted Living Now

The True Cost of Assisted Living in 2025 – And How Families Are Paying For It

Understanding Senior Living Costs: Pricing Models, Discounts & Financial Assistance