Spring Hills Livingston
CMS overall rating Info CMS (the Centers for Medicare & Medicaid Services) is the federal agency that rates nursing home quality. Its Overall Rating runs from 1 to 5 stars, combining health inspections, staffing, and quality measures, with inspections weighted most heavily.

Spring Hills Livingston

CMS overall rating Info CMS (the Centers for Medicare & Medicaid Services) is the federal agency that rates nursing home quality. Its Overall Rating runs from 1 to 5 stars, combining health inspections, staffing, and quality measures, with inspections weighted most heavily.
Calculator: See prices in your area
Spring Hills Livingston accepts Medicaid, Medicare, and private pay.

Overview of Spring Hills Livingston

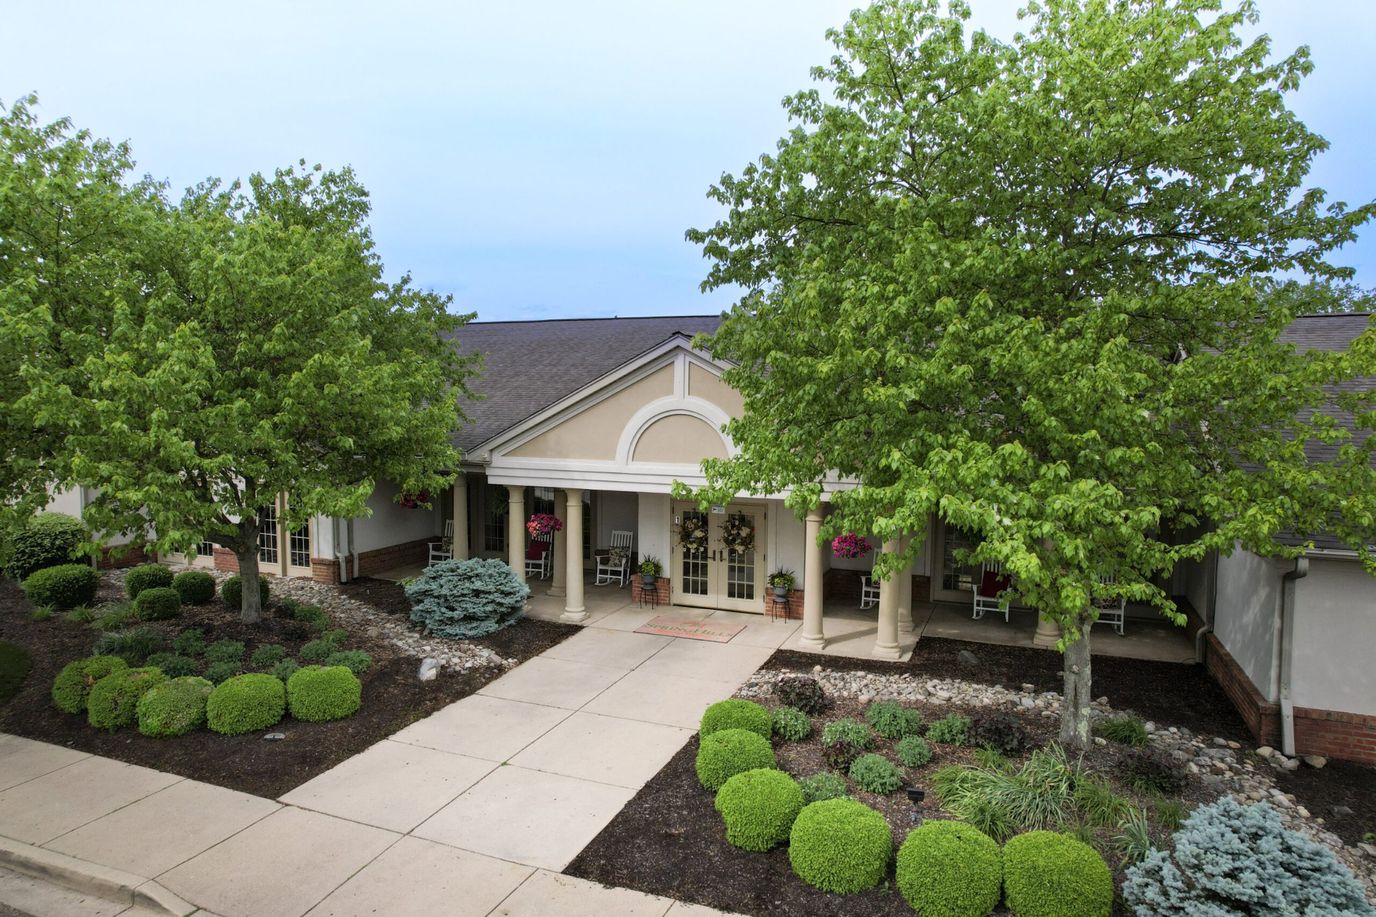
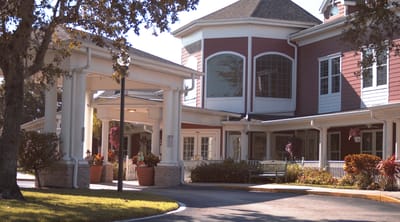
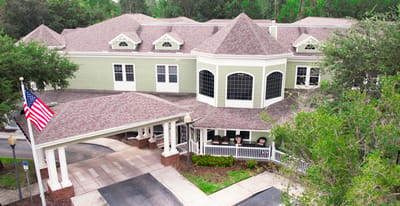
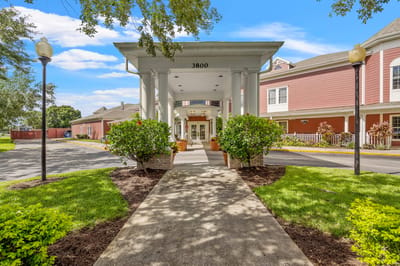
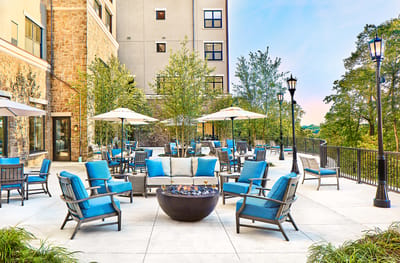
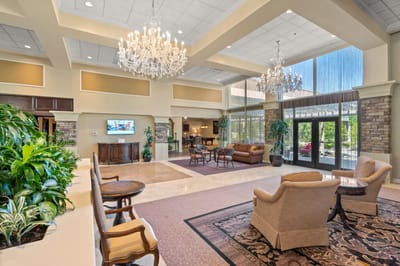
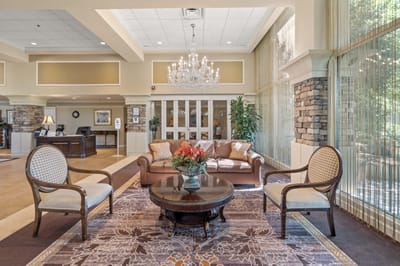
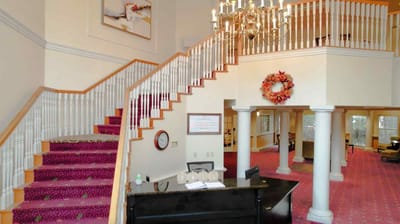
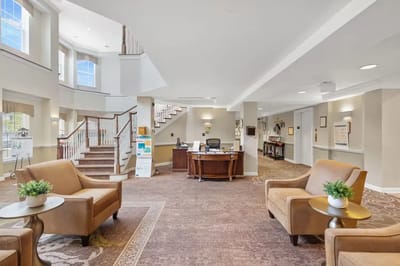
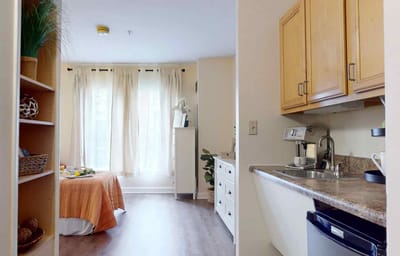
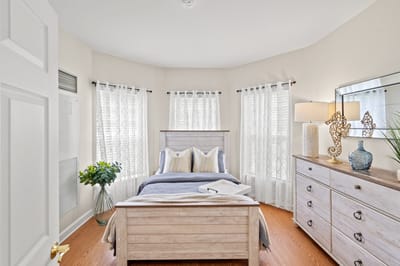
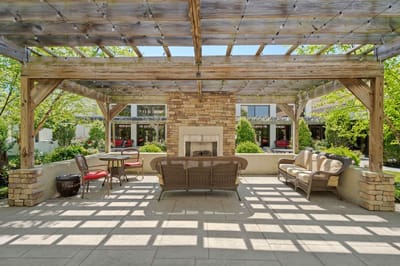
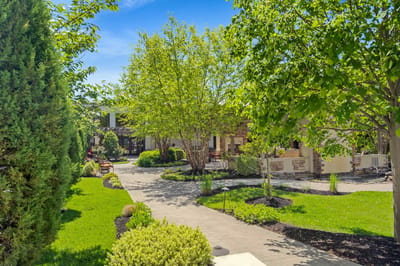
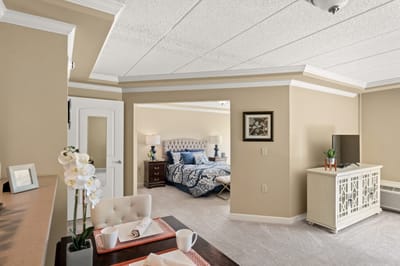
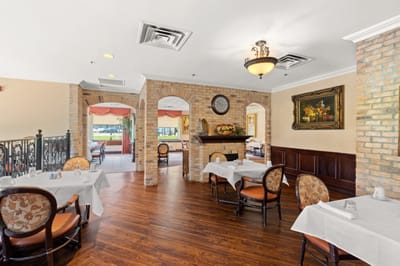
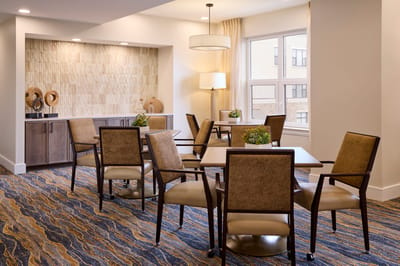
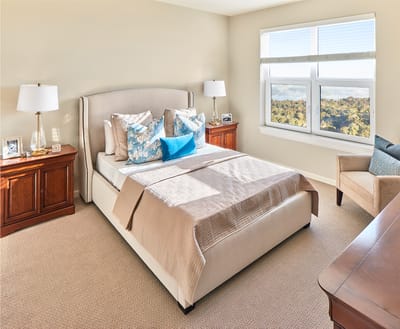
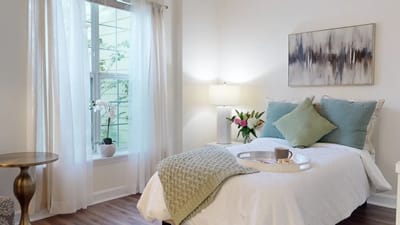
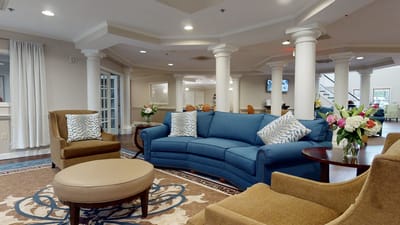
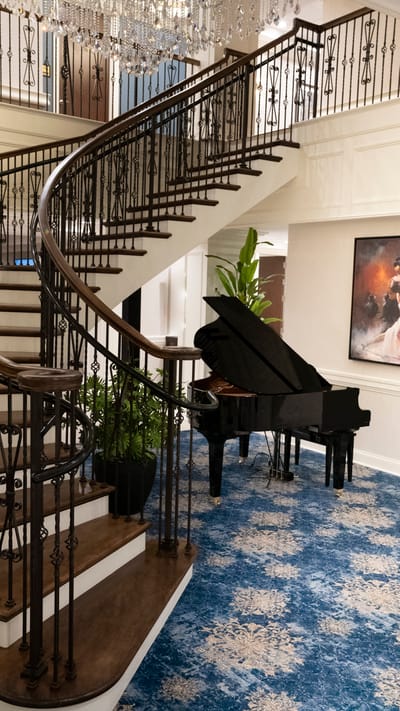
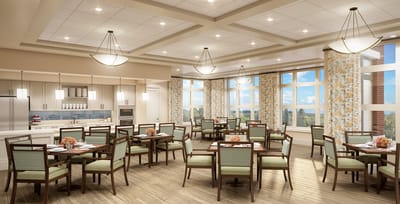
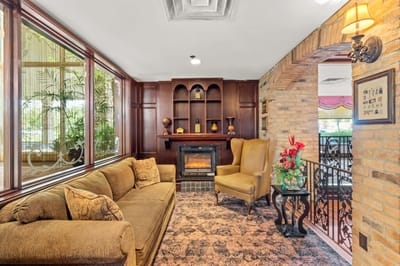
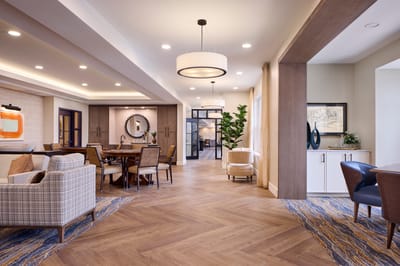
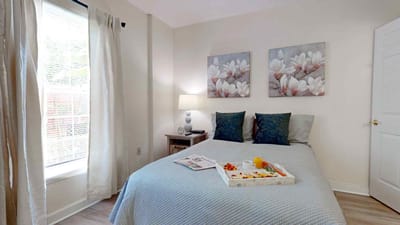
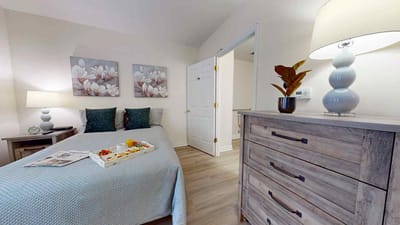
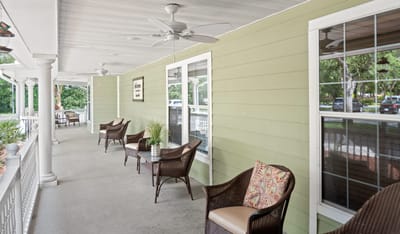
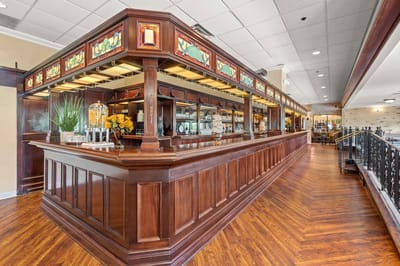
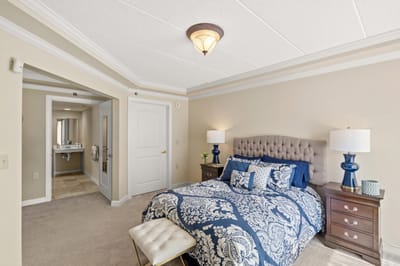
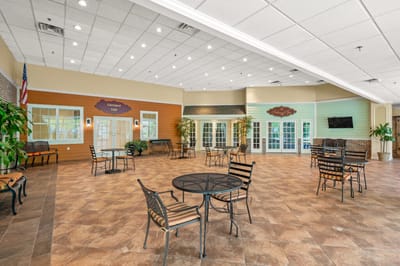
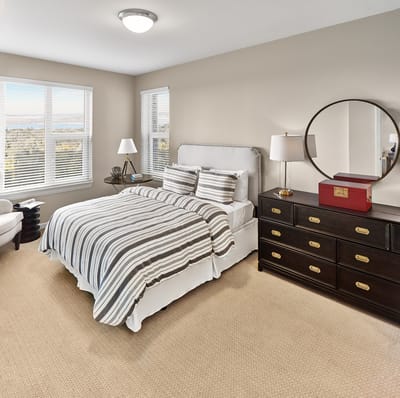
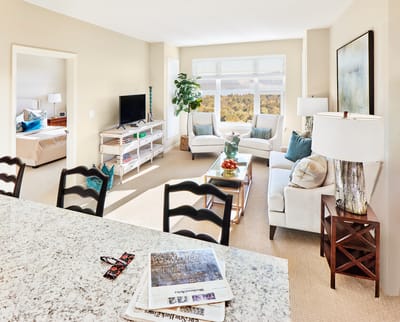
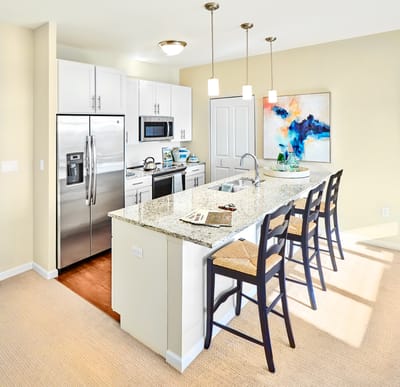
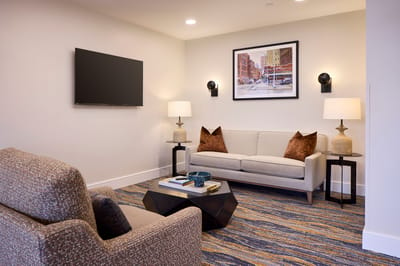
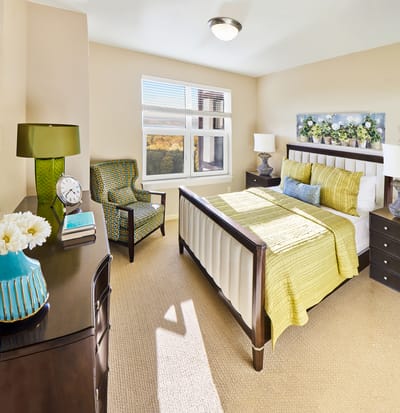
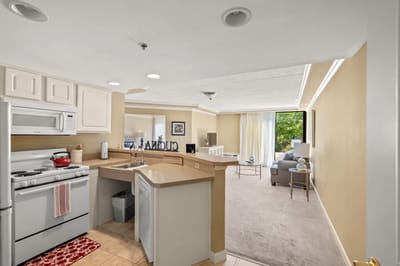
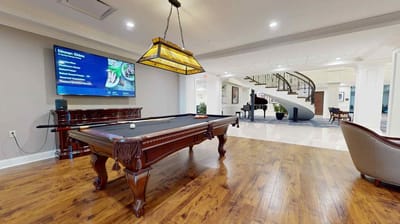
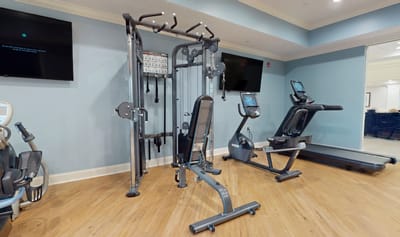
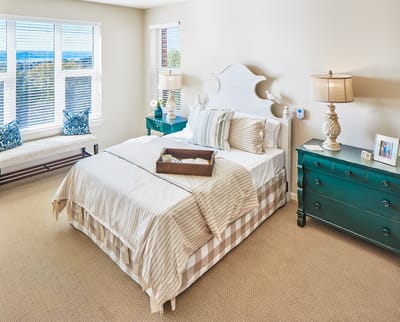
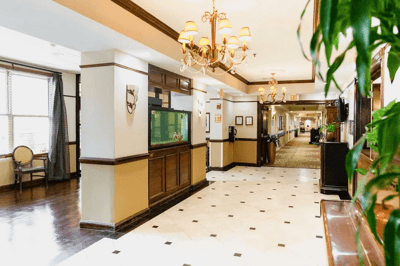
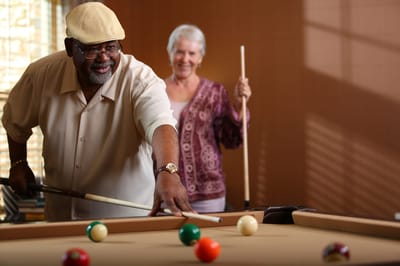
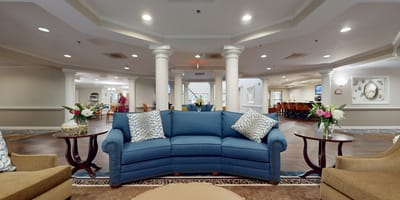
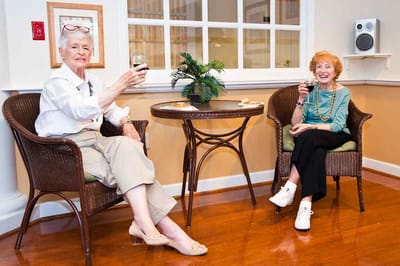
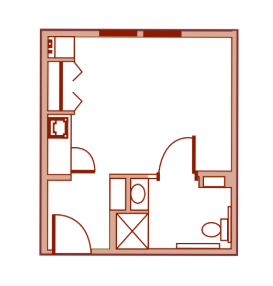
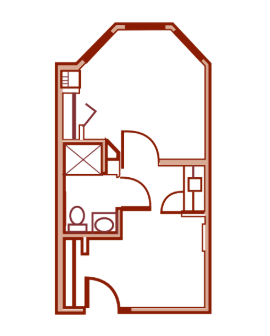
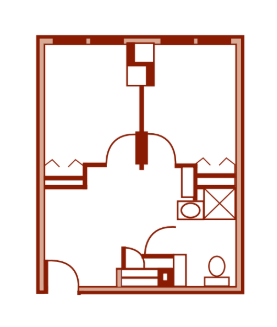
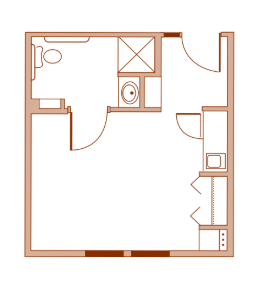
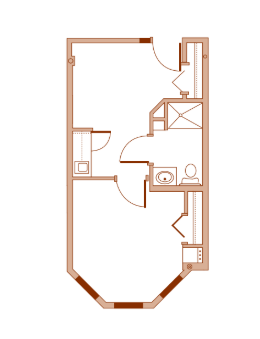
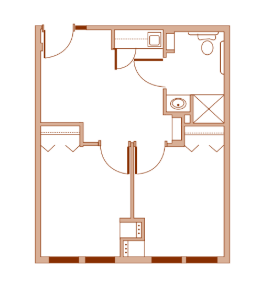
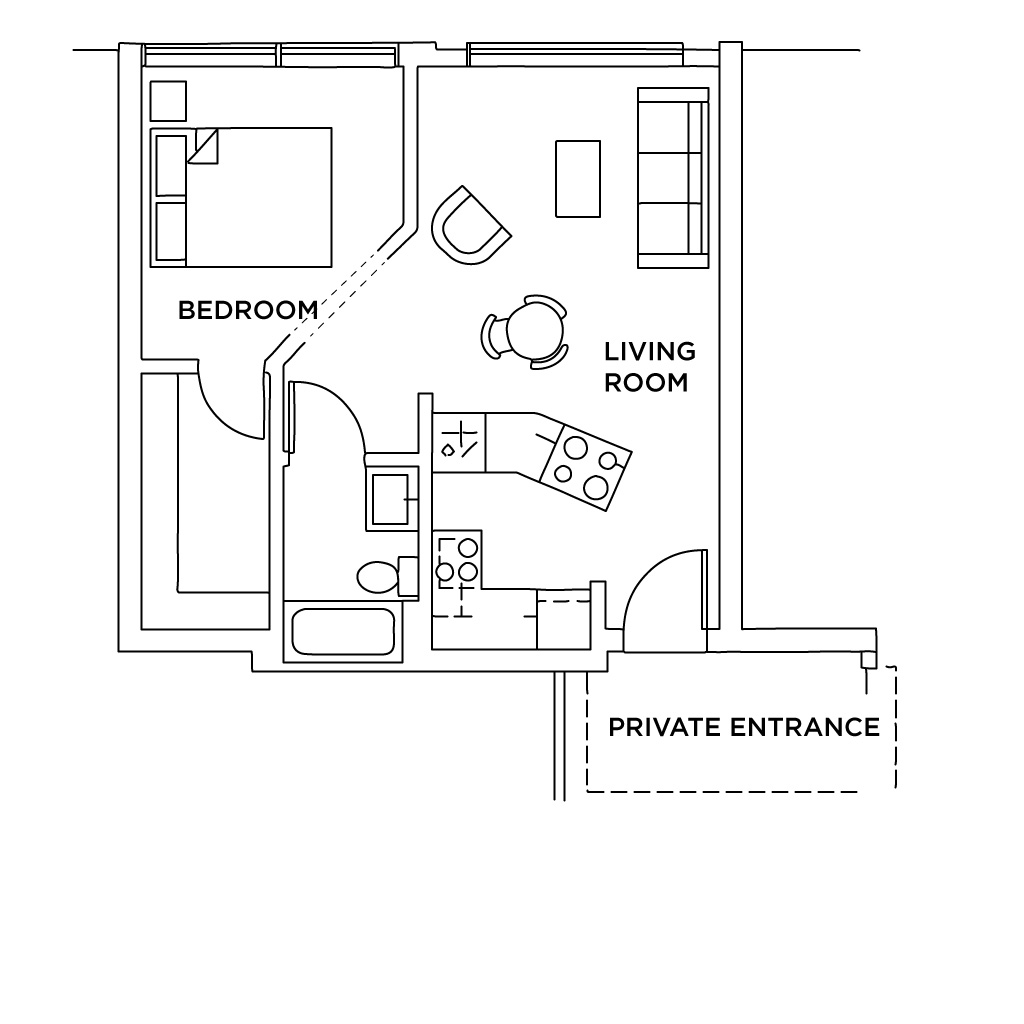
Spring Hills Livingston in New Jersey has been providing care and services to seniors for over 20 years. The community offers a luxurious and elegant atmosphere, with a variety of floor plans to choose from, including studios, one-bedroom, and two-bedroom apartments, each featuring private bathrooms and kitchens. This home strikes a good balance between a peaceful atmosphere and an active environment. 
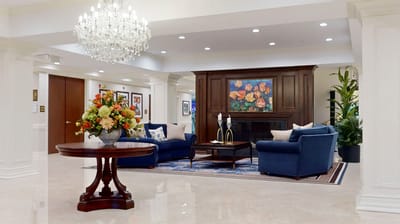
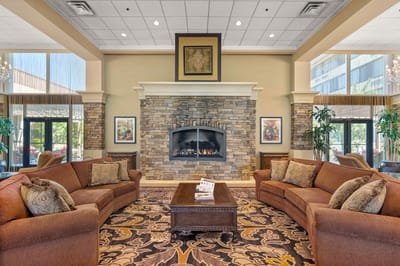
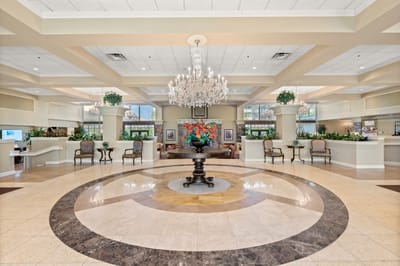
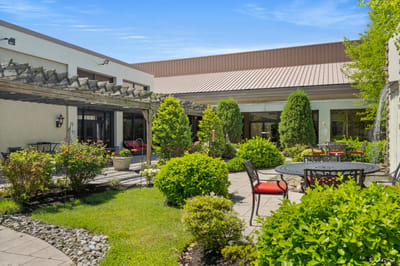
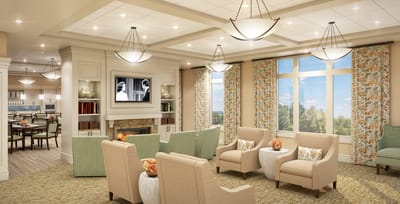
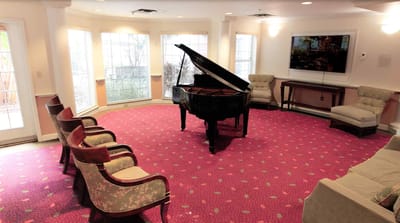
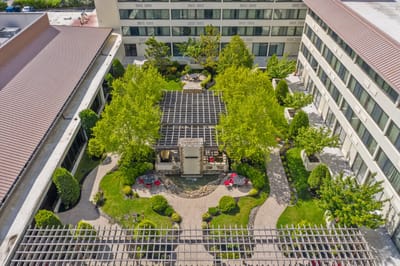
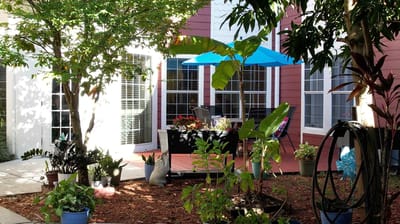
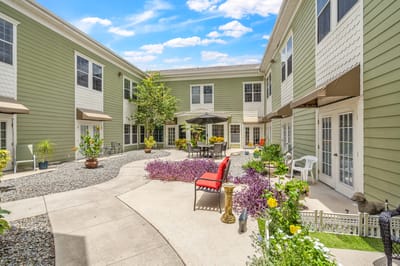
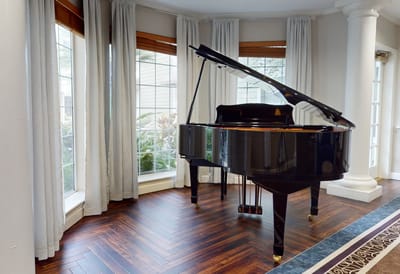
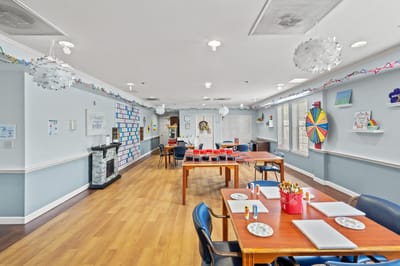
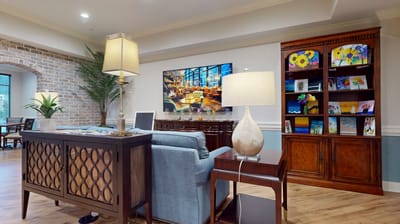
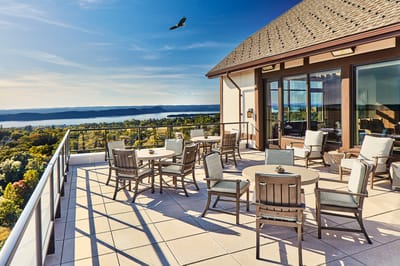
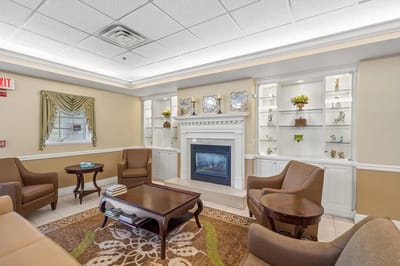
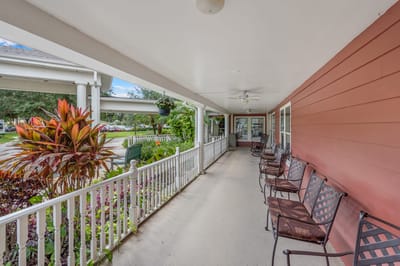
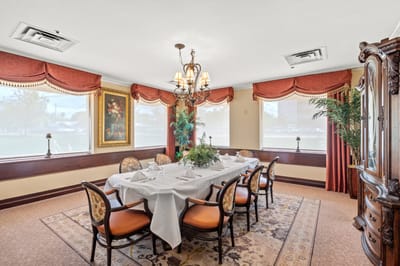
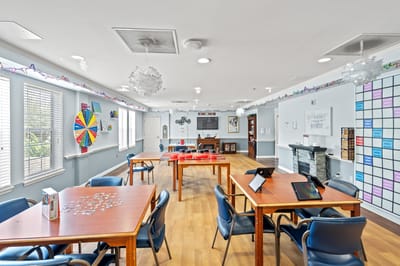
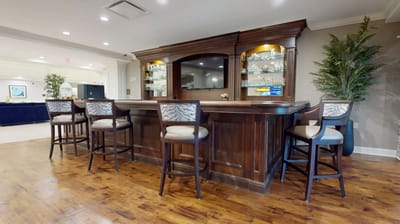
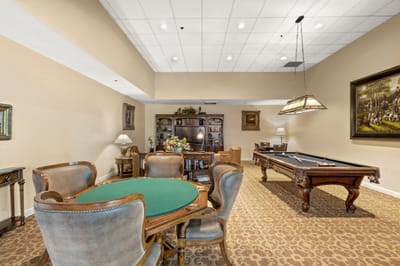
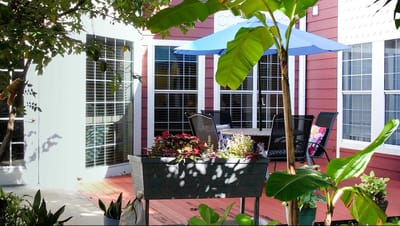
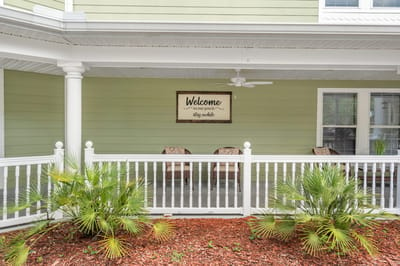
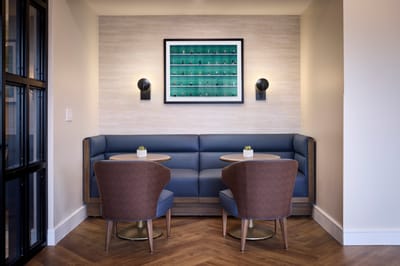
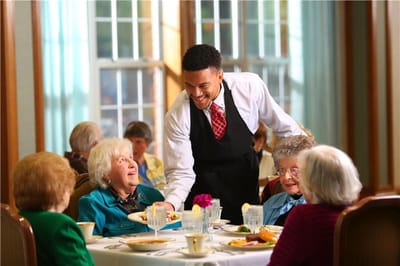
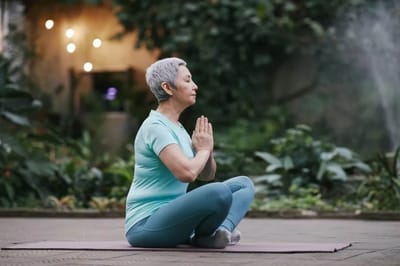
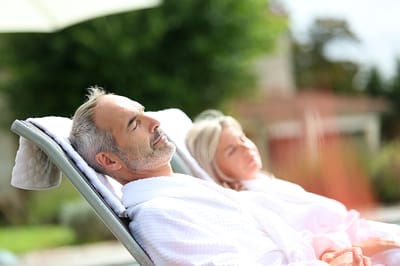
Residents can enjoy a range of amenities such as a tranquil courtyard, social areas to connect with friends, a salon and barber for grooming and pampering, and a movie theater for entertainment. Housekeeping services ensure that residents can relax and enjoy their surroundings, while drivers and valet services are available for easy transportation. The community also offers concierge services to cater to residents’ unique needs and preferences. With its upscale amenities and welcoming environment, Spring Hills Livingston is a perfect choice for seniors looking for a comfortable and fulfilling retirement experience.

(973) 333-2200

Quality ratings

Measured by Centers for Medicare & Medicaid Services (CMS)

Overall rating Info The Overall CMS Rating combines results from health inspections, staffing levels and quality measures. Health inspections carry the most weight. Staffing and quality scores can increase or decrease the final rating based on performance compared to state and national standards.
▼ 41.5% Below NJ avg. ▼ 41.5% Below NJ avg.Click the badge to see the full State ranking.Click here to see the full State ranking.
Health Inspection Info Based on the results of the facility's three most recent standard inspections and any complaint investigations. CMS reviews the number, scope, and severity of deficiencies, with more recent findings weighted more heavily.
▼ 30.3% Below NJ avg. ▼ 30.3% Below NJ avg.Click the badge to see the full State ranking.Click here to see the full State ranking.
Staffing Info Measures average nursing staff hours per resident per day, including Registered Nurses (RNs) and total nursing staff. Ratings are adjusted based on the level of care residents require and are compared to state and national benchmarks.
▼ 35.5% Below NJ avg. ▼ 35.5% Below NJ avg.Click the badge to see the full State ranking.Click here to see the full State ranking.
Quality Measures Info Based on clinical and physical health indicators reported to CMS, such as hospital readmissions, falls, pressure ulcers, and improvements in mobility. These measures reflect how well residents' health needs are being managed.
▼ 9.1% Below NJ avg. ▼ 9.1% Below NJ avg.Click the badge to see the full State ranking.Click here to see the full State ranking.

Staffing hours breakdown

Info Daily nursing hours per resident by staff type, reported to CMS. Higher is generally better — compare this facility to state and national averages to see where staffing stands.

Hours per resident per day — compared to New Jersey state averages

Total nursing care / resident Info This home is ranked 244th out of 274 homes in New Jersey for nurse hours. Total adjusted nursing hours per resident per day, combining RN, LPN, and aide time. CMS adjusts this for case-mix so facilities can be fairly compared.
3h 4m per day
Rank #244 / 274Nurse hours — State benchmarkedThis home is ranked 244th out of 274 homes in New Jersey. Shows adjusted nurse hours per resident per day benchmarked to the New Jersey average, with a ranking across 274 New Jersey facilities. More hours mean more direct care. The national average is about 3.5 hrs; below 3.0 is a red flag.Click the rank badge to see the full State ranking.Click here to see the full State ranking.
This facility New Jersey avg (3h 55m per day)
vs New Jersey avg
-21%

2 of 6 metrics below state avg

Standout metric Weekend RN is +89% above state avg
Staff typeHours / Day / Residentvs state avg
Registered Nurse (RN) Info RNs hold the highest nursing license and can assess residents, interpret test results, and direct care plans. More RN hours per day often signals stronger clinical oversight and faster response to health changes. 50m per day ▲ 20% State avg: 42m per day · National avg: 41m per day
LPN / LVN Info Licensed Practical Nurses (LPNs) or Licensed Vocational Nurses (LVNs) deliver routine hands-on care — medication administration, wound dressing, and monitoring vital signs. They work under RN supervision and make up a large share of daily bedside care. 50m per day ▼ 11% State avg: 57m per day · National avg: 52m per day
Nurse Aide Info Certified Nurse Aides (CNAs) provide the most direct day-to-day assistance: bathing, dressing, feeding, and mobility. Nurse aide hours are typically the largest staffing category and directly affect residents' quality of life. 2h 10m per day ▼ 3% State avg: 2h 15m per day · National avg: 2h 20m per day
Weekend Total Nursing Info Combined nursing hours (RN + LPN + Nurse Aide) per resident per day on weekends. Staffing often drops on weekends — this figure reveals whether the facility maintains adequate coverage outside of weekday hours. 3h 48m per day ▲ 8% State avg: 3h 30m per day · National avg: 3h 27m per day
Physical Therapist Info Hours per resident per day provided by licensed Physical Therapists (PTs) or PT Assistants. PT services help residents recover mobility after injury or illness and are especially important for post-acute (short-stay) rehabilitation. 10m per day ▲ 57% State avg: 7m per day · National avg: 4m per day
Weekend RN Info Registered nurse hours specifically on weekends. Facilities sometimes reduce RN presence on Saturdays and Sundays — a low weekend RN figure compared to weekday hours can indicate reduced clinical oversight when most administrative staff are absent. 57m per day ▲ 89% State avg: 30m per day · National avg: 29m per day

Capacity and availability

Avg. Length of Stay
31 days
Bed community size
150-bed community Rank #145 / 561Bed count — State benchmarkedThis home is ranked 145th out of 561 homes in New Jersey. Shows this facility's certified or reported bed count compared to other New Jersey facilities. Larger communities may offer more amenities, programs, and on-site services for residents and families.Click the rank badge to see the full State ranking.Click here to see the full State ranking.
A larger shared setting that may offer more common spaces and organized community services.
Walk Score
Walk Score: 24 / 100 Rank #482 / 640Walk Score — State benchmarkedThis home is ranked 482nd out of 640 homes in New Jersey. Shows how walkable this facility's neighborhood is compared to the average Walk Score across New Jersey facilities. Higher scores benefit residents, families, and staff.Click the rank badge to see the full State ranking.Click here to see the full State ranking.
Car-dependent. Most errands require a car, with limited nearby walkable options.

About this community

License Details

Facility TypeAssisted Living Residence
StatusActive
ExpirationApril 30, 2027
License Number07A022

Ownership & Operating Entity

Spring Hills Livingston is legally operated by Spring Hills Livingston, and administrated by Mr. Alexander Markowits.

Officers

Info Officers are individuals or entities with formal legal or financial responsibility for the organization that owns this facility

Spring Hill Holdings, LLC

Type Of Units

Assisted Living
150 units
Total beds
150 units

Payment & Insurance

2 services
Accept Medicaid
Accept Medicare

Therapy & Rehabilitation

2 services
Rehabilitation Services
Respite Care

Staffing & Medical

1 service
24-Hour Staffing

Additional Policies & Features

Pets Allowed
HousekeepingYes
Linen ServiceYes
Utilities IncludedYes

Amenities & Lifestyle

Branded ProgramsSignature Touches™
Wellness ProgramA lifestyle centered on wellness, intertwining personalized healthcare services with recreational, physical, and social activities.
Specific Programsenhanced care
Operating HoursMo,Tu,We,Th,Fr,Sa,Su 00:00-23:59

Contact Spring Hills Livingston

Inspection History

In New Jersey, the Department of Health, Health Facilities Evaluation and Licensing conducts mandatory unannounced surveys to ensure facilities provide safe and effective resident care.

Since 2021 · 5 years of data 35 deficiencies 2 inspections

Inspection Scorecard Info This scorecard compares key inspection, citation, and complaint metrics at this facility against the New Jersey state average. Metrics rated ≥15% worse than average are highlighted in red; those ≥15% better are highlighted in green.

Since 2021 vs. New Jersey state average
Overall vs. NJ average 3 Worse Metrics worse than New Jersey average:
• Total deficiencies (94% above)
• Deficiencies per year (94% above)
• Deficiencies per inspection (775% above)
1 Better Metrics better than New Jersey average:
• Total inspections (78% below)
Latest Inspection November 21, 2025 Complaint Investigation

Deficiencies Info Deficiencies are formal regulatory issues recorded during state inspections.

This FacilityNJ Averagevs. NJ Avg
Total deficiencies Info Formal regulatory issues recorded by inspectors across all inspection types. 3518 This facility has 94% more total deficiencies than a typical New Jersey nursing home (35 vs. NJ avg 18).↑ 94% worse
Deficiencies per year Info Average deficiencies per year since 2021. 73.6 This facility has 94% more deficiencies per year than a typical New Jersey nursing home (7 vs. NJ avg 3.6).↑ 94% worse
Deficiencies per inspection Info Average deficiencies per inspection. 17.52 This facility has 775% more deficiencies per inspection than a typical New Jersey nursing home (17.5 vs. NJ avg 2).↑ 775% worse

Inspections Info State inspections evaluate whether the facility meets health and safety standards.

This FacilityNJ Averagevs. NJ Avg
Total inspections Info Combined count of all routine and focused inspections. Excludes complaint investigations. 29 This facility has 78% fewer total inspections than a typical New Jersey nursing home (2 vs. NJ avg 9).↓ 78% better

Inspection Reports Summary Info An editor-reviewed summary of the themes and findings across this facility's recent inspection reports.

  • November 21, 2025 complaint investigation found failure to administer IV antibiotic for four days, delayed physician notification, and incomplete documentation for Resident 3.
  • September 20, 2024 complaint investigation cited 19 deficiencies including inaccurate MDS coding, medication errors, infection control lapses, insufficient staffing, and poor pain management.
  • November 27, 2024 COVID-19 focused infection control survey found the facility fully compliant with state regulations and CDC recommended practices.

Health Inspection History

Inspections since 2021
Total health inspections 4

New Jersey average 4


Last Health inspection on Sep 2024

Total health citations
30 Rank #228 / 276Health citations — State benchmarkedThis home is ranked 228th out of 276 homes in New Jersey. Shows this facility's total health deficiency citations benchmarked to the New Jersey State average, with a ranking across all 276 NJ facilities. Lower citation counts earn a better rank.Click the rank badge to see the full State ranking.Click here to see the full State ranking.

New Jersey average 20.9

Citations per inspection
7.5 Rank #233 / 276Citations per inspection — State benchmarkedThis home is ranked 233rd out of 276 homes in New Jersey. Shows average deficiency citations per CMS inspection for this facility versus the New Jersey mean across 276 facilities with citation data. Lower is better.Click the rank badge to see the full State ranking.Click here to see the full State ranking.

New Jersey average 5.35


Health citations are formal notices following inspections when they fail to comply with safety and care standards.

23 of 30 citations resulted from standard inspections; 1 of 30 resulted from complaint investigations; and 6 of 30 came from combined inspections (standard and complaint).

Breakdown of citation severity (last 5 years)
Critical health citations
0
100% better than New Jersey average

New Jersey average: 0.7


Serious health citations
0
100% better than New Jersey average

New Jersey average: 0.4

0 critical citations New Jersey average: 0.7

0 serious citations New Jersey average: 0.4

30 moderate citations New Jersey average: 19.3

0 minor citations New Jersey average: 0.5
Citations history (last 5 years)
Administration moderate citation Sep 20, 2024
Corrected

Environmental moderate citation Sep 20, 2024
Corrected

Infection Control moderate citation Sep 20, 2024
Corrected

Infection Control moderate citation Sep 20, 2024
Corrected

Staffing Data

Reporting period: October 1 – December 31, 2025 (Q4 2025). Source: CMS Payroll-Based Journal report.

Total staff 215
Employees 212
Contractors 3
Staff to resident ratio 1.73 : 1
0% compared with New Jersey average
New Jersey average ratio: 1.79 : 1 New Jersey average ratio: 1.79 : 1See full New Jersey ranking
Avg staff/day 90
Average shift 7.2 hours
10% worse than New Jersey average
New Jersey average: 8 hours New Jersey average shift: 8 hoursSee full New Jersey ranking
Total staff hours (quarter) 59,958

Nursing staff breakdown

Q4 2025 · Oct 1 – Dec 31 More info This data comes from the CMS Payroll-Based Journal report covering October 1 – December 31, 2025.
Registered Nurse

Manages medical care and health needs.

RN Staff Info 37 total: 36 full-time employees and 1 contractor. 37
Average shift length Info Average shift length. Calculated as total hours divided by days worked and average staff per day. 7.3 hours
Licensed Practical Nurse

Assists with medical care and medications.

LPN Staff Info All 28 LPN Staff are full-time employees. No contractors work on this role. 28
Average shift length Info Average shift length. Calculated as total hours divided by days worked and average staff per day. 7.2 hours
Certified Nursing Assistant

Helps with daily care and mobility.

CNA Staff Info All 79 CNA Staff are full-time employees. No contractors work on this role. 79
Average shift length Info Average shift length. Calculated as total hours divided by days worked and average staff per day. 7.2 hours

Contractor staffing

Q4 2025 · Oct 1 – Dec 31 More info This data comes from the CMS Payroll-Based Journal report covering October 1 – December 31, 2025.

Total hours from contractors

0.6%

374 contractor hours this quarter

Registered Nurse: 1 Clinical Nurse Specialist: 1 Medical Director: 1

Staff by category

Q4 2025 · Oct 1 – Dec 31 More info This data comes from the CMS Payroll-Based Journal report covering October 1 – December 31, 2025.
Certified Nursing Assistant7907925,90292100%7.2
Licensed Practical Nurse280289,47192100%7.2
Registered Nurse361376,80692100%7.3
Physical Therapy Aide160162,90892100%6.6
Clinical Nurse Specialist7182,62892100%6.8
Respiratory Therapy Technician7072,0328592%6.9
Speech Language Pathologist9091,74292100%8.8
Physical Therapy Assistant7071,2898693%7.2
Dietitian3031,0927885%7.5
Physical Therapist3039537986%7.7
Qualified Social Worker6067826874%7.6
Other Dietary Services Staff2026867784%6.9
Mental Health Service Worker2026666470%5.9
Occupational Therapy Aide2026218087%6.7
Administrator1015286672%8
RN Director of Nursing1015286672%8
Nurse Practitioner1014645863%8
Dental Services Staff1014415964%7.5
Therapeutic Recreation Specialist1013905358%7.4
Medical Director011301516%2
79 Certified Nursing Assistant
% of Days 100%
28 Licensed Practical Nurse
% of Days 100%
37 Registered Nurse
% of Days 100%
16 Physical Therapy Aide
% of Days 100%
8 Clinical Nurse Specialist
% of Days 100%
7 Respiratory Therapy Technician
% of Days 92%
9 Speech Language Pathologist
% of Days 100%
7 Physical Therapy Assistant
% of Days 93%
3 Dietitian
% of Days 85%
3 Physical Therapist
% of Days 86%
6 Qualified Social Worker
% of Days 74%
2 Other Dietary Services Staff
% of Days 84%
2 Mental Health Service Worker
% of Days 70%
2 Occupational Therapy Aide
% of Days 87%
1 Administrator
% of Days 72%
1 RN Director of Nursing
% of Days 72%
1 Nurse Practitioner
% of Days 63%
1 Dental Services Staff
% of Days 64%
1 Therapeutic Recreation Specialist
% of Days 58%
1 Medical Director
% of Days 16%

Penalties and fines

Federal penalties imposed by CMS for regulatory violations, including civil money penalties (fines) and denials of payment for new Medicare/Medicaid admissions.

Source: CMS Penalties Database

No penalties in the past 3 years

No civil money penalties or payment denials were reported in the last 3 years.

Quality of care over time

These measures show how residents usually do over time at this home, based on health outcomes and preventive care.

High-risk clinical events score Info A composite score based on pressure ulcers, falls with injury, weight loss, walking ability decline, and activities of daily living decline. 3.7
46% better than New Jersey average

New Jersey average: 6.8

Functional decline score Info A composite score based on activities of daily living decline, walking ability decline, and incontinence. 9.5
23% better than New Jersey average

New Jersey average: 12.4

Long-stay resident measures
Need for Help with Daily Activities Increased Info Percent of long-stay residents whose need for help with daily activities has increased 7.3%
28% better than New Jersey average

New Jersey average: 10.1%

Walking Ability Worsened Info Percent of long-stay residents whose ability to move independently worsened 3.0%
73% better than New Jersey average

New Jersey average: 11.0%

Low Risk Residents with Bowel/Bladder Incontinence Info Percent of low risk long-stay residents who lose control of their bowels or bladder 18.4%
15% worse than New Jersey average

New Jersey average: 16.0%

Falls with Major Injury Info Percent of long-stay residents experiencing one or more falls with major injury 2.6%
6% worse than New Jersey average

New Jersey average: 2.4%

High Risk Residents with Pressure Ulcers Info Percent of long-stay high risk residents with pressure ulcers 2.3%
63% better than New Jersey average

New Jersey average: 6.1%

Urinary Tract Infection Info Percent of long-stay residents with a urinary tract infection 0.5%
52% better than New Jersey average

New Jersey average: 1.0%

Lost Too Much Weight Info Percent of long-stay residents who lose too much weight 3.2%
30% better than New Jersey average

New Jersey average: 4.6%

Depressive Symptoms Info Percent of long-stay residents who have depressive symptoms 15.5%
38% worse than New Jersey average

New Jersey average: 11.3%

Antipsychotic Use Info Percent of long-stay residents who received an antipsychotic medication 8.7%
21% better than New Jersey average

New Jersey average: 11.1%

Pneumococcal Vaccine Info Percent of long-stay residents assessed and appropriately given the pneumococcal vaccine 88.9%
In line with New Jersey average

New Jersey average: 93.0%

Influenza Vaccine Info Percent of long-stay residents assessed and appropriately given the seasonal influenza vaccine 93.9%
In line with New Jersey average

New Jersey average: 97.2%

Short-stay resident measures
Pneumococcal Vaccine Info Percent of short-stay residents assessed and appropriately given the pneumococcal vaccine 61.0%
23% worse than New Jersey average

New Jersey average: 78.9%

Antipsychotic medication increase Info Percent of short-stay residents who newly received an antipsychotic medication 0.8%
34% better than New Jersey average

New Jersey average: 1.2%

Influenza Vaccine Info Percent of short-stay residents assessed and appropriately given the seasonal influenza vaccine 89.5%
12% better than New Jersey average

New Jersey average: 80.1%

Breakdown by payment type

Medicare

47% of new residents, usually for short-term rehab.

Typical stay 26 days

Private pay

48% of new residents, often for short stays.

Typical stay 1 months

Medicaid

5% of new residents, often for long-term daily care.

Typical stay 1 - 2 months

Facility Characteristics

Source: CMS Long-Term Care Facility Characteristics (Data as of Jan 2026)

Total residents 124
Medicare
47
37.9% of residents
Medicaid
40
32.3% of residents
Private pay or other
37
29.8% of residents
Programs & Services
Residents Group

Residents meet regularly to discuss policies, care quality, and activities

Active Resident Council

Organized group of residents that meets regularly to discuss facility policies, quality of life, and activities.

Finances and operations

Privately-owned community
Operated by a single business entity.
Home revenue
$11.8M
Operating loss
-$1.2M
Privately-owned community Operated by a single business entity.
Home revenue
$11.8M Rank #226 / 272Revenue — State benchmarkedThis home is ranked 226th out of 272 homes in New Jersey. Shows this facility's annual revenue compared to the New Jersey average. Higher revenue generally means more resources for staffing and capital — read alongside Payroll %.Click the rank badge to see the full State ranking.Click here to see the full State ranking.
Operating loss
-$1.2M
Payroll costs Info The portion of the home's budget spent on staff, including nurses, caregivers, and other employees who support care and operations. Rank #242 / 272Payroll — State benchmarkedThis home is ranked 242nd out of 272 homes in New Jersey. Shows total annual staff payroll benchmarked to the New Jersey average. Higher payroll investment relative to peers often signals better staffing and less reliance on cheaper contract labor.Click the rank badge to see the full State ranking.Click here to see the full State ranking.
$5.9M
49.5% of revenue Rank #156 / 272Payroll % — State benchmarkedThis home is ranked 156th out of 272 homes in New Jersey. Shows payroll as a percentage of revenue versus the New Jersey average. Well-run New Jersey facilities typically land around 55–65% — the top third Statewide. Below 25% may signal understaffing or heavy agency use — read with Staffing ratings.Click the rank badge to see the full State ranking.Click here to see the full State ranking.
Other operating costs Info All remaining costs needed to run the home, such as food, utilities, building maintenance, supplies and administrative expenses.
$7.2M
Total costs $13.1M

Who this home usually serves

TYPE OF STAY

Mix of rehab and long-term care

This home supports both short-term rehab and long-term care, with residents staying for a wide range of durations.

Living Spaces & Floor Plans for Spring Hills Livingston

studio apartment floorplan
Studio Apartment Floorplan
one bedroom apartment floorplan
One Bedroom Apartment Floorplan
two bedroom apartment floorplan
Two Bedroom Apartment Floorplan
studio floor plan
Studio Floor Plan
One Bedroom Apartment Floor Plan
Two Bedroom Apartment Floor Plan
Floor plan
Floor Plan

Places of interest near Spring Hills Livingston

Address 1.2 miles from city center Info Estimated distance in miles from Livingston's city center to Spring Hills Livingston's address, calculated via Google Maps. — 4.64 miles to nearest hospital (Overlook Medical Center)

Calculate Travel Distance to Spring Hills Livingston

Add your location

Address

Financial Assistance for
Nursing Home in New Jersey

Spring Hills Livingston is located in Livingston, New Jersey.
Here are the financial assistance programs available to residents in New Jersey.

Get Financial aid guidance

Managed Long Term Services and Supports

NJ Medicaid MLTSS

Age 65+ or disabled
General New Jersey resident, Medicaid- eligible, nursing home-level care need.
Income Limits (2025) ~$2,829/month 300% FBR, individual
Asset Limits $2,000 (individual), $3,000 (couple).
NJ

High urban demand; managed care model.

Benefits
In-home care (5-7 hours/day) Assisted living Respite (240 hours/year) Medical services

JACC (Jersey Assistance for Community Caregiving)

NJ JACC

Age 60+
General New Jersey resident, at risk of nursing home.
Income Limits ~$2,500/month individual, varies
Asset Limits $40,000 individual
NJ

Higher asset limit; limited funding.

Benefits
In-home care (3-5 hours/week) Respite (up to 10 days/year) Home modifications (~$1,000 avg.)

Pharmaceutical Assistance to the Aged and Disabled (PAAD)

New Jersey PAAD

Age 65+
General NJ resident, enrolled in Medicare Part D or eligible.
Income Limits (2025) ~$42,142/year (individual), ~$49,209/year (couple).
Asset Limits Not assessed.
NJ

Copays $5 (generic), $7 (brand); covers Part D premiums up to benchmark.

Benefits
Prescription cost reduction ($500-$1,000/year savings) Premium assistance ($20/month above benchmark)

Senior Gold Prescription Discount Program

New Jersey Senior Gold

Age 65+
General NJ resident, enrolled in Medicare Part D or eligible.
Income Limits (2025) ~$42,142-$52,142/year (individual), ~$49,209-$59,209/year (couple).
Asset Limits Not assessed.
NJ

Copays $15 + 50% of remaining cost; no premium assistance.

Benefits
Prescription cost reduction (~$300-$800/year savings)

Medicare Savings Program (MSP)

New Jersey Medicare Savings Program

Age 65+ or disabled
General NJ resident, Medicare Part A/B.
Income Limits (2025) ~$2,510/month (QMB), ~$3,380/month (SLMB), ~$3,598/month (QI)—individual.
Asset Limits $9,430 (individual), $14,130 (couple).
NJ

Three tiers; no waitlist; includes Extra Help for Part D.

Benefits
Covers Part B premiums ($174.70/month) Deductibles ($240/year) Copays (~20%)

Senior Freeze (Property Tax Reimbursement)

New Jersey Senior Freeze

Age 65+ by Dec 31 prior year
General NJ resident, homeowner, paid property taxes.
Income Limits (2025) ~$150,000/year combined household, projected
Asset Limits Not assessed; home ownership required.
NJ

Combines with ANCHOR/Stay NJ via PAS-1; annual application.

Benefits
Tax reimbursement (~$500-$2,000/year) for increases since base year

ANCHOR (Affordable NJ Communities for Homeowners and Renters)

New Jersey ANCHOR

Age 65+ prioritized
General NJ resident, homeowner/renter, paid property taxes/rent.
Income Limits (2025) ~$150,000/year (homeowners), ~$75,000/year (renters).
Asset Limits Not assessed.
NJ

Combines with Senior Freeze/Stay NJ; broader than prior Homestead program.

Benefits
Tax relief (~$700-$1,500/year homeowners, ~$250-$450 renters)

Stay NJ

New Jersey Stay NJ

Age 65+ by Dec 31 prior year
General NJ resident, homeowner, lived in home 10+ years.
Income Limits (2025) ~$500,000/year projected, subject to final regs
Asset Limits Not assessed; home ownership required.
NJ

Up to 50% tax credit (max $6,500); phased implementation.

Benefits
Tax credit (~$3,000-$6,500/year, projected) starting 2026

Universal Service Fund (USF)

New Jersey Universal Service Fund

Age 65+ prioritized
General NJ resident, utility customer, low-income.
Income Limits (2025) ~$3,970/month individual, 185% FPL
Asset Limits Not assessed; income-focused.
NJ

Must owe >$25 on bill; combines with LIHEAP if eligible.

Benefits
Bill credits (~$300-$1,500/year) to cap energy costs at 6% of income

NJ Family Caregiver Support Program (via NFCSP)

New Jersey Family Caregiver Support Program

Age
General Caregivers of 60+ needing care or 55+ caregivers of others; NJ resident; functional needs (2+ ADLs).
Income Limits (2025) Prioritizes ~$24,980/year (individual); no strict cap.
Asset Limits Not assessed; need-based.
NJ

21 AAAs; rural/low-income priority.

Benefits
Respite (4-6 hours/week or 5 days/year) Adult day care ($60/day) Training Supplies (~$500/year)

VA Aid and Attendance (A&A) and Housebound Benefits

New Jersey VA Aid and Attendance/Housebound

Age 65+ or disabled veteran/spouse
General NJ resident, wartime service, need for ADL help (A&A) or homebound.
Income Limits (2025) Net income < ~$1,984/month (veteran with dependent, A&A); pension offsets income.
Asset Limits ~$155,356 net worth limit
NJ

High veteran demand in urban/rural areas.

Benefits
Cash (~$1,433-$2,642/month veteran, ~$951-$1,318 spouse) for care costs (e.g., in-home, assisted living)

Frequently Asked Questions about Spring Hills Livingston

What neighborhood is Spring Hills Livingston in?

Spring Hills Livingston is in the Livingston neighborhood of Livingston.

Is Spring Hills Livingston in a walkable area?

Spring Hills Livingston has a walk score of 24. Car-dependent. Most errands require a car, with limited nearby walkable options.

What is the license number of Spring Hills Livingston?

According to NJ state health department records, Spring Hills Livingston's license number is 07A022.

When does Spring Hills Livingston's license expire?

According to NJ state health department records, Spring Hills Livingston's license expires on April 30, 2027.

Does Spring Hills Livingston have different floorplan options?

Yes — see the floorplan options available at Spring Hills Livingston on this page.

Who is the administrator of Spring Hills Livingston?

Mr. Alexander Markowits is the administrator of Spring Hills Livingston.

How many beds does Spring Hills Livingston have?

Spring Hills Livingston has 150 beds.

Guides for Better Senior Living

Care Cost Calculator: See Prices in Your Area

Nursing Home Data Explorer

Don’t Wait Too Long: 7 Red Flag Signs Your Parent Needs Assisted Living Now

The True Cost of Assisted Living in 2025 – And How Families Are Paying For It

Understanding Senior Living Costs: Pricing Models, Discounts & Financial Assistance

Explore Open Rooms
1 Contact details
2 What type of senior care service are you looking for?
3 What budget do you have in mind for senior care?
4 How soon do you need to find care?
5 Additional details

Thank you for your interest!

Our team will be in touch shortly to help with next steps.