


Total health inspections
2
State average N/A
Last Health inspection on Feb 2024
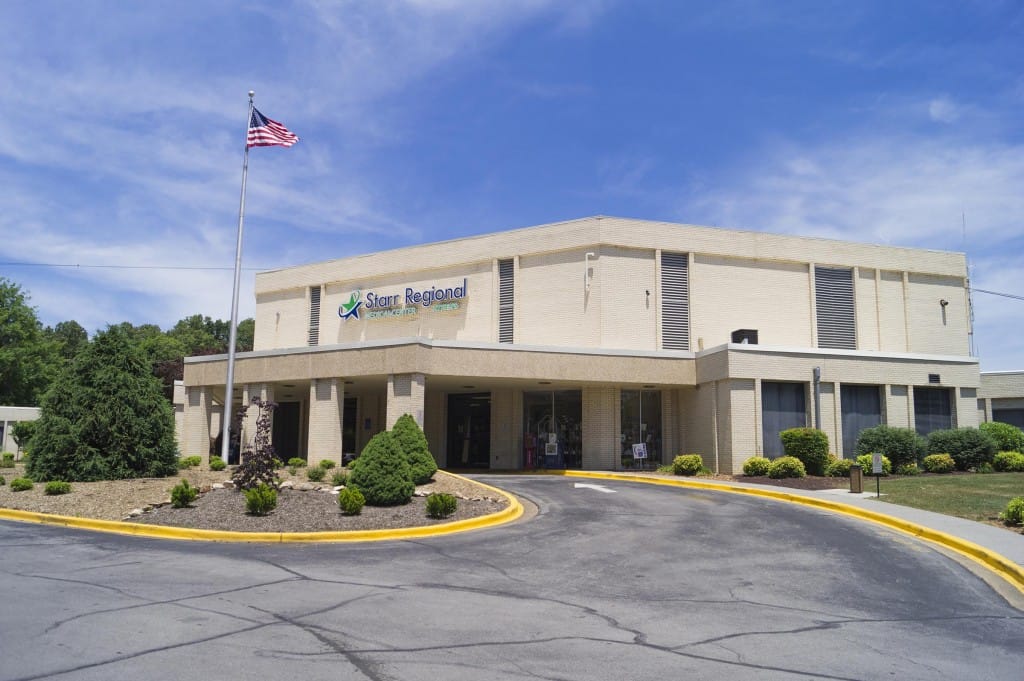
Starr Regional Health & Rehabilitation is a church-affiliated, voluntary non-profit nursing home in Etowah, TN, that provides skilled nursing care and rehabilitation services. Serving McMinn County and the surrounding East Tennessee area since July 1, 1992, this 88-bed community brings over 33 years of dedicated operational experience under the ownership of Athens Regional Medical Center, LLC.
A commitment to high-quality care is evident in the community’s 4-star overall CMS rating, which highlights above-average composite performance across health inspections, staffing metrics, and quality measures. A review of recent inspections also reveals 10 total citations across two standard evaluations over the past five years. All cited areas were of moderate severity, with absolutely zero critical or serious infractions, and every item under infection control, administration, and pharmacy services has been fully resolved. The most recent inspection was completed in February 2024.
Clinical oversight is a particular area of strength, specifically regarding registered nurse presence. Older adults benefit from 49 minutes of RN coverage per resident each day, which stands 32% above the Tennessee state average of 37 minutes. This strong clinical presence extends into the weekend, where RN hours average 27 minutes, which is 13% higher than the state benchmark. Overall daily nursing coverage also reaches a robust 4 hours and 11 minutes. While LPN/LVN and nurse aide hours sit modestly below state means by 15% each, and physical therapist hours are slightly under the state average, weekend nursing totals remain completely in line with regional benchmarks. As of Q2 2025, operations are supported by 71 total staff members, with 69 employees and 2 contractors, maintaining an average shift length of 9 hours and a staff-to-resident ratio of 1.11:1.
Comprehensive rehabilitation therapies are provided, alongside fully licensed nursing and CNA assistance. Due to its direct relationship with Athens Regional Medical Center, the community also features a hospital-affiliated care model boasting an exceptionally broad roster of medical specialties. Available programs include behavioral health, telehealth services, cardiology, vascular support, diabetes care, cancer care, infusion services, digestive health, urology, orthopedics, and sleep diagnostics. Administrative offices are open to assist families Monday through Friday, from 8:30 AM to 5 PM. Located in an area with a Walk Score of 40, most daily errands will necessitate transportation, though a handful of neighborhood services remain within walking distance.
For older adults in East Tennessee seeking a hospital-aligned skilled nursing environment with superior RN supervision and expansive specialty programs, Starr Regional Health & Rehabilitation stands out as an excellent choice in McMinn County. The community’s long-standing history in the Etowah neighborhood, paired with its church-affiliated non-profit foundation, establishes a deeply rooted and stable identity.
| Staff type | Hours / Day / Resident | vs state avg |
|---|---|---|
|
Registered Nurse (RN)
|
57m per day | ▲ 55% State avg: 37m per day · National avg: 41m per day |
|
LPN / LVN
|
1h 2m per day | ▼ 5% State avg: 1h 5m per day · National avg: 52m per day |
|
Nurse Aide
|
1h 52m per day | ▼ 13% State avg: 2h 9m per day · National avg: 2h 20m per day |
|
Weekend Total Nursing
|
3h 4m per day | ▼ 9% State avg: 3h 21m per day · National avg: 3h 26m per day |
|
Physical Therapist
|
5m per day | ▲ 6% State avg: 5m per day · National avg: 4m per day |
|
Weekend RN
|
25m per day | ▲ 4% State avg: 24m per day · National avg: 28m per day |
Starr Regional Health & Rehabilitation is administered by Wallace William Stutts.
State average N/A
Last Health inspection on Feb 2024
State average N/A
State average N/A
Health citations are formal notices following inspections when they fail to comply with safety and care standards.
All 10 citations resulted from standard inspections.
State average: N/A
State average: N/A
Reporting period: October 1 – December 31, 2025 (Q4 2025). Source: CMS Payroll-Based Journal report.
State average ratio: 0 : 0
State average: 0 hours
Manages medical care and health needs.
Assists with medical care and medications.
Helps with daily care and mobility.
| Certified Nursing Assistant | 26 | 0 | 26 | 9,934 | 92 | 100% | 9.8 |
| Licensed Practical Nurse | 11 | 0 | 11 | 5,456 | 92 | 100% | 9 |
| Registered Nurse | 11 | 0 | 11 | 3,997 | 91 | 99% | 8.8 |
| Dietitian | 5 | 0 | 5 | 1,015 | 70 | 76% | 7.4 |
| Nurse Practitioner | 3 | 0 | 3 | 975 | 66 | 72% | 7.6 |
| Physical Therapy Aide | 2 | 0 | 2 | 733 | 70 | 76% | 6.3 |
| Respiratory Therapy Technician | 1 | 0 | 1 | 468 | 62 | 67% | 7.6 |
| Mental Health Service Worker | 1 | 0 | 1 | 444 | 52 | 57% | 8.5 |
| Speech Language Pathologist | 3 | 0 | 3 | 431 | 56 | 61% | 6.9 |
| Physical Therapy Assistant | 3 | 0 | 3 | 380 | 47 | 51% | 7.9 |
| Clinical Nurse Specialist | 1 | 0 | 1 | 100 | 13 | 14% | 7.7 |
| Administrator | 1 | 0 | 1 | 60 | 8 | 9% | 7.5 |
| Qualified Social Worker | 1 | 0 | 1 | 52 | 11 | 12% | 4.7 |
| Nurse Aide in Training | 1 | 0 | 1 | 18 | 3 | 3% | 6 |
Includes penalties issued in 2024
Federal penalties imposed by CMS for regulatory violations, including civil money penalties (fines) and denials of payment for new Medicare/Medicaid admissions.
Source: CMS Penalties Database (Data as of Jan 2026)
State average: $86K
State average: 1.7
State average: 0.5
Penalties are imposed by CMS for violations of federal nursing home regulations.
2 penalties in the past 3 years
Multiple penalties were reported in the last 3 years.
Last updated: Jan 2026
These measures show how residents usually do over time at this home, based on health outcomes and preventive care.
State average: 10.5
State average: 19.5
State average: 16.0%
State average: 21.7%
State average: 20.7%
State average: 3.7%
State average: 5.4%
State average: 2.1%
State average: 6.3%
State average: 11.0%
State average: 16.5%
State average: 89.9%
State average: 94.5%
State average: 1.58
State average: 1.57
State average: 79.7%
State average: 1.7%
State average: 79.8%
State average: 22.2%
State average: 11.2%
State average: 0.8%
State average: 53.7%
State average: 50.6%
Quality measures are calculated from Minimum Data Set (MDS) assessments. For most measures, lower percentages indicate better care quality.
Source: CMS Long-Term Care Facility Characteristics (Data as of Jan 2026)
Residents meet regularly to discuss policies, care quality, and activities
State-approved Nurse Aide Training and Competency Evaluation Program on-site
Organized group of residents that meets regularly to discuss facility policies, quality of life, and activities.
Data sourced from CMS Long-Term Care Facility Characteristics quarterly report. Payer mix reflects the current resident census by primary payment source.
![]() 0.0 miles from city center
0.0 miles from city center
![]() Estimated distance in miles from Etowah's city center to Starr Regional Health & Rehabilitation's address, calculated via Google Maps.
Estimated distance in miles from Etowah's city center to Starr Regional Health & Rehabilitation's address, calculated via Google Maps.
Add your location
The information below is reported by the Tennessee Department of Health, Division of Health Care Facilities.
|
|
|
|
|
|
|
|
|
|---|---|---|---|---|---|---|---|
| The Heritage at Brentwood |
NH
AL
IL
MC
SNF
|
Brentwood | - | 66 | A+ | 7 | 1 Bed / 2 Bed / 3 Bed |
| Kirby Pines |
NH
AL
IL
MC
SNF
|
Memphis | - | 120 | - | 31 | 1 Bed / 2 Bed |
| Ben Atchley Tennessee State Veterans‘ Home |
NH
SNF
|
Knoxville | - | 140 | - | 7 | - |
| The Health Center at Standifer Place |
NH
ADC
AL
HC
HOS
IL
MC
SNF
|
Chattanooga (Walker Road) | - | 125 | A+ | 38 | - |
| Starr Regional Health & Rehabilitation |
NH
SNF
|
Etowah | - | 88 | - | 40 | - |
Starr Regional Health & Rehabilitation is legally operated by Athens Regional Medical Center, LLC, and administered by Wallace William Stutts.
Starr Regional Health & Rehabilitation has a walk score of 40. Somewhat walkable. A few nearby services may be reachable on foot, but most trips require transportation.
According to TN state health department records, Starr Regional Health & Rehabilitation's license number is 00000165.
According to TN state health department records, Starr Regional Health & Rehabilitation's license expires on August 1, 2026.
Starr Regional Health & Rehabilitation is registered as a for-profit in TN.
Wallace William Stutts is the administrator of Starr Regional Health & Rehabilitation.
Starr Regional Health & Rehabilitation has 88 beds.
Care Cost Calculator: See Prices in Your Area
Nursing Home Data Explorer
Don’t Wait Too Long: 7 Red Flag Signs Your Parent Needs Assisted Living Now
The True Cost of Assisted Living in 2025 – And How Families Are Paying For It
Understanding Senior Living Costs: Pricing Models, Discounts & Financial Assistance


