StoryPoint Grand Rapids East (Samaritas)
Nursing Home & Independent Living · Grand Rapids, MI
CMS overall rating Info CMS (the Centers for Medicare & Medicaid Services) is the federal agency that rates nursing home quality. Its Overall Rating runs from 1 to 5 stars, combining health inspections, staffing, and quality measures, with inspections weighted most heavily.

StoryPoint Grand Rapids East (Samaritas)

Nursing Home & Independent Living · Grand Rapids, MI
CMS overall rating Info CMS (the Centers for Medicare & Medicaid Services) is the federal agency that rates nursing home quality. Its Overall Rating runs from 1 to 5 stars, combining health inspections, staffing, and quality measures, with inspections weighted most heavily.
Calculator: See prices in your area
StoryPoint Grand Rapids East (Samaritas) accepts Medicare, Medicaid, and private pay.

Overview of Storypoint Grand Rapids East (samaritas)

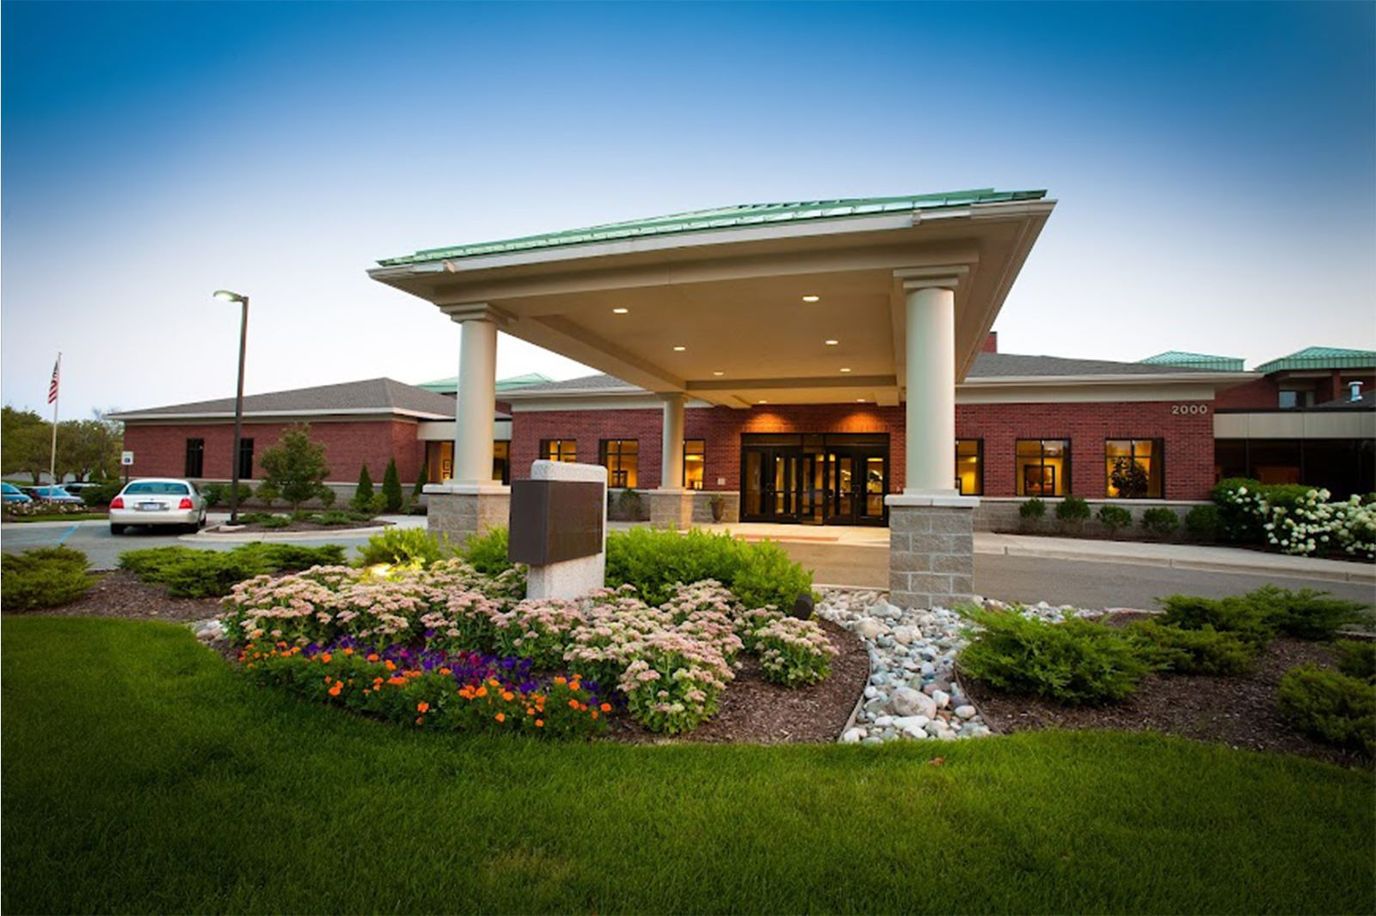
Located at 2000 32nd Street Southeast in Grand Rapids, StoryPoint Grand Rapids East (Samaritas) is a 125-bed facility operated by a church-affiliated nonprofit with 39 years of operation. The community primarily serves Medicaid residents in long-term care and independent living arrangements, with typical stays averaging 275 days. Current occupancy stands at 71.6%, modestly below the Michigan average.

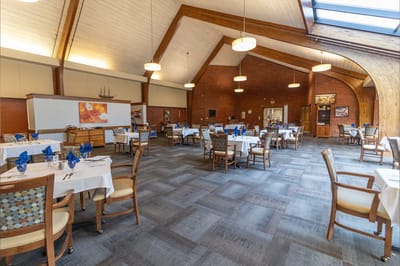
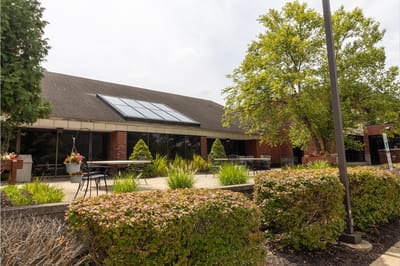
Amenities include a fitness center, salon, courtyard with walking paths, and a dining program featuring chef-prepared meals. 24-hour staffing and memory care services are available.

Regulatory compliance constitutes the most significant concern: a September 2025 inspection identified two critical and nine serious deficiencies, contributing to an overall 1-star CMS rating; 71.8% below the state average. Ten inspections since 2019 yielded 85 citations, versus a state average of 33.5, concentrated in quality of life and care, resident rights, and abuse/neglect deficiency categories.

Over three years, the facility accumulated $365,000 in federal fines and experienced three payment denials, placing it lowest among Michigan’s 136 skilled nursing facilities in penalties.

Nursing staffing hours actually exceed state benchmarks at 4 hours 53 minutes per resident per day; 15% above Michigan’s average. Weekend coverage is 28% above state standard. The staff-to-resident ratio of 2.48:1 is 46% better than peers.

Quality outcomes, despite adequate staffing levels, show serious deterioration: 11% of long-stay residents experience significant weight loss (94% worse than state average), falls with major injury occur in 6% (compared to 3.2% statewide), and antipsychotic medication is administered to 25.7% of residents versus 15% statewide.

A $1.6 million operating deficit was reported in 2023.

The facility is structured for long-term care of Medicaid-eligible adults and residents requiring memory care support in a church-affiliated residential setting, though current regulatory findings require careful family review.

(616) 284-5700

Quality ratings

Measured by Centers for Medicare & Medicaid Services (CMS)

Overall rating Info The Overall CMS Rating combines results from health inspections, staffing levels and quality measures. Health inspections carry the most weight. Staffing and quality scores can increase or decrease the final rating based on performance compared to state and national standards.
▼ 71.8% Below MI avg. ▼ 71.8% Below MI avg.Click the badge to see the full State ranking.Click here to see the full State ranking.
Health Inspection Info Based on the results of the facility's three most recent standard inspections and any complaint investigations. CMS reviews the number, scope, and severity of deficiencies, with more recent findings weighted more heavily.
▼ 70.0% Below MI avg. ▼ 70.0% Below MI avg.Click the badge to see the full State ranking.Click here to see the full State ranking.
Staffing Info Measures average nursing staff hours per resident per day, including Registered Nurses (RNs) and total nursing staff. Ratings are adjusted based on the level of care residents require and are compared to state and national benchmarks.
▼ 10.7% Below MI avg. ▼ 10.7% Below MI avg.Click the badge to see the full State ranking.Click here to see the full State ranking.
Quality Measures Info Based on clinical and physical health indicators reported to CMS, such as hospital readmissions, falls, pressure ulcers, and improvements in mobility. These measures reflect how well residents' health needs are being managed.
▲ 5.0% Above MI avg. ▲ 5.0% Above MI avg.Click the badge to see the full State ranking.Click here to see the full State ranking.

Staffing hours breakdown

Info Daily nursing hours per resident by staff type, reported to CMS. Higher is generally better — compare this facility to state and national averages to see where staffing stands.

Hours per resident per day — compared to Michigan state averages

Total nursing care / resident Info This home is ranked 25th out of 133 homes in Michigan for nurse hours. Total adjusted nursing hours per resident per day, combining RN, LPN, and aide time. CMS adjusts this for case-mix so facilities can be fairly compared.
4h 53m per day
Rank #25 / 133Nurse hours — State benchmarkedThis home is ranked 25th out of 133 homes in Michigan. Shows adjusted nurse hours per resident per day benchmarked to the Michigan average, with a ranking across 133 Michigan facilities. More hours mean more direct care. The national average is about 3.5 hrs; below 3.0 is a red flag.Click the rank badge to see the full State ranking.Click here to see the full State ranking.
This facility Michigan avg (4h 15m per day)
vs Michigan avg
+15%

4 of 6 metrics below state avg

Standout metric Nurse Aide is +8% above state avg
Staff typeHours / Day / Residentvs state avg
Registered Nurse (RN) Info RNs hold the highest nursing license and can assess residents, interpret test results, and direct care plans. More RN hours per day often signals stronger clinical oversight and faster response to health changes. 30m per day ▼ 36% State avg: 46m per day · National avg: 41m per day
LPN / LVN Info Licensed Practical Nurses (LPNs) or Licensed Vocational Nurses (LVNs) deliver routine hands-on care — medication administration, wound dressing, and monitoring vital signs. They work under RN supervision and make up a large share of daily bedside care. 51m per day ▼ 3% State avg: 53m per day · National avg: 52m per day
Nurse Aide Info Certified Nurse Aides (CNAs) provide the most direct day-to-day assistance: bathing, dressing, feeding, and mobility. Nurse aide hours are typically the largest staffing category and directly affect residents' quality of life. 2h 31m per day ▲ 8% State avg: 2h 20m per day · National avg: 2h 20m per day
Weekend Total Nursing Info Combined nursing hours (RN + LPN + Nurse Aide) per resident per day on weekends. Staffing often drops on weekends — this figure reveals whether the facility maintains adequate coverage outside of weekday hours. 3h 34m per day ■ Avg State avg: 3h 31m per day · National avg: 3h 27m per day
Physical Therapist Info Hours per resident per day provided by licensed Physical Therapists (PTs) or PT Assistants. PT services help residents recover mobility after injury or illness and are especially important for post-acute (short-stay) rehabilitation. 2m per day ▼ 42% State avg: 4m per day · National avg: 4m per day
Weekend RN Info Registered nurse hours specifically on weekends. Facilities sometimes reduce RN presence on Saturdays and Sundays — a low weekend RN figure compared to weekday hours can indicate reduced clinical oversight when most administrative staff are absent. 24m per day ▼ 18% State avg: 29m per day · National avg: 29m per day

Capacity and availability

This home usually has availability

Lower occupancy than the Michigan average: 75.8%
Occupancy rate
71.6% Rank #110 / 386Occupancy rate — State benchmarkedThis home is ranked 110th out of 386 homes in Michigan. Shows this facility's occupancy rate versus the Michigan average, with its Statewide rank out of 386. Higher occupancy signals strong local demand and financial stability.Click the rank badge to see the full State ranking.Click here to see the full State ranking.
Avg. Length of Stay
275 days
Years in operation
39 years in operation Rank #13 / 182Years in operation — State benchmarkedThis home is ranked 13th out of 182 homes in Michigan. Shows how long this facility has been in operation compared to other Michigan facilities. Longer operating histories may benefit residents, families, and staff.Click the rank badge to see the full State ranking.Click here to see the full State ranking.
A longer operating history, which may indicate experience navigating regulations and delivering ongoing care.
Walk Score
Walk Score: 27 / 100 Rank #461 / 703Walk Score — State benchmarkedThis home is ranked 461st out of 703 homes in Michigan. Shows how walkable this facility's neighborhood is compared to the average Walk Score across Michigan facilities. Higher scores benefit residents, families, and staff.Click the rank badge to see the full State ranking.Click here to see the full State ranking.
Somewhat walkable. A few nearby services may be reachable on foot, but most trips require transportation.
BBB Rating
BBB Rating: A+ (Not Accredited)
An independent rating from the Better Business Bureau based on factors such as complaint history, transparency, and business practices.
How BBB ratings work

About this community

Awards

Awardscaring_caring_star_2026, place_for_mom_best_of_2024, caring_caring_star_2024, place_for_mom_best_of_2023

Staffing

Key information about the people who lead and staff this community.

Leadership

ContactMr. Tim Bryant, President

Staffing & Medical

1 service
24-Hour Staffing

Additional Policies & Features

HousekeepingYes
Linen ServiceYes

Amenities & Lifestyle

Fitness Center
Library
Salon
Dining Room
Restaurant
Courtyard
Walking Paths
Transportation
Housekeeping
Laundry
Linen Service
ActivitiesThe community offers a variety of activities and events designed to engage residents and foster connections.
Branded ProgramsEnhanced Living
Wellness ProgramEnhanced living gives you both independence and support — all on your terms. With the flexibility to only pay for the assistance you need, you’ll receive customized support services that can be expanded or reduced at any time.
Specific ProgramsActive Adult, Enhanced Living, Community Amenities, Activities & Amenities, Personalized Dining Experience, Photo & Video Gallery

Pricing & Financial Information

Starting Price$1,999 per month

Dining & Nutrition

Food DescriptionThe dining program features chef-prepared meals made from scratch daily, with a focus on creative dishes using fresh ingredients.

Contact StoryPoint Grand Rapids East (Samaritas)

Health Inspection History

Inspections since 2025
Total health inspections 10

Michigan average 6.5


Last Health inspection on Sep 2025

Total health citations
85 Rank #135 / 135Health citations — State benchmarkedThis home is ranked 135th out of 135 homes in Michigan. Shows this facility's total health deficiency citations benchmarked to the Michigan State average, with a ranking across all 135 MI facilities. Lower citation counts earn a better rank.Click the rank badge to see the full State ranking.Click here to see the full State ranking.

Michigan average 33.5

Citations per inspection
8.5 Rank #122 / 135Citations per inspection — State benchmarkedThis home is ranked 122nd out of 135 homes in Michigan. Shows average deficiency citations per CMS inspection for this facility versus the Michigan mean across 135 facilities with citation data. Lower is better.Click the rank badge to see the full State ranking.Click here to see the full State ranking.

Michigan average 5.18


Health citations are formal notices following inspections when they fail to comply with safety and care standards.

31 of 85 citations resulted from standard inspections; 44 of 85 resulted from complaint investigations; and 10 of 85 came from combined inspections (standard and complaint).

Breakdown of citation severity (last 1 year)
Critical health citations
2
567% worse than Michigan average

Michigan average: 0.3


Serious health citations
9
374% worse than Michigan average

Michigan average: 1.9

2 critical citations Michigan average: 0.3

9 serious citations Michigan average: 1.9

74 moderate citations Michigan average: 30.8

0 minor citations Michigan average: 0.5
Citations history (last 1 year)
Abuse/Neglect moderate citation Sep 04, 2025
Corrected

Abuse/Neglect moderate citation Sep 04, 2025
Corrected

Quality of Care moderate citation Sep 04, 2025
Corrected

Quality of Care serious citation Sep 04, 2025
Corrected

Staffing Data

Reporting period: October 1 – December 31, 2025 (Q4 2025). Source: CMS Payroll-Based Journal report.

Total staff 221
Employees 113
Contractors 108
Staff to resident ratio 2.48 : 1
46% more staff per resident than Michigan average
Michigan average ratio: 1.70 : 1 Michigan average ratio: 1.70 : 1See full Michigan ranking
Avg staff/day 49
Average shift 8.2 hours
0% compared with Michigan average
Michigan average: 7.9 hours Michigan average shift: 7.9 hoursSee full Michigan ranking
Total staff hours (quarter) 36,846

Nursing staff breakdown

Q4 2025 · Oct 1 – Dec 31 More info This data comes from the CMS Payroll-Based Journal report covering October 1 – December 31, 2025.
Registered Nurse

Manages medical care and health needs.

RN Staff Info 52 total: 10 full-time employees and 42 contractors. 52
Average shift length Info Average shift length. Calculated as total hours divided by days worked and average staff per day. 7.8 hours
Licensed Practical Nurse

Assists with medical care and medications.

LPN Staff Info 69 total: 17 full-time employees and 52 contractors. 69
Average shift length Info Average shift length. Calculated as total hours divided by days worked and average staff per day. 9.1 hours
Certified Nursing Assistant

Helps with daily care and mobility.

CNA Staff Info All 69 CNA Staff are full-time employees. No contractors work on this role. 69
Average shift length Info Average shift length. Calculated as total hours divided by days worked and average staff per day. 8.6 hours

Contractor staffing

Q4 2025 · Oct 1 – Dec 31 More info This data comes from the CMS Payroll-Based Journal report covering October 1 – December 31, 2025.

Total hours from contractors

12.4%

4,583 contractor hours this quarter

Licensed Practical Nurse: 52 Registered Nurse: 42 Respiratory Therapy Technician: 4 Physical Therapy Aide: 3 Physical Therapy Assistant: 3 Speech Language Pathologist: 2 Qualified Social Worker: 2

Staff by category

Q4 2025 · Oct 1 – Dec 31 More info This data comes from the CMS Payroll-Based Journal report covering October 1 – December 31, 2025.
Certified Nursing Assistant6906920,80492100%8.6
Licensed Practical Nurse1752696,27092100%9.1
Registered Nurse1042523,30292100%7.8
Other Dietary Services Staff8082,2878693%7.6
RN Director of Nursing2027996267%7.8
Clinical Nurse Specialist3035615560%7.9
Physical Therapy Aide0335277683%4.8
Administrator1014806065%8
Occupational Therapy Aide1014806065%8
Speech Language Pathologist0223766267%5.9
Respiratory Therapy Technician0443276571%4.9
Nurse Practitioner1012082628%8
Mental Health Service Worker1011762224%8
Qualified Social Worker0221356065%2.2
Physical Therapy Assistant0331172628%4.5
69 Certified Nursing Assistant
% of Days 100%
69 Licensed Practical Nurse
% of Days 100%
52 Registered Nurse
% of Days 100%
8 Other Dietary Services Staff
% of Days 93%
2 RN Director of Nursing
% of Days 67%
3 Clinical Nurse Specialist
% of Days 60%
3 Physical Therapy Aide
% of Days 83%
1 Administrator
% of Days 65%
1 Occupational Therapy Aide
% of Days 65%
2 Speech Language Pathologist
% of Days 67%
4 Respiratory Therapy Technician
% of Days 71%
1 Nurse Practitioner
% of Days 28%
1 Mental Health Service Worker
% of Days 24%
2 Qualified Social Worker
% of Days 65%
3 Physical Therapy Assistant
% of Days 28%

Penalties and fines

Includes penalties issued in 2023-2025

Federal penalties imposed by CMS for regulatory violations, including civil money penalties (fines) and denials of payment for new Medicare/Medicaid admissions.

Source: CMS Penalties Database (Data as of Jan 2026)

Total fines amount $365K Rank #135 / 136Federal fines — State benchmarkedThis home is ranked 135th out of 136 homes in Michigan. Shows this facility's cumulative CMS federal fine dollars versus the Michigan average among facilities with fines, and where it ranks among 136 facilities in the pool. Lower total dollars mean a better rank.Click the rank badge to see the full State ranking.Click here to see the full State ranking.
380% higher than Michigan average

Michigan average: $76K

Number of fines 3
48% more fines than Michigan average

Michigan average: 2.0

Payment Denials Info Serious action where Medicare and/or Medicaid temporarily stops payments for new residents until issues are fixed. 3
256% more payment denials than Michigan average

Michigan average: 0.8

Fines amount comparison
This facility $365K
Michigan average $76K
Penalty History

Penalties are imposed by CMS for violations of federal nursing home regulations.

4 penalties in the past 3 years

Multiple penalties were reported in the last 3 years.

Payment Denial Info Serious action where Medicare and/or Medicaid temporarily stops payments for new residents until issues are fixed. Aug 18, 2025
51 days
Civil Money Penalty Info Fines imposed for noncompliance, which can be assessed per day or per instance of violation. Jan 14, 2025
$295K
Payment Denial Info Serious action where Medicare and/or Medicaid temporarily stops payments for new residents until issues are fixed. Jan 14, 2025
63 days
Civil Money Penalty Info Fines imposed for noncompliance, which can be assessed per day or per instance of violation. Dec 5, 2023
$8K

Last updated: Jan 2026

Quality of care over time

These measures show how residents usually do over time at this home, based on health outcomes and preventive care.

High-risk clinical events score Info A composite score based on pressure ulcers, falls with injury, weight loss, walking ability decline, and activities of daily living decline. 8.6
In line with Michigan average

Michigan average: 8.4

Functional decline score Info A composite score based on activities of daily living decline, walking ability decline, and incontinence. 17.4
7% worse than Michigan average

Michigan average: 16.3

Long-stay resident measures
Need for Help with Daily Activities Increased Info Percent of long-stay residents whose need for help with daily activities has increased 12.5%
In line with Michigan average

Michigan average: 12.5%

Walking Ability Worsened Info Percent of long-stay residents whose ability to move independently worsened 10.3%
33% better than Michigan average

Michigan average: 15.3%

Low Risk Residents with Bowel/Bladder Incontinence Info Percent of low risk long-stay residents who lose control of their bowels or bladder 29.5%
40% worse than Michigan average

Michigan average: 21.0%

Falls with Major Injury Info Percent of long-stay residents experiencing one or more falls with major injury 6.0%
90% worse than Michigan average

Michigan average: 3.2%

High Risk Residents with Pressure Ulcers Info Percent of long-stay high risk residents with pressure ulcers 3.2%
45% better than Michigan average

Michigan average: 5.7%

Urinary Tract Infection Info Percent of long-stay residents with a urinary tract infection 1.5%
11% better than Michigan average

Michigan average: 1.7%

Lost Too Much Weight Info Percent of long-stay residents who lose too much weight 11.0%
94% worse than Michigan average

Michigan average: 5.7%

Depressive Symptoms Info Percent of long-stay residents who have depressive symptoms 1.4%
64% better than Michigan average

Michigan average: 3.9%

Antipsychotic Use Info Percent of long-stay residents who received an antipsychotic medication 25.7%
72% worse than Michigan average

Michigan average: 15.0%

Pneumococcal Vaccine Info Percent of long-stay residents assessed and appropriately given the pneumococcal vaccine 95.2%
In line with Michigan average

Michigan average: 94.9%

Influenza Vaccine Info Percent of long-stay residents assessed and appropriately given the seasonal influenza vaccine 97.8%
In line with Michigan average

Michigan average: 95.0%

Short-stay resident measures
Pneumococcal Vaccine Info Percent of short-stay residents assessed and appropriately given the pneumococcal vaccine 90.9%
10% better than Michigan average

Michigan average: 82.5%

Antipsychotic medication increase Info Percent of short-stay residents who newly received an antipsychotic medication 0.0%
100% better than Michigan average

Michigan average: 1.4%

Influenza Vaccine Info Percent of short-stay residents assessed and appropriately given the seasonal influenza vaccine 83.2%
5% better than Michigan average

Michigan average: 79.5%

Breakdown by payment type

Medicare

12% of new residents, usually for short-term rehab.

Typical stay 19 days

Private pay

65% of new residents, often for short stays.

Typical stay 4 - 5 months

Medicaid

23% of new residents, often for long-term daily care.

Typical stay 2 years

Facility Characteristics

Source: CMS Long-Term Care Facility Characteristics (Data as of Jan 2026)

Total residents 89
Medicare
3
3.4% of residents
Medicaid
56
62.9% of residents
Private pay or other
30
33.7% of residents
Programs & Services
Residents Group

Residents meet regularly to discuss policies, care quality, and activities

Active Resident Council

Organized group of residents that meets regularly to discuss facility policies, quality of life, and activities.

Finances and operations

Voluntary non-profit community
Home revenue
$12.0M
Operating deficit
-$1.6M
Voluntary non-profit community
Home revenue
$12.0M Rank #102 / 134Revenue — State benchmarkedThis home is ranked 102nd out of 134 homes in Michigan. Shows this facility's annual revenue compared to the Michigan average. Higher revenue generally means more resources for staffing and capital — read alongside Payroll %.Click the rank badge to see the full State ranking.Click here to see the full State ranking.
Operating deficit
-$1.6M
Payroll costs Info The portion of the home's budget spent on staff, including nurses, caregivers, and other employees who support care and operations. Rank #93 / 134Payroll — State benchmarkedThis home is ranked 93rd out of 134 homes in Michigan. Shows total annual staff payroll benchmarked to the Michigan average. Higher payroll investment relative to peers often signals better staffing and less reliance on cheaper contract labor.Click the rank badge to see the full State ranking.Click here to see the full State ranking.
$5.5M
45.9% of revenue Rank #52 / 134Payroll % — State benchmarkedThis home is ranked 52nd out of 134 homes in Michigan. Shows payroll as a percentage of revenue versus the Michigan average. Well-run Michigan facilities typically land around 49–59% — the top third Statewide. Below 25% may signal understaffing or heavy agency use — read with Staffing ratings.Click the rank badge to see the full State ranking.Click here to see the full State ranking.
Other operating costs Info All remaining costs needed to run the home, such as food, utilities, building maintenance, supplies and administrative expenses.
$8.0M
Total costs $13.6M

What does this home offer?

Pets allowed icon
Pets allowed icon

Pets Allowed

Room sizes icon
Room sizes icon

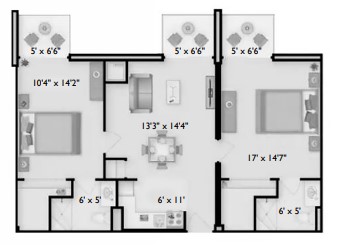
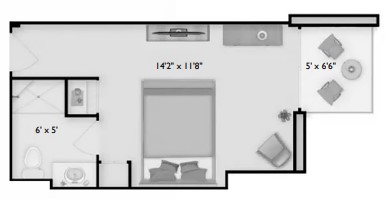
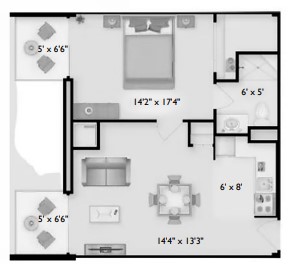
Room Sizes: 269 / 538 / 817 sq. ft

Housing options icon

Housing Options: Studio / 1 Bed / 2 Bed

Building type icon
Building type icon

Building Type: Single-story

Who this home usually serves

TYPE OF STAY

Primarily long-term care, limited rehab

Most residents stay long-term, while a smaller portion are admitted for short-term rehab.

Living Spaces & Floor Plans for StoryPoint Grand Rapids East (Samaritas)

Storypoint Grand Rapids East Samaritas7
Storypoint Grand Rapids East Samaritas6
Storypoint Grand Rapids East Samaritas5

Places of interest near StoryPoint Grand Rapids East (Samaritas)

Address 7.4 miles from city center Info Estimated distance in miles from Grand Rapids's city center to StoryPoint Grand Rapids East (Samaritas)'s address, calculated via Google Maps.

Calculate Travel Distance to StoryPoint Grand Rapids East (Samaritas)

Add your location

Address

Financial Assistance for
Nursing Home in Michigan

StoryPoint Grand Rapids East (Samaritas) is located in Grand Rapids, Michigan.
Here are the financial assistance programs available to residents in Michigan.

Get Financial aid guidance

MI Choice Waiver

Michigan Medicaid MI Choice Waiver

Age 65+ or disabled
General Michigan resident, Medicaid- eligible, nursing home-level care need.
Income Limits (2025) ~$2,829/month 300% FBR, individual
Asset Limits $2,000 (individual), $3,000 (couple).
MI

Delivered through regional waiver agents; waitlists possible.

Benefits
Personal care (5-7 hours/day) Respite care (240 hours/year) Home modifications ($1,500 avg.) Adult day care ($65/day)

Home Help Program

Michigan Home Help

Age 65+ or disabled
General Michigan resident, Medicaid- eligible or low-income.
Income Limits ~$1,732/month individual, Medicaid threshold
Asset Limits $2,000 individual
MI

Can hire family caregivers; less intensive than waiver.

Benefits
Personal care (up to 60 hours/month) Homemaker services Respite (varies)

Program of All-Inclusive Care for the Elderly (PACE)

Michigan PACE

Age 55+
General Michigan resident, nursing home-level care need, safe with PACE support.
Income Limits (2025) ~$2,829/month (Medicaid-eligible); private pay option available.
Asset Limits $2,000 (individual), $3,000 (couple).
MI

16 PACE centers (e.g., Ingham, Wayne counties); expanding slowly.

Benefits
Personal care (5-7 hours/day) Medical care Meals Transportation Therapy Respite

Medicare Savings Program (MSP)

Michigan Medicare Savings Program

Age 65+ or disabled
General Michigan resident, Medicare Part A/B.
Income Limits (2025) ~$2,510/month (QMB), ~$3,380/month (SLMB), ~$3,598/month (QI)—individual.
Asset Limits $9,430 (individual), $14,130 (couple).
MI

Three tiers; no waitlist; includes Extra Help for Part D.

Benefits
Covers Part B premiums ($174.70/month) Deductibles ($240/year) Copays (~20%)

National Family Caregiver Support Program (NFCSP) Respite

Michigan NFCSP Respite Care

Age
General Caregivers of 60+ needing care or 55+ caregivers of others; Michigan resident; functional needs (2+ ADLs).
Income Limits (2025) Prioritizes ~$24,980/year (individual); no strict cap.
Asset Limits Not assessed; need-based.
MI

16 AAAs; prioritizes low-income, rural caregivers.

Benefits
Respite (4-6 hours/week or 5 days/year) Adult day care ($60/day) Caregiver training

VA Aid and Attendance (A&A) and Housebound Benefits

Michigan VA Aid and Attendance/Housebound

Age 65+ or disabled veteran/spouse
General Michigan resident, wartime service, need for ADL help (A&A) or homebound.
Income Limits (2025) Net income < ~$1,984/month (veteran with dependent, A&A); pension offsets income.
Asset Limits ~$155,356 net worth limit
MI

High veteran demand in urban/rural areas.

Benefits
Cash (~$1,433-$2,642/month veteran, ~$951-$1,318 spouse) for care costs

Frequently Asked Questions about StoryPoint Grand Rapids East (Samaritas)

What neighborhood is StoryPoint Grand Rapids East (Samaritas) in?

StoryPoint Grand Rapids East (Samaritas) is in the Millbrook neighborhood of Grand Rapids.

Is StoryPoint Grand Rapids East (Samaritas) in a walkable area?

StoryPoint Grand Rapids East (Samaritas) has a walk score of 27. Somewhat walkable. A few nearby services may be reachable on foot, but most trips require transportation.

Are there photos of StoryPoint Grand Rapids East (Samaritas)?

Yes — there are 4 photos of StoryPoint Grand Rapids East (Samaritas) in the photo gallery on this page.

What is the address of StoryPoint Grand Rapids East (Samaritas)?

StoryPoint Grand Rapids East (Samaritas) is located at 2000 32nd St SE, Grand Rapids, MI 49508, United States.

What is the phone number of StoryPoint Grand Rapids East (Samaritas)?

(616) 284-5700 will put you in contact with the team at StoryPoint Grand Rapids East (Samaritas).

Is StoryPoint Grand Rapids East (Samaritas) Medicare or Medicaid certified?

Yes — StoryPoint Grand Rapids East (Samaritas) is a CMS-certified provider of Medicare and Medicaid.

Guides for Better Senior Living

Care Cost Calculator: See Prices in Your Area

Nursing Home Data Explorer

Don’t Wait Too Long: 7 Red Flag Signs Your Parent Needs Assisted Living Now

The True Cost of Assisted Living in 2025 – And How Families Are Paying For It

Understanding Senior Living Costs: Pricing Models, Discounts & Financial Assistance

Explore Open Rooms
1 Contact details
2 What type of senior care service are you looking for?
3 What budget do you have in mind for senior care?
4 How soon do you need to find care?
5 Additional details

Thank you for your interest!

Our team will be in touch shortly to help with next steps.