Sun Wood Senior
Nursing Home & Independent Living · Peoria, AZ
CMS overall rating Info The Overall CMS Rating is scored from 1 to 5 stars and combines results from health inspections, staffing levels, and quality measures. Health inspections carry the most weight. Staffing and quality scores can increase or decrease the final rating based on performance compared to state and national standards.

Sun Wood Senior

Nursing Home & Independent Living · Peoria, AZ
CMS overall rating Info The Overall CMS Rating is scored from 1 to 5 stars and combines results from health inspections, staffing levels, and quality measures. Health inspections carry the most weight. Staffing and quality scores can increase or decrease the final rating based on performance compared to state and national standards.
Calculator: See prices in your area
Sun Wood Senior accepts Medicare, Medicaid, and private pay.

Overview of Sun Wood Senior

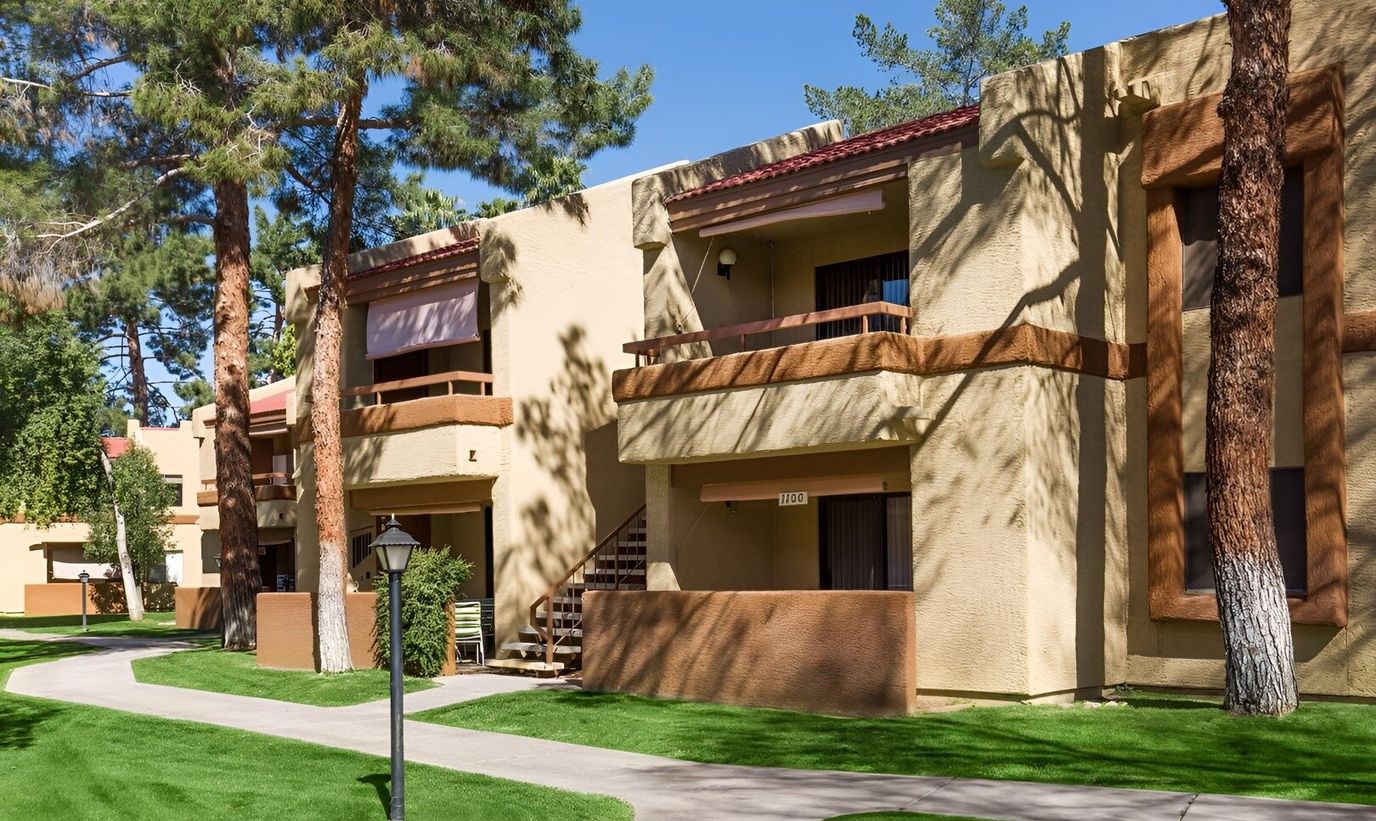
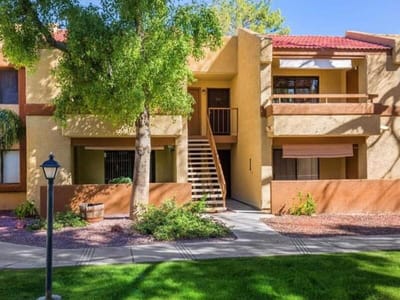
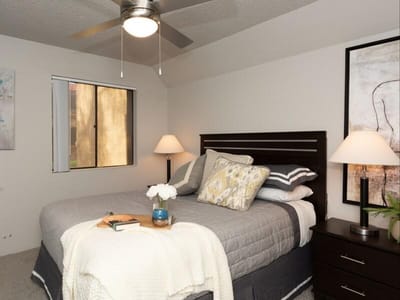
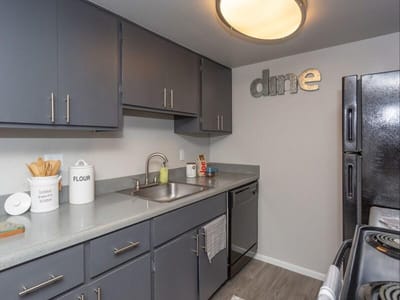
Enjoy the best of your golden years at Sun Wood Senior, a distinct community in Peoria, AZ, offering independent living. With specially designed and spacious one- and two-bedroom floor plans, residents find the accommodation that best matches their preferences. The community’s convenient apartment features ensure residents enjoy a worry-free lifestyle. N

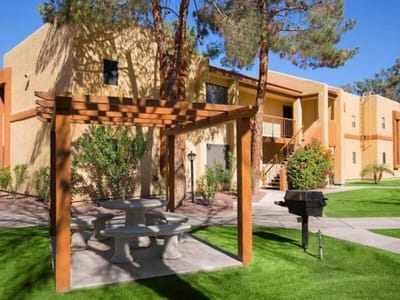
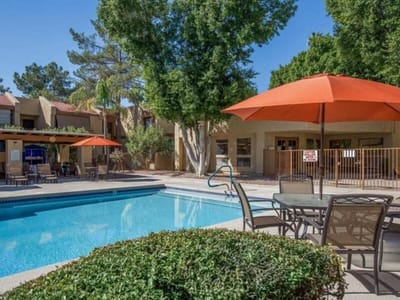
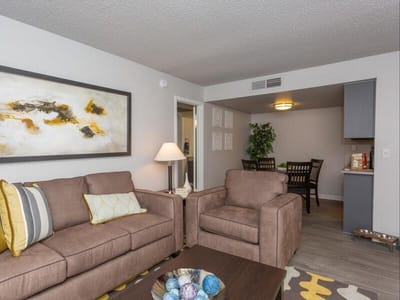
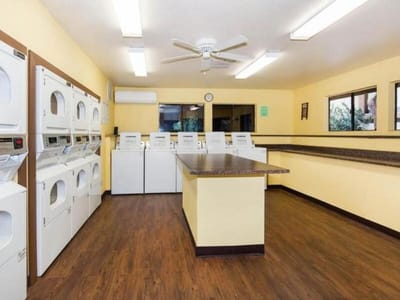
Residents will not feel lonely with plenty of recreational opportunities, with the community’s proximity to entertainment and shopping amenities. Tasty restaurants nearby also provide plenty of dining options to meet residents’ dietary needs and preferences. The community is equipped with state-of-the-art amenities, including a business center, a clubhouse, a spa, a heated swimming pool, and a library, creating the ideal setting for a worry-free retirement.

(623) 972-0702

Quality ratings

Measured by Centers for Medicare & Medicaid Services (CMS)

Overall rating Info The Overall CMS Rating combines results from health inspections, staffing levels and quality measures. Health inspections carry the most weight. Staffing and quality scores can increase or decrease the final rating based on performance compared to state and national standards.
▲ 50.8% Above AZ avg. ▲ 50.8% Above AZ avg.Click the badge to see the full State ranking.Click here to see the full State ranking.
Health Inspection Info Based on the results of the facility's three most recent standard inspections and any complaint investigations. CMS reviews the number, scope, and severity of deficiencies, with more recent findings weighted more heavily.
▲ 44.4% Above AZ avg. ▲ 44.4% Above AZ avg.Click the badge to see the full State ranking.Click here to see the full State ranking.
Staffing Info Measures average nursing staff hours per resident per day, including Registered Nurses (RNs) and total nursing staff. Ratings are adjusted based on the level of care residents require and are compared to state and national benchmarks.
At AZ avg. At AZ avg.Click the badge to see the full State ranking.Click here to see the full State ranking.
Quality Measures Info Based on clinical and physical health indicators reported to CMS, such as hospital readmissions, falls, pressure ulcers, and improvements in mobility. These measures reflect how well residents' health needs are being managed.
▲ 10.8% Above AZ avg. ▲ 10.8% Above AZ avg.Click the badge to see the full State ranking.Click here to see the full State ranking.

Staffing hours breakdown

Info Daily nursing hours per resident by staff type, reported to CMS. Higher is generally better — compare this facility to state and national averages to see where staffing stands.

Hours per resident per day — compared to Arizona state averages

Total nursing care / resident Info This home is ranked 36th out of 72 homes in Arizona. Total adjusted nursing hours per resident per day, combining RN, LPN, and aide time. CMS adjusts this for case-mix so facilities can be fairly compared.
3h 54m per day
Rank #36 / 72Nurse hours — State benchmarkedThis home is ranked 36th out of 72 homes in Arizona. Shows adjusted nurse hours per resident per day benchmarked to the Arizona average, with a ranking across 72 Arizona SNFs. More hours mean more direct care. The national average is about 3.5 hrs; below 3.0 is a red flag.Click the rank badge to see the full State ranking.Click here to see the full State ranking.
This facility Arizona avg (4h 4m per day)
vs Arizona avg
-4%
Staff type Hours / Day / Resident vs state avg
Weekend Total Nursing Info Combined nursing hours (RN + LPN + Nurse Aide) per resident per day on weekends. Staffing often drops on weekends — this figure reveals whether the facility maintains adequate coverage outside of weekday hours. 3h 0m per day

Types of Care at Sun Wood Senior

Independent Living

Capacity and availability

This home usually has limited availability

Occupancy between 85% and 95% suggests balanced demand.

Higher occupancy than the Arizona average: 72.7%
Occupancy rate 89.2% Rank #15 / 77Occupancy rate — State benchmarkedThis home is ranked 15th out of 77 homes in Arizona. Shows this facility's occupancy rate versus the Arizona average, with its Statewide rank out of 77. Higher occupancy signals strong local demand and financial stability.Click the rank badge to see the full State ranking.Click here to see the full State ranking.
Avg. Length of Stay 36 days
Occupancy rate
89.2% Rank #15 / 77Occupancy rate — State benchmarkedThis home is ranked 15th out of 77 homes in Arizona. Shows this facility's occupancy rate versus the Arizona average, with its Statewide rank out of 77. Higher occupancy signals strong local demand and financial stability.Click the rank badge to see the full State ranking.Click here to see the full State ranking.
Avg. Length of Stay
36 days
Walk Score
Walk Score: 15 / 100 Rank #618 / 818Walk Score — State benchmarkedThis home is ranked 618th out of 818 homes in Arizona. Shows how walkable this facility's neighborhood is compared to the average Walk Score across Arizona SNFs. Higher scores benefit residents, families, and staff.Click the rank badge to see the full State ranking.Click here to see the full State ranking.
Car-dependent. Most errands require a car, with limited nearby walkable options.

Contact Sun Wood Senior

Staffing Data

Reporting period: October 1 – December 31, 2025 (Q4 2025). Source: CMS Payroll-Based Journal report.

Total staff 235
Employees 229
Contractors 6
Staff to resident ratio 1.32:1
27% worse than Arizona average
Arizona average ratio: 1.80:1 Arizona average ratio: 1.80:1See full Arizona ranking
Avg staff/day 91
Average shift 8.3 hours
0% compared with Arizona average
Arizona average: 8.5 hours Arizona average shift: 8.5 hoursSee full Arizona ranking
Total staff hours (quarter) 69,653

Nursing staff breakdown

Q4 2025 · Oct 1 – Dec 31 More info This data comes from the CMS Payroll-Based Journal report covering October 1 – December 31, 2025.
Registered Nurse

Manages medical care and health needs.

RN Staff 19
Average shift length Info Average shift length. Calculated as total hours divided by days worked and average staff per day. 9.6 hours

This role is partially covered by contractors.

Licensed Practical Nurse

Assists with medical care and medications.

LPN Staff 43
Average shift length Info Average shift length. Calculated as total hours divided by days worked and average staff per day. 9.6 hours

This role is partially covered by contractors.

Certified Nursing Assistant

Helps with daily care and mobility.

CNA Staff 114
Average shift length Info Average shift length. Calculated as total hours divided by days worked and average staff per day. 8.1 hours

No contractors work on this role.

Contractor staffing

Q4 2025 · Oct 1 – Dec 31 More info This data comes from the CMS Payroll-Based Journal report covering October 1 – December 31, 2025.

Total hours from contractors

0.2%

159 contractor hours this quarter

Licensed Practical Nurse: 3 Registered Nurse: 2 Occupational Therapy Aide: 1

Staff by category

Q4 2025 · Oct 1 – Dec 31 More info This data comes from the CMS Payroll-Based Journal report covering October 1 – December 31, 2025.
Certified Nursing Assistant 114 0 114 34,437 92 100% 8.1
Licensed Practical Nurse 40 3 43 14,749 92 100% 9.6
Registered Nurse 17 2 19 6,403 92 100% 9.6
Speech Language Pathologist 8 0 8 3,013 87 95% 7.5
Dental Services Staff 7 0 7 2,234 74 80% 7.8
Physical Therapy Aide 6 0 6 1,485 78 85% 7.6
Qualified Social Worker 8 0 8 1,108 77 84% 7.5
Respiratory Therapy Technician 6 0 6 979 78 85% 6.9
Physical Therapy Assistant 6 0 6 904 74 80% 6.6
Other Dietary Services Staff 5 0 5 891 90 98% 6.2
RN Director of Nursing 3 0 3 635 66 72% 8.6
Respiratory Therapist 2 0 2 576 64 70% 7.6
Nurse Practitioner 1 0 1 549 61 66% 9
Administrator 1 0 1 528 66 72% 8
Dietitian 1 0 1 440 55 60% 8
Therapeutic Recreation Specialist 1 0 1 422 53 58% 8
Clinical Nurse Specialist 3 0 3 181 24 26% 7.2
Occupational Therapy Aide 0 1 1 120 28 30% 4.3
114 Certified Nursing Assistant
% of Days 100%
43 Licensed Practical Nurse
% of Days 100%
19 Registered Nurse
% of Days 100%
8 Speech Language Pathologist
% of Days 95%
7 Dental Services Staff
% of Days 80%
6 Physical Therapy Aide
% of Days 85%
8 Qualified Social Worker
% of Days 84%
6 Respiratory Therapy Technician
% of Days 85%
6 Physical Therapy Assistant
% of Days 80%
5 Other Dietary Services Staff
% of Days 98%
3 RN Director of Nursing
% of Days 72%
2 Respiratory Therapist
% of Days 70%
1 Nurse Practitioner
% of Days 66%
1 Administrator
% of Days 72%
1 Dietitian
% of Days 60%
1 Therapeutic Recreation Specialist
% of Days 58%
3 Clinical Nurse Specialist
% of Days 26%
1 Occupational Therapy Aide
% of Days 30%

Penalties and fines

Federal penalties imposed by CMS for regulatory violations, including civil money penalties (fines) and denials of payment for new Medicare/Medicaid admissions.

Source: CMS Penalties Database

No penalties in the past 3 years

No civil money penalties or payment denials were reported in the last 3 years.

Quality of care over time

These measures show how residents usually do over time at this home, based on health outcomes and preventive care.

High-risk clinical events score Info A composite score based on pressure ulcers, falls with injury, weight loss, walking ability decline, and activities of daily living decline. 8.5
12% worse than Arizona average

Arizona average: 7.6

Functional decline score Info A composite score based on activities of daily living decline, walking ability decline, and incontinence. 18.7
16% worse than Arizona average

Arizona average: 16.1

Long-stay resident measures
Need for Help with Daily Activities Increased Info Percent of long-stay residents whose need for help with daily activities has increased 9.8%
12% better than Arizona average

Arizona average: 11.2%

Walking Ability Worsened Info Percent of long-stay residents whose ability to move independently worsened 18.5%
17% worse than Arizona average

Arizona average: 15.8%

Low Risk Residents with Bowel/Bladder Incontinence Info Percent of low risk long-stay residents who lose control of their bowels or bladder 27.7%
33% worse than Arizona average

Arizona average: 20.8%

Falls with Major Injury Info Percent of long-stay residents experiencing one or more falls with major injury 1.3%
38% better than Arizona average

Arizona average: 2.1%

High Risk Residents with Pressure Ulcers Info Percent of long-stay high risk residents with pressure ulcers 5.6%
11% worse than Arizona average

Arizona average: 5.1%

Urinary Tract Infection Info Percent of long-stay residents with a urinary tract infection 0.8%
42% better than Arizona average

Arizona average: 1.3%

Lost Too Much Weight Info Percent of long-stay residents who lose too much weight 7.1%
30% worse than Arizona average

Arizona average: 5.4%

Depressive Symptoms Info Percent of long-stay residents who have depressive symptoms 0.3%
93% better than Arizona average

Arizona average: 4.5%

Antipsychotic Use Info Percent of long-stay residents who received an antipsychotic medication 8.5%
18% better than Arizona average

Arizona average: 10.3%

Pneumococcal Vaccine Info Percent of long-stay residents assessed and appropriately given the pneumococcal vaccine 97.7%
In line with Arizona average

Arizona average: 97.2%

Influenza Vaccine Info Percent of long-stay residents assessed and appropriately given the seasonal influenza vaccine 97.2%
In line with Arizona average

Arizona average: 94.6%

Short-stay resident measures
Pneumococcal Vaccine Info Percent of short-stay residents assessed and appropriately given the pneumococcal vaccine 99.1%
8% better than Arizona average

Arizona average: 91.5%

Antipsychotic medication increase Info Percent of short-stay residents who newly received an antipsychotic medication 1.2%
17% worse than Arizona average

Arizona average: 1.0%

Influenza Vaccine Info Percent of short-stay residents assessed and appropriately given the seasonal influenza vaccine 91.1%
In line with Arizona average

Arizona average: 87.3%

Breakdown by payment type

Medicare

11% of new residents, usually for short-term rehab.

Typical stay 21 days

Private pay

49% of new residents, often for short stays.

Typical stay 16 days

Medicaid

40% of new residents, often for long-term daily care.

Typical stay 2 - 3 months

Facility Characteristics

Source: CMS Long-Term Care Facility Characteristics (Data as of Jan 2026)

Total residents 178
Medicare
178
100% of residents
Programs & Services
Residents Group

Residents meet regularly to discuss policies, care quality, and activities

Active Resident Council

Organized group of residents that meets regularly to discuss facility policies, quality of life, and activities.

Finances and operations

Privately-owned community
Operated by a business corporation.
Home revenue
$17.2M
Profit
$5.9M
Privately-owned community Operated by a business corporation.
Home revenue
$17.2M Rank #27 / 80Revenue — State benchmarkedThis home is ranked 27th out of 80 homes in Arizona. Shows this facility's annual revenue compared to the Arizona SNF average. Higher revenue generally means more resources for staffing and capital — read alongside Payroll %.Click the rank badge to see the full State ranking.Click here to see the full State ranking.
Profit
$5.9M
Payroll costs Info The portion of the home's budget spent on staff, including nurses, caregivers, and other employees who support care and operations. Rank #9 / 80Payroll — State benchmarkedThis home is ranked 9th out of 80 homes in Arizona. Shows total annual staff payroll benchmarked to the Arizona average. Higher payroll investment relative to peers often signals better staffing and less reliance on cheaper contract labor.Click the rank badge to see the full State ranking.Click here to see the full State ranking.
$13.4M
78% of revenue Rank #5 / 80Payroll % — State benchmarkedThis home is ranked 5th out of 80 homes in Arizona. Shows payroll as a percentage of revenue versus the Arizona average. Well-run Arizona SNFs typically land around 58–71% — the top third Statewide. Below 25% may signal understaffing or heavy agency use — read with Staffing ratings.Click the rank badge to see the full State ranking.Click here to see the full State ranking.
Other operating costs Info All remaining costs needed to run the home, such as food, utilities, building maintenance, supplies and administrative expenses.
-$2.2M
Total costs $11.2M

What does this home offer?

Minimum age icon
Minimum age icon

Minimum Age: 55 Years Old

Room sizes icon
Room sizes icon

Room Sizes: 683 / 684 / 991 sq. ft

Housing options icon

Housing Options: 1 Bed / 2 Bed

Building type icon
Building type icon

Building Type: 2-story

Social and recreational activities icon

Social and Recreational Activities

Swimming pool icon
Swimming pool icon

Swimming Pool

Parking Available icon

Parking Available

Who this home usually serves

TYPE OF STAY

Mix of rehab and long-term care

This home supports both short-term rehab and long-term care, with residents staying for a wide range of durations.

Places of interest near Sun Wood Senior

Address 2.9 miles from city center Info Estimated distance in miles from Peoria's city center to Sun Wood Senior's address, calculated via Google Maps.

Calculate Travel Distance to Sun Wood Senior

Add your location

Address

Financial Assistance for
Nursing Home in Arizona

Sun Wood Senior is located in Peoria, Arizona.
Here are the financial assistance programs available to residents in Arizona.

Get Financial aid guidance

Arizona Long Term Care System

ALTCS

Age 65+ or disabled
General Arizona resident, Medicaid-eligible, nursing home-level care need.
Income Limits (2025) ~$2,829/month 300% FBR, individual
Asset Limits $2,000 (individual), $3,000 (couple).
AZ

Covers tribal members; rural outreach.

Benefits
In-home care (6-8 hours/day) Assisted living Nursing home care Medical services Transportation (10 trips/month)

Non-Medical Home and Community Based Services

AZ DES Non-Medical HCBS

Age 60+
General Arizona resident, at risk of institutionalization.
Income Limits ~$2,000/month individual, varies
Asset Limits $10,000 individual
AZ

Limited funding; waitlists common.

Benefits
Homemaker services (3-5 hours/week) Respite care (up to 10 days/year) Adult day care (~$60/day)

Weatherization Assistance Program (WAP)

AZ WAP

Age 60+ priority
General Arizona resident, own/rent home, low-income.
Income Limits (2025) ~$2,510/month 200% of poverty level, individual
Asset Limits Not applicable; income-focused.
AZ

High demand in rural desert areas; limited annual funds.

Benefits
Insulation Weather stripping HVAC repairs (avg. $500-$1,000/year savings)

Section 202 Supportive Housing for the Elderly

AZ Section 202

Age 62+
General Arizona resident, very low income, able to live independently with support.
Income Limits (2025) ~$1,645/month 50% of area median income, individual, varies by county
Asset Limits $10,000 individual, excludes home if owned
AZ

Limited units; high demand in metro areas like Phoenix.

Benefits
Subsidized rent (30% of income, e.g., $300-$500/month) On-site services (housekeeping, transportation, ~$200/month value)

Arizona CARES Program

AZ CARES

Age
General Caregivers of Arizona residents 60+ needing help with 3+ daily activities; no caregiver age limit.
Income Limits No strict limit; cost-sharing above ~$2,500/month threshold.
Asset Limits Not applicable; need-based.
AZ

Focus on rural access; complements ALTCS respite.

Benefits
Respite care (up to 10 days/year) Counseling (4-6 sessions/year) Training (2-3 workshops/year) Supplies (~$200/year)

AZ DES Non-Medical Home and Community Based Services (HCBS)

AZ DES Non-Medical HCBS

Age 60+ or disabled
General Arizona resident, need assistance with daily activities, not eligible for Medicaid/ALTCS.
Income Limits Above Medicaid threshold but low-income ~$1,500-$2,500/month, varies by region
Asset Limits Not specified; income-driven eligibility.
AZ

Targets those ineligible for ALTCS; prioritizes rural and tribal areas.

Benefits
Homemaker services (3-5 hours/week) Personal care (limited hours) Respite care (up to 10 days/year) Transportation (~5 trips/month)

Compare Nursing Home around Peoria

3 facilities compared · CMS & AZ Dept. of Health data

Filter by care type
Sun Wood Senior
NH

Nursing Home Licensed facility providing 24/7 skilled nursing care for residents with complex, ongoing medical needs. Staffed by RNs, LPNs, and CNAs. Inspected and star-rated annually by CMS. Accepts Medicare (short-term rehab) and Medicaid (long-term care).

IL

Independent Living Lifestyle-focused communities for older adults offering dining, activities, and transportation with minimal personal care. Best for active, independent seniors who want community without medical support.

Peoria 189 89.2% +23% 3.90 -19% -4% $0 12 2.0 - 152 - 15 Slp Coronado, LLC $17.2M $13.4M 78% 35132
Immanuel Campus of Care
NH

Nursing Home Licensed facility providing 24/7 skilled nursing care for residents with complex, ongoing medical needs. Staffed by RNs, LPNs, and CNAs. Inspected and star-rated annually by CMS. Accepts Medicare (short-term rehab) and Medicaid (long-term care).

AL

Assisted Living A licensed, long-term care setting for seniors or individuals with disabilities who need help with daily activities — like bathing, dressing, and medication management — but not 24-hour skilled nursing. Offers housing, meals, and around-the-clock support while aiming to maximize resident independence.

IL

Independent Living Lifestyle-focused communities for older adults offering dining, activities, and transportation with minimal personal care. Best for active, independent seniors who want community without medical support.

Peoria 228 76.6% +5% 5.84 -47% +44% $18.5k 37 2.0 2 162 A+ 28 Coppersands Inc $36.2M $17.8M 49.1% 35250
Sierra Winds -
NH

Nursing Home Licensed facility providing 24/7 skilled nursing care for residents with complex, ongoing medical needs. Staffed by RNs, LPNs, and CNAs. Inspected and star-rated annually by CMS. Accepts Medicare (short-term rehab) and Medicaid (long-term care).

AL

Assisted Living A licensed, long-term care setting for seniors or individuals with disabilities who need help with daily activities — like bathing, dressing, and medication management — but not 24-hour skilled nursing. Offers housing, meals, and around-the-clock support while aiming to maximize resident independence.

IL

Independent Living Lifestyle-focused communities for older adults offering dining, activities, and transportation with minimal personal care. Best for active, independent seniors who want community without medical support.

Peoria 30 66.7% -8% - - - - +9% - - - - - - A- 47 Shannon Brown $15.6M $6.6M 42.2% 35231

Frequently Asked Questions about Sun Wood Senior

Is Sun Wood Senior in a walkable area?

Sun Wood Senior has a walk score of 15. Car-dependent. Most errands require a car, with limited nearby walkable options.

What is the address of Sun Wood Senior?

Sun Wood Senior is located at 9415 N 99th Ave, Peoria, AZ 85345.

What is the phone number of Sun Wood Senior?

(623) 972-0702 will put you in contact with the team at Sun Wood Senior.

Is Sun Wood Senior Medicare or Medicaid certified?

Yes — Sun Wood Senior is a CMS-certified provider of Medicare and Medicaid.

Guides for Better Senior Living

Care Cost Calculator: See Prices in Your Area

Nursing Home Data Explorer

Don’t Wait Too Long: 7 Red Flag Signs Your Parent Needs Assisted Living Now

The True Cost of Assisted Living in 2025 – And How Families Are Paying For It

Understanding Senior Living Costs: Pricing Models, Discounts & Financial Assistance

Explore Open Rooms
1 Contact details
2 What type of senior care service are you looking for?
3 What budget do you have in mind for senior care?
4 How soon do you need to find care?
5 Additional details

Thank you for your interest!

Our team will be in touch shortly to help with next steps.