Sunrise at Orchard
Nursing Home, Assisted Living & Memory Care · Littleton, CO
CMS overall rating Info CMS (the Centers for Medicare & Medicaid Services) is the federal agency that rates nursing home quality. Its Overall Rating runs from 1 to 5 stars, combining health inspections, staffing, and quality measures, with inspections weighted most heavily.

Sunrise at Orchard

Nursing Home, Assisted Living & Memory Care · Littleton, CO
CMS overall rating Info CMS (the Centers for Medicare & Medicaid Services) is the federal agency that rates nursing home quality. Its Overall Rating runs from 1 to 5 stars, combining health inspections, staffing, and quality measures, with inspections weighted most heavily.
Calculator: See prices in your area
Sunrise at Orchard accepts Medicare, Medicaid, and private pay.

Overview of Sunrise at Orchard

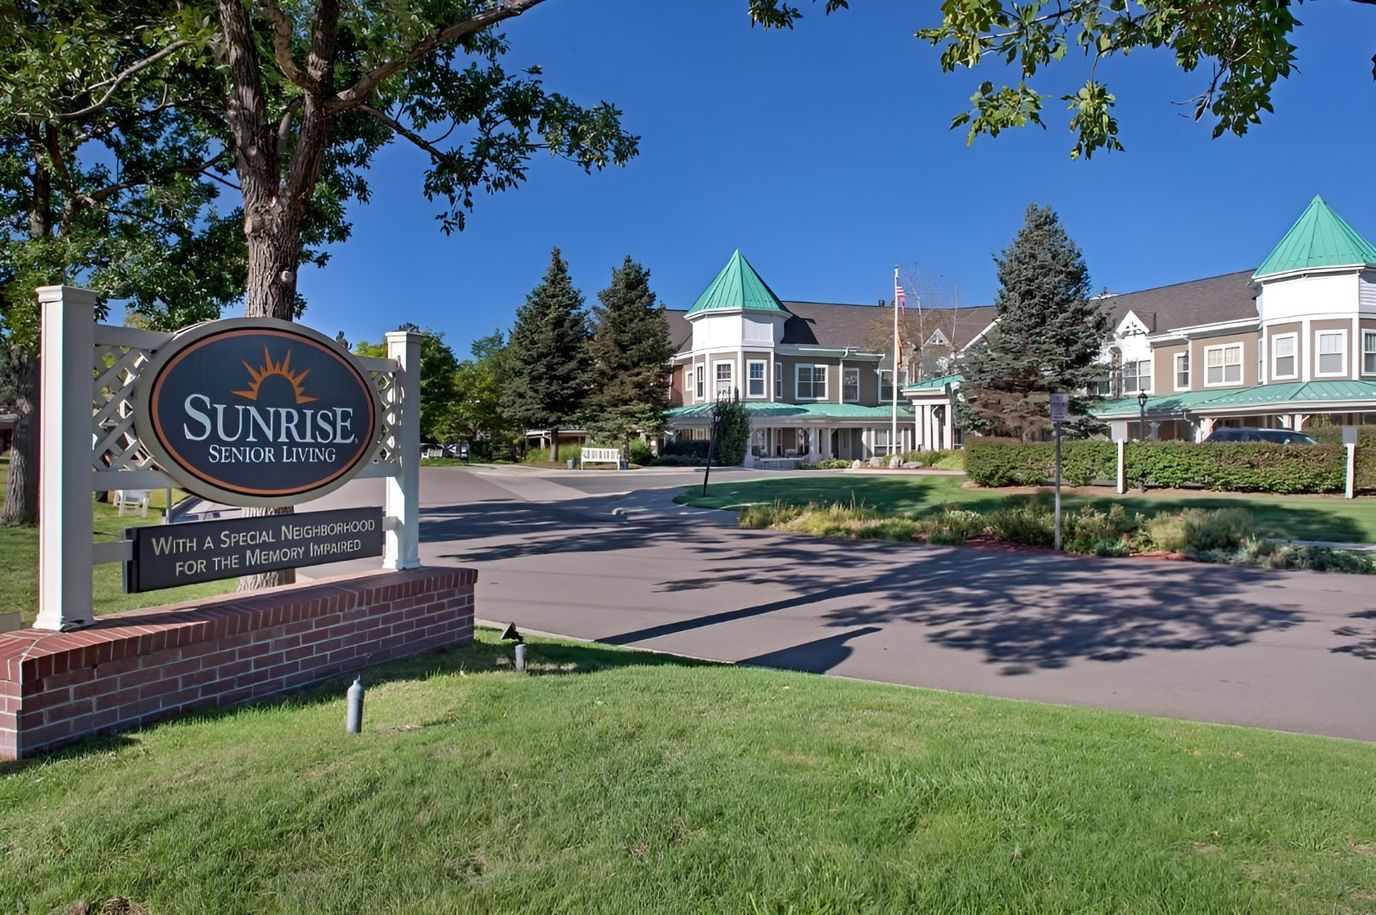
A cozy and welcoming senior living community in Littleton, CO, Sunrise at Orchard provides various levels of care, including assisted living, memory care, and short-term stays. With a choice of studio, one-bedroom, and two-bedroom apartments, seniors can find the perfect home to suit their needs and preferences. Residents can also enjoy a range of activities and amenities, such as well-manicured walking paths, a cozy fireplace lounge, and pet-friendly spaces.

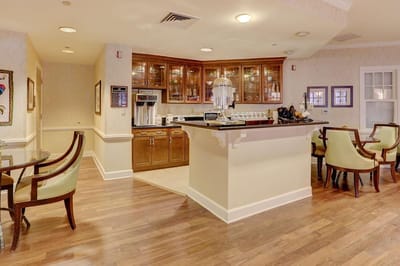
Sunrise at Orchard is dedicated to creating a warm, supportive community where residents can live meaningful lives. The community features trained team members available 24/7, activity rooms, social areas, a bistro for snacks, and weekly housekeeping. Additional amenities include scheduled transportation, monthly wellness visits by a licensed nurse, and advanced electronic health records. Sunrise at Orchard aims to enhance the lives of its residents through comprehensive services and engaging programs.

(303) 773-1609

Quality ratings

Measured by Centers for Medicare & Medicaid Services (CMS)

Overall rating Info The Overall CMS Rating combines results from health inspections, staffing levels and quality measures. Health inspections carry the most weight. Staffing and quality scores can increase or decrease the final rating based on performance compared to state and national standards.
▲ 26.2% Above CO avg. ▲ 26.2% Above CO avg.CO average: 3.2Click the badge to see the full State ranking.Click here to see the full State ranking.
Health Inspection Info Based on the results of the facility's three most recent standard inspections and any complaint investigations. CMS reviews the number, scope, and severity of deficiencies, with more recent findings weighted more heavily.
▲ 42.9% Above CO avg. ▲ 42.9% Above CO avg.CO average: 2.8Click the badge to see the full State ranking.Click here to see the full State ranking.
Staffing Info Measures average nursing staff hours per resident per day, including Registered Nurses (RNs) and total nursing staff. Ratings are adjusted based on the level of care residents require and are compared to state and national benchmarks.
▼ 4.5% Below CO avg. ▼ 4.5% Below CO avg.CO average: 3.1Click the badge to see the full State ranking.Click here to see the full State ranking.
Quality Measures Info Based on clinical and physical health indicators reported to CMS, such as hospital readmissions, falls, pressure ulcers, and improvements in mobility. These measures reflect how well residents' health needs are being managed.
▼ 2.9% Below CO avg. ▼ 2.9% Below CO avg.CO average: 4.1Click the badge to see the full State ranking.Click here to see the full State ranking.

Staffing hours breakdown

Info Daily nursing hours per resident by staff type, reported to CMS. Higher is generally better — compare this facility to state and national averages to see where staffing stands.

Hours per resident per day — compared to Colorado state averages

Total nursing care / resident Info This home is ranked 30th out of 177 homes in Colorado for nurse hours. Total adjusted nursing hours per resident per day, combining RN, LPN, and aide time. CMS adjusts this for case-mix so facilities can be fairly compared.
4h 24m per day
Rank #30 / 177Nurse hours — State benchmarkedThis home is ranked 30th out of 177 homes in Colorado. Shows adjusted nurse hours per resident per day benchmarked to the Colorado average, with a ranking across 177 Colorado facilities. More hours mean more direct care. The national average is about 3.5 hrs; below 3.0 is a red flag.Click the rank badge to see the full State ranking.Click here to see the full State ranking.
This facility Colorado avg (3h 51m per day)
vs Colorado avg
+14%

3 of 6 metrics below state avg

Standout metric LPN / LVN is +56% above state avg
Staff typeHours / Day / Residentvs state avg
Registered Nurse (RN) Info RNs hold the highest nursing license and can assess residents, interpret test results, and direct care plans. More RN hours per day often signals stronger clinical oversight and faster response to health changes. 30m per day ▼ 40% State avg: 49m per day · National avg: 41m per day
LPN / LVN Info Licensed Practical Nurses (LPNs) or Licensed Vocational Nurses (LVNs) deliver routine hands-on care — medication administration, wound dressing, and monitoring vital signs. They work under RN supervision and make up a large share of daily bedside care. 1h 4m per day ▲ 56% State avg: 41m per day · National avg: 52m per day
Nurse Aide Info Certified Nurse Aides (CNAs) provide the most direct day-to-day assistance: bathing, dressing, feeding, and mobility. Nurse aide hours are typically the largest staffing category and directly affect residents' quality of life. 2h 13m per day ■ Avg State avg: 2h 11m per day · National avg: 2h 20m per day
Weekend Total Nursing Info Combined nursing hours (RN + LPN + Nurse Aide) per resident per day on weekends. Staffing often drops on weekends — this figure reveals whether the facility maintains adequate coverage outside of weekday hours. 3h 4m per day ▼ 6% State avg: 3h 16m per day · National avg: 3h 27m per day
Physical Therapist Info Hours per resident per day provided by licensed Physical Therapists (PTs) or PT Assistants. PT services help residents recover mobility after injury or illness and are especially important for post-acute (short-stay) rehabilitation. 6m per day ▲ 19% State avg: 5m per day · National avg: 4m per day
Weekend RN Info Registered nurse hours specifically on weekends. Facilities sometimes reduce RN presence on Saturdays and Sundays — a low weekend RN figure compared to weekday hours can indicate reduced clinical oversight when most administrative staff are absent. 16m per day ▼ 56% State avg: 36m per day · National avg: 29m per day

Capacity and availability

Avg. Length of Stay
100 days
Bed community size
108-bed community Rank #123 / 533Bed count — State benchmarkedThis home is ranked 123rd out of 533 homes in Colorado. Shows this facility's certified or reported bed count compared to other Colorado facilities. Larger communities may offer more amenities, programs, and on-site services for residents and families.Click the rank badge to see the full State ranking.Click here to see the full State ranking.
A larger shared setting that may offer more common spaces and organized community services.
Years in operation
45 years in operation
A longer operating history, which may indicate experience navigating regulations and delivering ongoing care.
Walk Score
Walk Score: 69 / 100 Rank #244 / 872Walk Score — State benchmarkedThis home is ranked 244th out of 872 homes in Colorado. Shows how walkable this facility's neighborhood is compared to the average Walk Score across Colorado facilities. Higher scores benefit residents, families, and staff.Click the rank badge to see the full State ranking.Click here to see the full State ranking.
Moderately walkable. Some errands can be accomplished on foot, with a mix of nearby amenities.
BBB Rating
BBB Rating: A- (Not Accredited)
An independent rating from the Better Business Bureau based on factors such as complaint history, transparency, and business practices.
How BBB ratings work

About this community

Occupancy

Occupancy rate
90%
Rank #38 / 185Occupancy rate — State benchmarkedThis home is ranked 38th out of 185 homes in Colorado. Shows this facility's occupancy rate versus the Colorado average, with its Statewide rank out of 185. Higher occupancy signals strong local demand and financial stability.Click the rank badge to see the full State ranking.Click here to see the full State ranking.
Higher than the Colorado average: 76.5%
Occupied beds
98 / 108
Average occupied beds in Colorado homes 72 beds

License Details

StatusActive

Ownership & Operating Entity

Sunrise at Orchard is administrated by Jason Vandagriff.

OwnerSZR ORCHARD AL LLC

Staffing

Key information about the people who lead and staff this community.

Leadership

ContactMr. Paul Klaassen, Founder

Contact Sunrise at Orchard

Inspection History

In Colorado, the Department of Public Health and Environment, Health Facilities Division is the regulatory body that performs unannounced surveys and publishes facility inspection findings.

Since 2021 · 5 years of data 14 deficiencies 4 inspections

Inspection Scorecard Info This scorecard compares key inspection, citation, and complaint metrics at this facility against the Colorado state average. Metrics rated ≥15% worse than average are highlighted in red; those ≥15% better are highlighted in green.

Since 2021 vs. Colorado state average
Overall vs. CO average 0 Worse No metrics in this bucket. 4 Better Metrics better than Colorado average:
• Total deficiencies (53% below)
• Deficiencies per year (53% below)
• Deficiencies per inspection (30% below)
• Total inspections (33% below)
Latest Inspection June 19, 2025 Complaint Investigation

Deficiencies Info Deficiencies are formal regulatory issues recorded during state inspections.

This FacilityCO Averagevs. CO Avg
Total deficiencies Info Formal regulatory issues recorded by inspectors across all inspection types. 1430 This facility has 53% fewer total deficiencies than a typical Colorado nursing home (14 vs. CO avg 30).↓ 53% better
Deficiencies per year Info Average deficiencies per year since 2021. 2.86 This facility has 53% fewer deficiencies per year than a typical Colorado nursing home (2.8 vs. CO avg 6).↓ 53% better
Deficiencies per inspection Info Average deficiencies per inspection. 3.55 This facility has 30% fewer deficiencies per inspection than a typical Colorado nursing home (3.5 vs. CO avg 5).↓ 30% better

Inspections Info State inspections evaluate whether the facility meets health and safety standards.

This FacilityCO Averagevs. CO Avg
Total inspections Info Combined count of all routine and focused inspections. Excludes complaint investigations. 46 This facility has 33% fewer total inspections than a typical Colorado nursing home (4 vs. CO avg 6).↓ 33% better

Health Inspection History

Inspections since 2021
Total health inspections 4

Colorado average 4.8


Last Health inspection on Jun 2025

Total health citations
12 Rank #25 / 182Health citations — State benchmarkedThis home is ranked 25th out of 182 homes in Colorado. Shows this facility's total health deficiency citations benchmarked to the Colorado State average, with a ranking across all 182 CO facilities. Lower citation counts earn a better rank.Click the rank badge to see the full State ranking.Click here to see the full State ranking.

Colorado average 24.8

Citations per inspection
3 Rank #32 / 182Citations per inspection — State benchmarkedThis home is ranked 32nd out of 182 homes in Colorado. Shows average deficiency citations per CMS inspection for this facility versus the Colorado mean across 182 facilities with citation data. Lower is better.Click the rank badge to see the full State ranking.Click here to see the full State ranking.

Colorado average 5.2


Health citations are formal notices following inspections when they fail to comply with safety and care standards.

7 of 12 citations resulted from standard inspections; 3 of 12 resulted from complaint investigations; and 2 of 12 came from combined inspections (standard and complaint).

Breakdown of citation severity (last 5 years)
Critical health citations
0
100% better than Colorado average

Colorado average: 0.4


Serious health citations
1
52% better than Colorado average

Colorado average: 2.1

0 critical citations Colorado average: 0.4

1 serious citation Colorado average: 2.1

11 moderate citations Colorado average: 22.2

0 minor citations Colorado average: 0.2
Citations history (last 5 years)
Abuse/Neglect moderate citation Jun 19, 2025
Corrected

Quality of Care serious citation Jun 19, 2025
Corrected

Care Planning moderate citation Jun 19, 2025
Corrected

Nutrition moderate citation May 09, 2024
Corrected

Staffing Data

Reporting period: October 1 – December 31, 2025 (Q4 2025). Source: CMS Payroll-Based Journal report.

Total staff 180
Employees 179
Contractors 1
Staff to resident ratio 1.51 : 1
20% fewer staff per resident than Colorado average
Colorado average ratio: 1.88 : 1 Colorado average ratio: 1.88 : 1See full Colorado ranking
Avg staff/day 64
Average shift 8.6 hours
0% compared with Colorado average
Colorado average: 8.3 hours Colorado average shift: 8.3 hoursSee full Colorado ranking
Total staff hours (quarter) 50,600

Nursing staff breakdown

Q4 2025 · Oct 1 – Dec 31 More info This data comes from the CMS Payroll-Based Journal report covering October 1 – December 31, 2025.
Registered Nurse

Manages medical care and health needs.

RN Staff Info All 13 RN Staff are full-time employees. No contractors work on this role. 13
Average shift length Info Average shift length. Calculated as total hours divided by days worked and average staff per day. 10 hours
Licensed Practical Nurse

Assists with medical care and medications.

LPN Staff Info All 35 LPN Staff are full-time employees. No contractors work on this role. 35
Average shift length Info Average shift length. Calculated as total hours divided by days worked and average staff per day. 9.6 hours
Certified Nursing Assistant

Helps with daily care and mobility.

CNA Staff Info All 83 CNA Staff are full-time employees. No contractors work on this role. 83
Average shift length Info Average shift length. Calculated as total hours divided by days worked and average staff per day. 9.1 hours

Contractor staffing

Q4 2025 · Oct 1 – Dec 31 More info This data comes from the CMS Payroll-Based Journal report covering October 1 – December 31, 2025.

Total hours from contractors

0.1%

59 contractor hours this quarter

Medical Director: 1

Staff by category

Q4 2025 · Oct 1 – Dec 31 More info This data comes from the CMS Payroll-Based Journal report covering October 1 – December 31, 2025.
Certified Nursing Assistant8308323,99492100%9.1
Licensed Practical Nurse350359,99292100%9.6
Registered Nurse130133,16792100%10
Speech Language Pathologist8083,0618188%7.5
Clinical Nurse Specialist6061,9546672%8.3
RN Director of Nursing6061,5716672%8.1
Physical Therapy Assistant6061,3306975%7.1
Respiratory Therapy Technician6061,0977278%7.3
Physical Therapy Aide5051,0607379%6.4
Dental Services Staff3039047076%6.3
Qualified Social Worker4047646470%6.3
Administrator1015126470%8
Occupational Therapy Aide1015046368%8
Mental Health Service Worker1014405560%8
Nurse Practitioner1011922426%8
Medical Director011594145%1.4
83 Certified Nursing Assistant
% of Days 100%
35 Licensed Practical Nurse
% of Days 100%
13 Registered Nurse
% of Days 100%
8 Speech Language Pathologist
% of Days 88%
6 Clinical Nurse Specialist
% of Days 72%
6 RN Director of Nursing
% of Days 72%
6 Physical Therapy Assistant
% of Days 75%
6 Respiratory Therapy Technician
% of Days 78%
5 Physical Therapy Aide
% of Days 79%
3 Dental Services Staff
% of Days 76%
4 Qualified Social Worker
% of Days 70%
1 Administrator
% of Days 70%
1 Occupational Therapy Aide
% of Days 68%
1 Mental Health Service Worker
% of Days 60%
1 Nurse Practitioner
% of Days 26%
1 Medical Director
% of Days 45%

Penalties and fines

Federal penalties imposed by CMS for regulatory violations, including civil money penalties (fines) and denials of payment for new Medicare/Medicaid admissions.

Source: CMS Penalties Database

No penalties in the past 3 years

No civil money penalties or payment denials were reported in the last 3 years.

Quality of care over time

These measures show how residents usually do over time at this home, based on health outcomes and preventive care.

High-risk clinical events score Info A composite score based on pressure ulcers, falls with injury, weight loss, walking ability decline, and activities of daily living decline. 15.5
71% worse than Colorado average

Colorado average: 9.0

Functional decline score Info A composite score based on activities of daily living decline, walking ability decline, and incontinence. 30.6
63% worse than Colorado average

Colorado average: 18.8

Long-stay resident measures
Need for Help with Daily Activities Increased Info Percent of long-stay residents whose need for help with daily activities has increased 29.5%
84% worse than Colorado average

Colorado average: 16.0%

Walking Ability Worsened Info Percent of long-stay residents whose ability to move independently worsened 33.7%
98% worse than Colorado average

Colorado average: 17.0%

Low Risk Residents with Bowel/Bladder Incontinence Info Percent of low risk long-stay residents who lose control of their bowels or bladder 28.6%
23% worse than Colorado average

Colorado average: 23.2%

Falls with Major Injury Info Percent of long-stay residents experiencing one or more falls with major injury 1.6%
52% better than Colorado average

Colorado average: 3.3%

High Risk Residents with Pressure Ulcers Info Percent of long-stay high risk residents with pressure ulcers 5.3%
36% worse than Colorado average

Colorado average: 3.9%

Urinary Tract Infection Info Percent of long-stay residents with a urinary tract infection 0.8%
42% better than Colorado average

Colorado average: 1.4%

Lost Too Much Weight Info Percent of long-stay residents who lose too much weight 7.3%
40% worse than Colorado average

Colorado average: 5.2%

Depressive Symptoms Info Percent of long-stay residents who have depressive symptoms 3.4%
53% better than Colorado average

Colorado average: 7.2%

Antipsychotic Use Info Percent of long-stay residents who received an antipsychotic medication 9.6%
49% better than Colorado average

Colorado average: 18.8%

Pneumococcal Vaccine Info Percent of long-stay residents assessed and appropriately given the pneumococcal vaccine 100.0%
7% better than Colorado average

Colorado average: 93.3%

Influenza Vaccine Info Percent of long-stay residents assessed and appropriately given the seasonal influenza vaccine 98.0%
In line with Colorado average

Colorado average: 94.7%

Short-stay resident measures
Pneumococcal Vaccine Info Percent of short-stay residents assessed and appropriately given the pneumococcal vaccine 97.3%
27% better than Colorado average

Colorado average: 76.6%

Antipsychotic medication increase Info Percent of short-stay residents who newly received an antipsychotic medication 0.4%
69% better than Colorado average

Colorado average: 1.4%

Influenza Vaccine Info Percent of short-stay residents assessed and appropriately given the seasonal influenza vaccine 75.4%
In line with Colorado average

Colorado average: 75.6%

Breakdown by payment type

Medicare

67% of new residents, usually for short-term rehab.

Typical stay 27 days

Private pay

22% of new residents, often for short stays.

Typical stay 3 - 4 months

Medicaid

11% of new residents, often for long-term daily care.

Typical stay 1 - 2 years

Facility Characteristics

Source: CMS Long-Term Care Facility Characteristics (Data as of Jan 2026)

Total residents 119
Medicare
19
16% of residents
Medicaid
76
63.9% of residents
Private pay or other
24
20.2% of residents
Programs & Services
Residents Group

Residents meet regularly to discuss policies, care quality, and activities

Family Member Group

Family members meet regularly to discuss policies, care quality, and activities

Active Family Council

Organized group of family members that meets regularly to discuss facility policies, resident care, and activities.

Active Resident Council

Organized group of residents that meets regularly to discuss facility policies, quality of life, and activities.

Finances and operations

Based on the 2023 CMS SNF Cost Report.

Privately-owned community
Operated by a business corporation.
Home revenue
$22.3M
Profit
$278.8K
Privately-owned community Operated by a business corporation.
Home revenue
$22.3M Rank #23 / 182Revenue — State benchmarkedThis home is ranked 23rd out of 182 homes in Colorado. Shows this facility's annual revenue compared to the Colorado average. Higher revenue generally means more resources for staffing and capital — read alongside Payroll %.Click the rank badge to see the full State ranking.Click here to see the full State ranking.
Profit
$278.8K
Payroll costs Info The portion of the home's budget spent on staff, including nurses, caregivers, and other employees who support care and operations. Rank #6 / 182Payroll — State benchmarkedThis home is ranked 6th out of 182 homes in Colorado. Shows total annual staff payroll benchmarked to the Colorado average. Higher payroll investment relative to peers often signals better staffing and less reliance on cheaper contract labor.Click the rank badge to see the full State ranking.Click here to see the full State ranking.
$12.7M
56.8% of revenue Rank #77 / 182Payroll % — State benchmarkedThis home is ranked 77th out of 182 homes in Colorado. Shows payroll as a percentage of revenue versus the Colorado average. Well-run Colorado facilities typically land around 59–66% — the top third Statewide. Below 25% may signal understaffing or heavy agency use — read with Staffing ratings.Click the rank badge to see the full State ranking.Click here to see the full State ranking.
Other operating costs Info All remaining costs needed to run the home, such as food, utilities, building maintenance, supplies and administrative expenses.
$9.3M
Total costs $22.0M

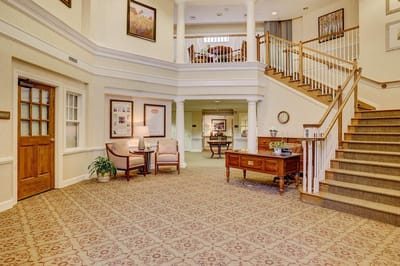
What does this home offer?

Pets allowed icon
Pets allowed icon

Pets Allowed

Housing options icon

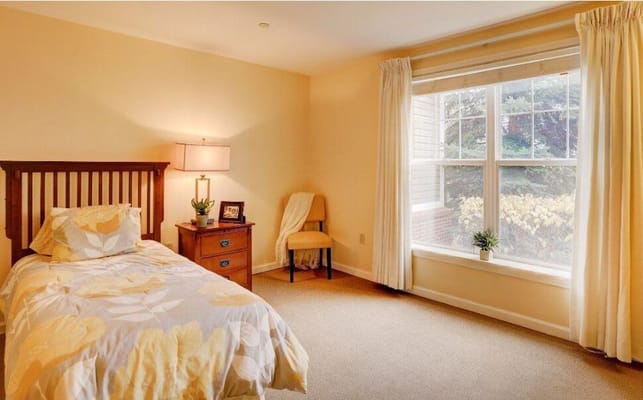
Housing Options: Studio / 1 Bed

Building type icon
Building type icon

Building Type: 2-story

Transportation services icon

Transportation Services

Fitness and recreation icon

Fitness and Recreation

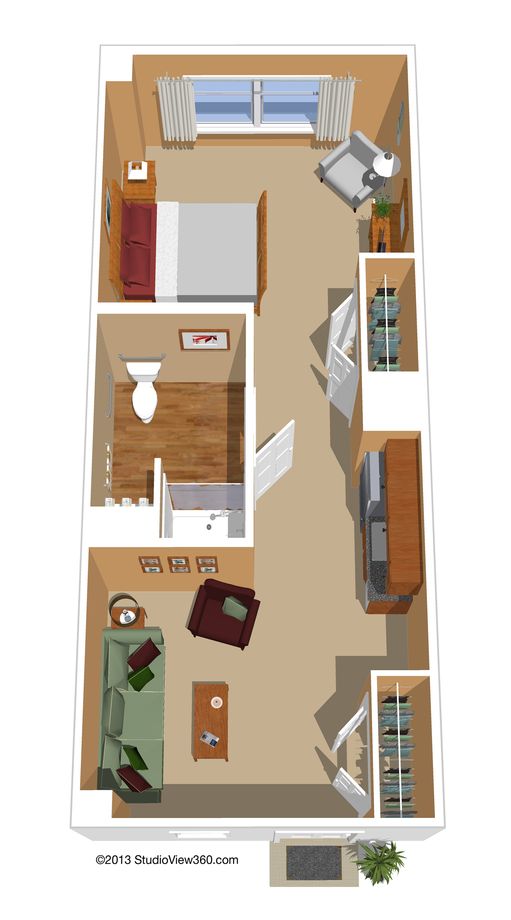
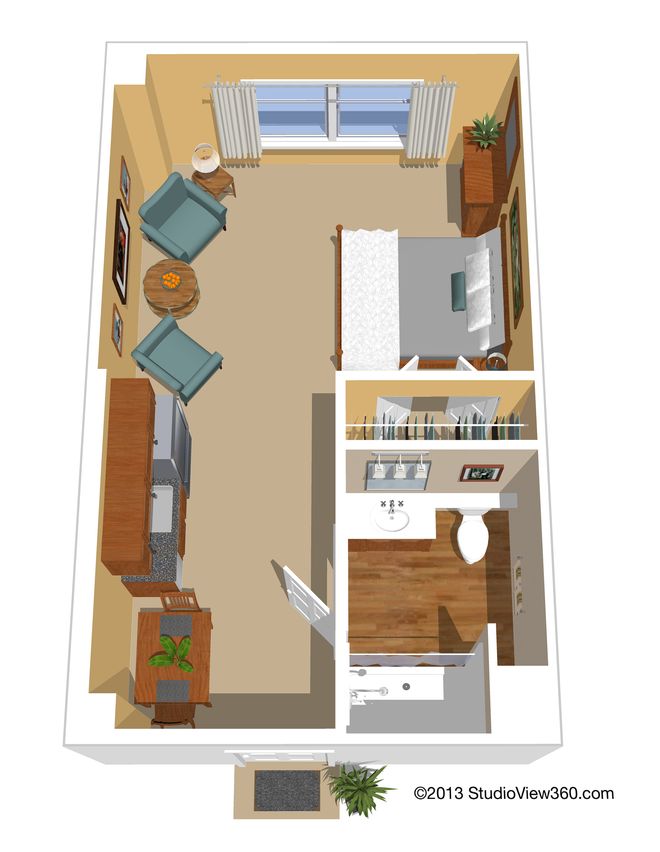
Type of Rooms Available

Studio
Studio
Studio
1 / 4
Studio
1

Who this home usually serves

TYPE OF STAY

Mostly short-term rehab stays

Most residents typically stay for a few weeks or months before returning home or moving on.

Most new residents arrive under Medicare (67% of admissions), and a typical Medicare stay runs around 27 days.

Admissions
446 total

Coverage residents most often arrive under.

Medicare 67%
Private pay 22%
Medicaid 11%
Discharges
440 total

Coverage residents most often leave under.

Medicare 52%
Private pay 28%
Medicaid 20%

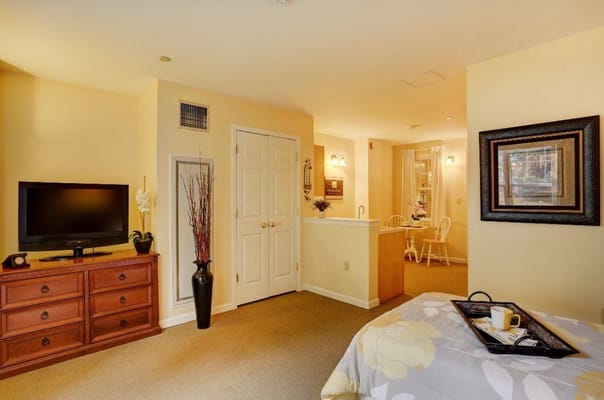
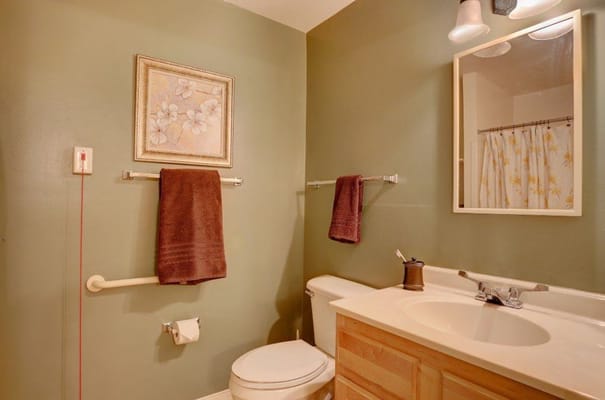
Living Spaces & Floor Plans for Sunrise at Orchard

Orchard P2
Orchard P3
Orchard P1

Places of interest near Sunrise at Orchard

Address 5.8 miles from city center Info Estimated distance in miles from Littleton's city center to Sunrise at Orchard's address, calculated via Google Maps. — 1.93 miles to nearest hospital (Swedish Center For Breast Health)

Calculate Travel Distance to Sunrise at Orchard

Add your location

Address

Financial Assistance for
Nursing Home in Colorado

Sunrise at Orchard is located in Littleton, Colorado.
Here are the financial assistance programs available to residents in Colorado.

Get Financial aid guidance

Elderly, Blind, and Disabled Waiver

Colorado Medicaid EBD Waiver

Age 65+ or disabled
General Colorado resident, Medicaid- eligible, nursing home-level care need.
Income Limits (2025) ~$2,829/month 300% FBR, individual
Asset Limits $2,000 (individual), $3,000 (couple).
CO

Requires level-of-care assessment by case manager.

Benefits
Personal care (5-7 hours/day) Respite care (up to 240 hours/year) Adult day care ($65/day) Home modifications ($1,500 avg.)

Old Age Pension (OAP) Health Care Program

Colorado OAP

Age 60+
General Colorado resident.
Income Limits ~$1,215/month individual
Asset Limits $2,000 individual
CO

Supplements SSI; limited medical coverage.

Benefits
Cash (~$100-$800/month) Limited in-home care (2-3 hours/week) Medical assistance

Program of All-Inclusive Care for the Elderly (PACE)

Colorado Medicaid PACE

Age 55+
General Colorado resident, nursing home-level care need, safe with PACE support.
Income Limits (2025) ~$2,829/month 300% FBR
Asset Limits $2,000 (individual), $3,000 (couple).
CO

Limited to specific regions (e.g., Denver, Pueblo).

Benefits
All-inclusive care—personal care (5-7 hours/day) Meals Transportation Therapy Medical visits

Home Care Allowance (HCA)

Colorado Home Care Allowance (HCA)

Age
General Seniors typically 65+, Age 5+ with disability, Colorado resident, financial/functional need.
Income Limits (2025) ~$1,004/month individual, stricter than waivers
Asset Limits $2,000 (individual), $3,000 (couple).
CO

Must need help with ADLs; not Medicaid-waiver eligible.

Benefits
Personal care (~4-6 hours/day, paid to provider) E.g. Bathing Dressing

Compare Nursing Home around Littleton

The information below is reported by the Colorado Department of Public Health and Environment, Health Facilities Division.

2 facilities compared · CMS & CO Dept. of Health data

Littleton Care and Rehabilitation Center
NH

Nursing Home Licensed facility providing 24/7 skilled nursing care for residents with complex, ongoing medical needs. Staffed by RNs, LPNs, and CNAs. Inspected and star-rated annually by CMS. Accepts Medicare (short-term rehab) and Medicaid (long-term care).

MC

Memory Care Secured, specialized care for people living with Alzheimer's or dementia. Staff trained in cognitive impairment, with higher staff-to-resident ratios and an environment designed to reduce confusion and wandering risk.

Littleton
35
Facility 35
CO AVG 76
Rank #402 / 533
94.9%
Facility 94.9%
CO AVG 76.5%
Rank #10 / 185
+24%
3.66
Facility 3.66
CO AVG 3.86
Rank #84 / 177
+41%-5%
$7.8k
Facility $7.8k
CO AVG $39.2k
Rank #80 / 182
12
Facility 12
CO AVG 24.8
Rank #25 / 182
2.4
Facility 2.4
CO AVG 5.2
Rank #16 / 182
132A+
69
Facility 69
CO AVG 51
Rank #244 / 872
-
$5.8M
Facility $5.8M
CO AVG $11.2M
Rank #166 / 182
$3.4M
Facility $3.4M
CO AVG $4.9M
Rank #162 / 182
58.5%
Facility 58.5%
CO AVG 46.6%
Rank #64 / 182
65320
Sunrise at Orchard
NH

Nursing Home Licensed facility providing 24/7 skilled nursing care for residents with complex, ongoing medical needs. Staffed by RNs, LPNs, and CNAs. Inspected and star-rated annually by CMS. Accepts Medicare (short-term rehab) and Medicaid (long-term care).

AL

Assisted Living A licensed, long-term care setting for seniors or individuals with disabilities who need help with daily activities — like bathing, dressing, and medication management — but not 24-hour skilled nursing. Offers housing, meals, and around-the-clock support while aiming to maximize resident independence.

MC

Memory Care Secured, specialized care for people living with Alzheimer's or dementia. Staff trained in cognitive impairment, with higher staff-to-resident ratios and an environment designed to reduce confusion and wandering risk.

Littleton (Cherry Ridge)
108
Facility 108
CO AVG 76
Rank #123 / 533
90.3%
Facility 90.3%
CO AVG 76.5%
Rank #38 / 185
+18%
4.41
Facility 4.41
CO AVG 3.86
Rank #30 / 177
-49%+14%
$0
Facility $0
CO AVG $39.2k
Rank #1 / 182
12
Facility 12
CO AVG 24.8
Rank #25 / 182
3.0
Facility 3.0
CO AVG 5.2
Rank #32 / 182
1117A-
69
Facility 69
CO AVG 51
Rank #244 / 872
Sbk Capital, LLC
$22.3M
Facility $22.3M
CO AVG $11.2M
Rank #23 / 182
$12.7M
Facility $12.7M
CO AVG $4.9M
Rank #6 / 182
56.8%
Facility 56.8%
CO AVG 46.6%
Rank #77 / 182
65259

Frequently Asked Questions about Sunrise at Orchard

What neighborhood is Sunrise at Orchard in?

Sunrise at Orchard is in the Cherry Ridge neighborhood of Littleton.

Who is the owner of Sunrise at Orchard?

The legal owner and operator of Sunrise at Orchard is Szr Orchard Al Llc.

Is Sunrise at Orchard in a walkable area?

Sunrise at Orchard has a walk score of 69. Moderately walkable. Some errands can be accomplished on foot, with a mix of nearby amenities.

What is the occupancy rate at Sunrise at Orchard?

Sunrise at Orchard's occupancy is 90%.

Who is the administrator of Sunrise at Orchard?

Jason Vandagriff is the administrator of Sunrise at Orchard.

How many beds does Sunrise at Orchard have?

Sunrise at Orchard has 108 beds.

Are there photos of Sunrise at Orchard?

Yes — there are 4 photos of Sunrise at Orchard in the photo gallery on this page.

Guides for Better Senior Living

Care Cost Calculator: See Prices in Your Area

Nursing Home Data Explorer

Don’t Wait Too Long: 7 Red Flag Signs Your Parent Needs Assisted Living Now

The True Cost of Assisted Living in 2025 – And How Families Are Paying For It

Understanding Senior Living Costs: Pricing Models, Discounts & Financial Assistance

Explore Open Rooms
1 Contact details
2 What type of senior care service are you looking for?
3 What budget do you have in mind for senior care?
4 How soon do you need to find care?
5 Additional details

Thank you for your interest!

Our team will be in touch shortly to help with next steps.