


Sunrise of Pikesville
Assisted Living, Nursing Home, Hospice Care & Memory Care · Pikesville, MD
Sunrise of Pikesville
Assisted Living, Nursing Home, Hospice Care & Memory Care · Pikesville, MD
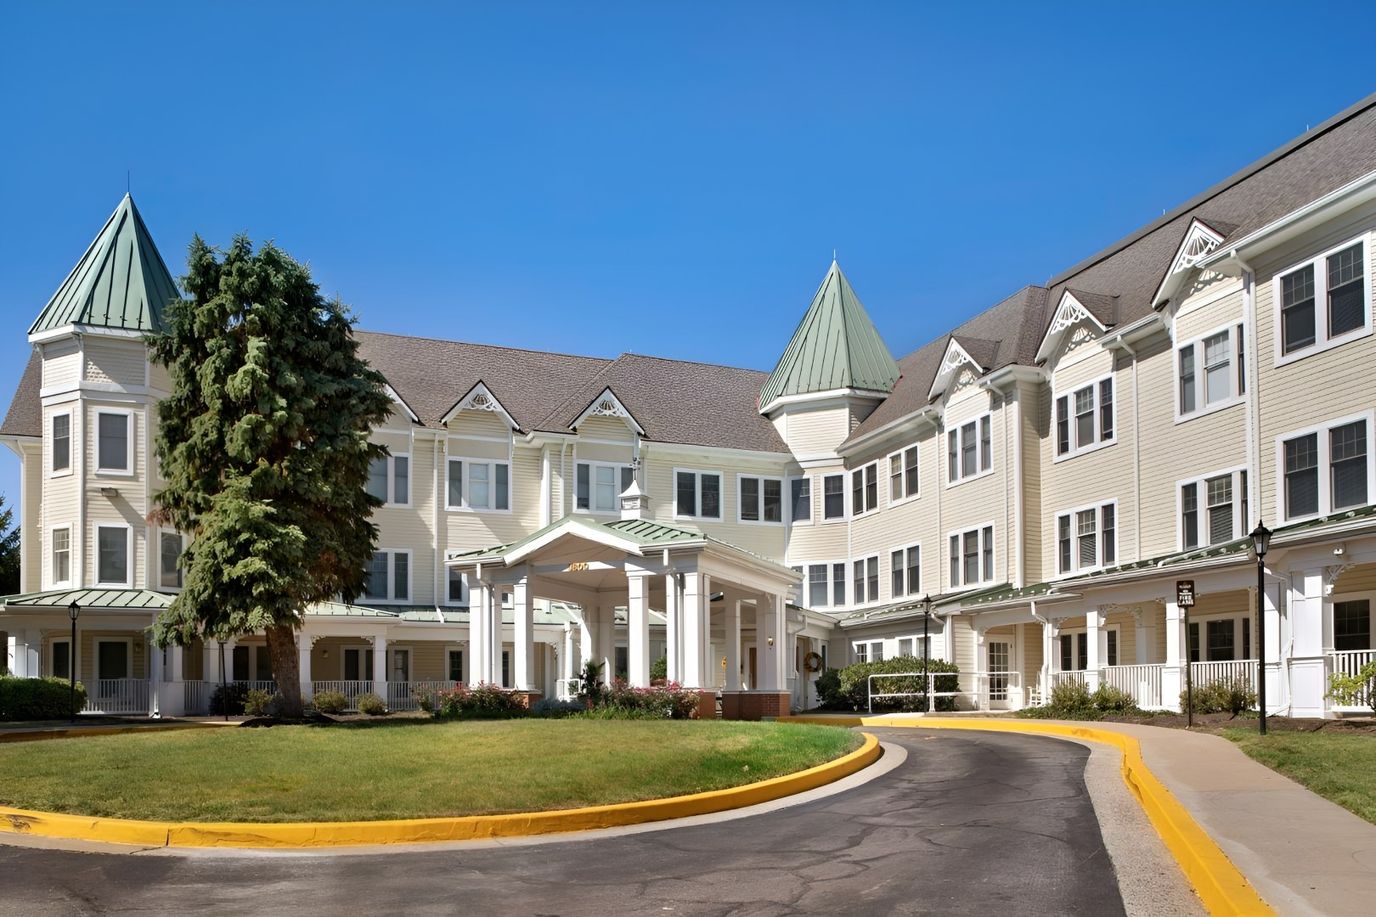
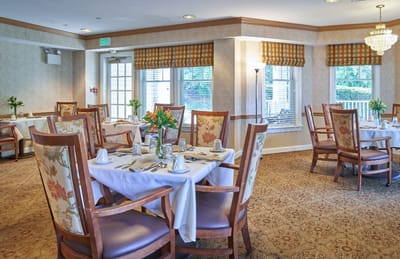
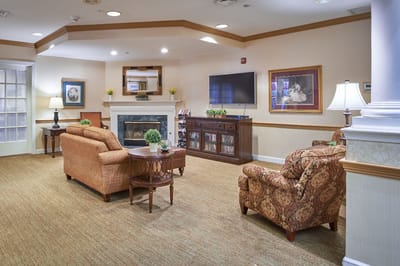
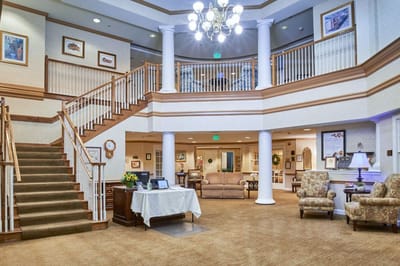
Nestled in the charming northwest suburbs of Baltimore, Sunrise of Pikesville provides assisted living, memory care, short-term stays, and hospice coordination, ensuring a wide array of specialized services for their residents. Every detail exudes a warm and homemade ambiance, creating a sense of comfort that residents truly appreciate. Beyond the cozy interiors, Sunrise of Pikesville boasts a range of programs designed to foster socialization and engagement.
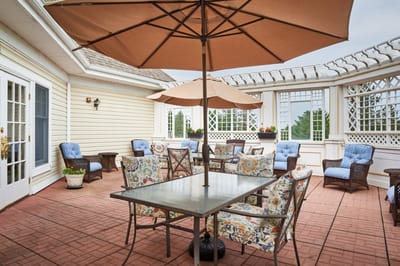
Residents can enjoy leisurely strolls along secure outdoor paths and patios, enhancing their sense of well-being. The neighborhood itself carries a lively and welcoming atmosphere, making each day a delightful experience. One of the highlights is their culinary team, dedicated to crafting exquisite meals that delight the taste buds. The community also offers a strategic location, providing easy access to convenient outings, cultural attractions, and nearby healthcare facilities such as Northwest Hospital and Sinai Hospital.
96-bed community Rank #136 / 690Bed count — State benchmarkedThis home is ranked 136th out of 690 homes in Maryland for Bed Count. Shows this facility's certified or reported bed count compared to other Maryland facilities. Larger communities may offer more amenities, programs, and on-site services for residents and families.Facilities with the same value for a metric share the same rank. Rankings are based only on facilities in Maryland that report data for that category. Facilities without available data are excluded from the ranking.Click the rank badge to see the full State ranking.Click here to see the full State ranking.
A larger shared setting that may offer more common spaces and organized community services.
45 years in operation Rank #4 / 210Years in operation — State benchmarkedThis home is ranked 4th out of 210 homes in Maryland for Years In Operation. Shows how long this facility has been in operation compared to other Maryland facilities. Longer operating histories may benefit residents, families, and staff.Facilities with the same value for a metric share the same rank. Rankings are based only on facilities in Maryland that report data for that category. Facilities without available data are excluded from the ranking.Click the rank badge to see the full State ranking.Click here to see the full State ranking.
A longer operating history, which may indicate experience navigating regulations and delivering ongoing care.
Walk Score: 75 / 100 Rank #131 / 985Walk Score — State benchmarkedThis home is ranked 131st out of 985 homes in Maryland for Walk Score. Shows how walkable this facility's neighborhood is compared to the average Walk Score across Maryland facilities. Higher scores benefit residents, families, and staff.Facilities with the same value for a metric share the same rank. Rankings are based only on facilities in Maryland that report data for that category. Facilities without available data are excluded from the ranking.Click the rank badge to see the full State ranking.Click here to see the full State ranking.
Very walkable. Most errands can be accomplished on foot, and many essentials are within a short walk.
BBB Rating: A- (Not Accredited)
An independent rating from the Better Business Bureau based on factors such as complaint history, transparency, and business practices.
How BBB ratings work
How BBB ratings work
About this community
Facility TypeAssisted Living
CountyBaltimore
Private Room
$100 - $200 per day
Semi-Private Room
$75 - $160 per day
Hospice Affiliations
Staffing
Key information about the people who lead and staff this community.
ContactMr. Paul Klaassen, Founder (per BBB, record updated Jul 2026)
Dedicated Alzheimer's Unit
Mild Alzheimer's Level
Moderate Alzheimer's Level
Severe Alzheimer's Level
Demographics
Resident demographic information for this facility.
Gender
- Female 69.9%
- Male 30.1%
Age Distribution
- 85-94 41.1%
- 75-84 27.4%
- 65-74 15.1%
- 95+ 15.1%
- ≤64 1.4%
Ethnicity
- White 63%
- African American 37%
What does this home offer?
Pets Allowed
Housing Options: Studio / 1 Bed / 2 Bed
Building Type: 3-story
Transportation Services
Fitness and Recreation
Type of Rooms Available
1 / 4
1 Bed
1
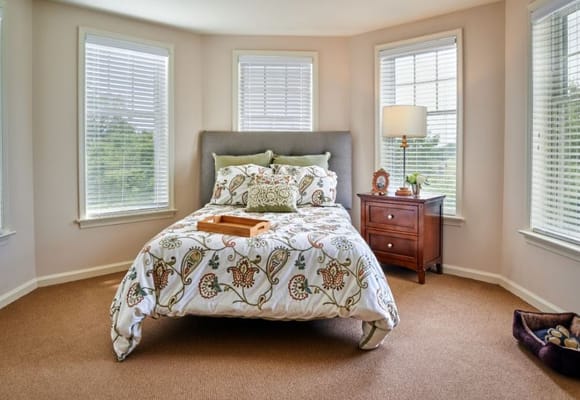
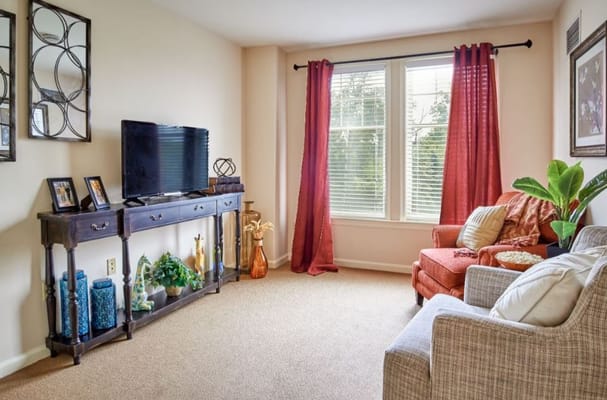
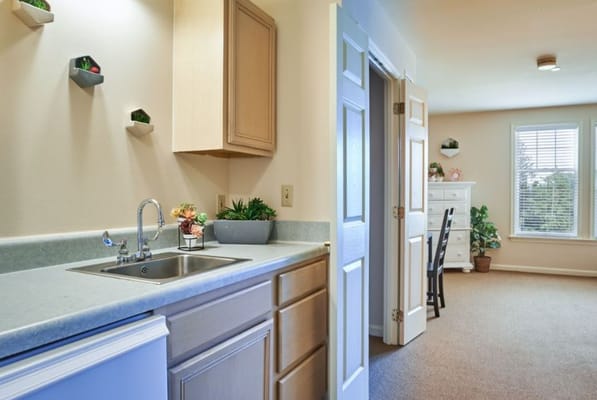
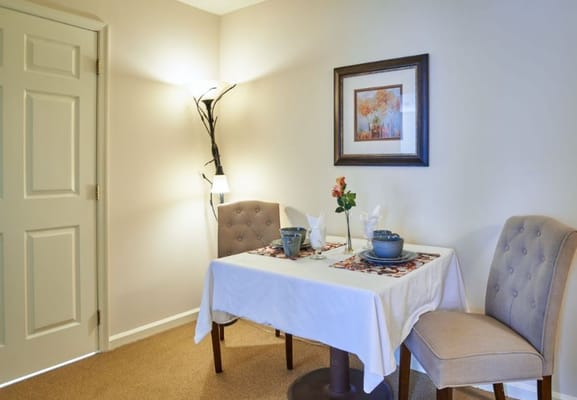
Living Spaces & Floor Plans for Sunrise of Pikesville
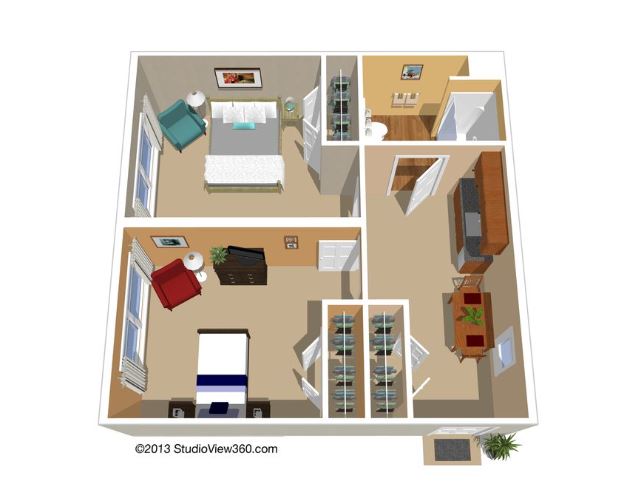
2 bedroom
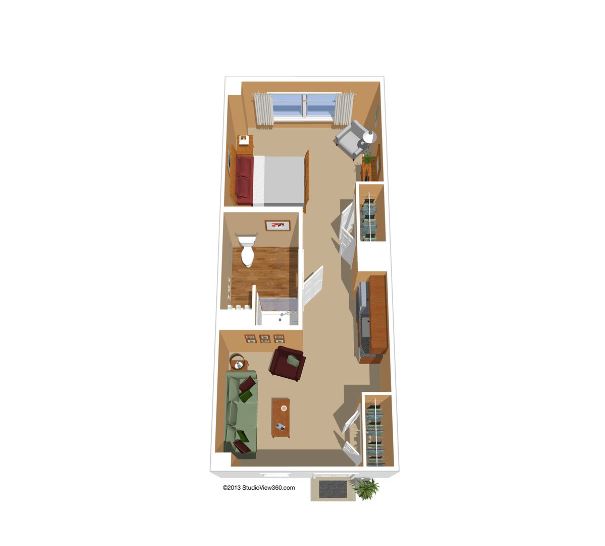
1 Bedroom
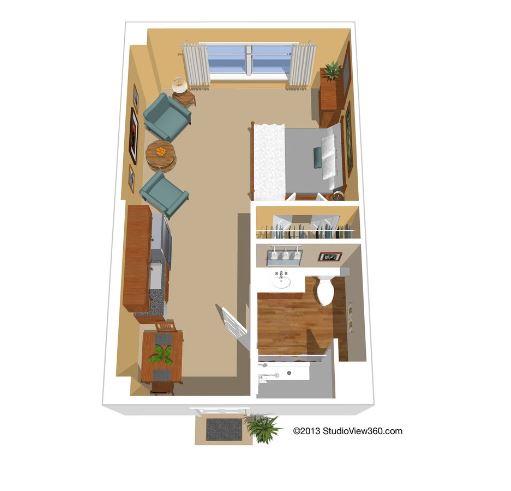
Studio
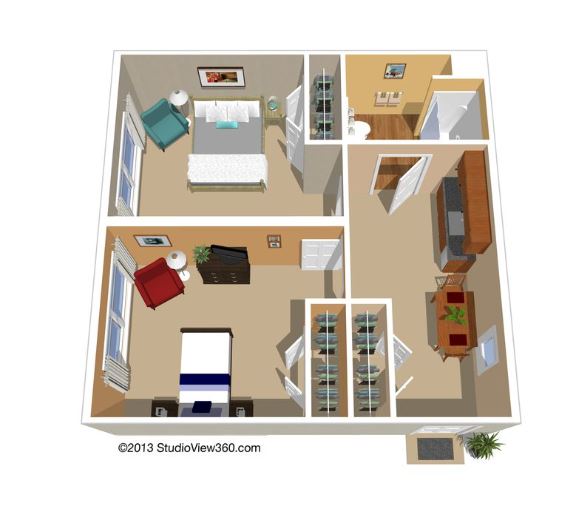
Suite
Places of interest near Sunrise of Pikesville
![]() 0.7 miles from city center
0.7 miles from city center
![]() Estimated distance in miles from Pikesville's city center to Sunrise of Pikesville's address, calculated via Google Maps.
Estimated distance in miles from Pikesville's city center to Sunrise of Pikesville's address, calculated via Google Maps.
Calculate Travel Distance to Sunrise of Pikesville
Add your location
Compare Assisted Living around Pikesville
The information below is reported by the Maryland Department of Health, Office of Health Care Quality.
| King David Nursing and Rehabilitation Center | AL HOS NH PC RC SNF | Pikesville (Colonial Village) | - | 100
Facility
100
MD AVG
43
Rank
#114 / 690 | - |
72
Facility
72
MD AVG
43
Rank
#160 / 985 | - |
| Autumn Lake Healthcare at Pikesville | AL HOS NH PC RC SNF | Pikesville (Sudbrook Lane) | - | 140
Facility
140
MD AVG
43
Rank
#50 / 690 | - |
79
Facility
79
MD AVG
43
Rank
#99 / 985 | - |
Financial Assistance for
Assisted Living in Maryland
Sunrise of Pikesville is located in Pikesville, Maryland.
Here are the financial assistance programs available to residents in Maryland.
Frequently Asked Questions about Sunrise of Pikesville
What neighborhood is Sunrise of Pikesville in?
Sunrise of Pikesville is in the Old Court Road neighborhood of Pikesville.
Is Sunrise of Pikesville in a walkable area?
Sunrise of Pikesville has a walk score of 75. Very walkable. Most errands can be accomplished on foot, and many essentials are within a short walk.
Are pets allowed at Sunrise of Pikesville?
Yes, Sunrise of Pikesville allows residents to bring their pets.
How many beds does Sunrise of Pikesville have?
Sunrise of Pikesville has 96 beds.
Are there photos of Sunrise of Pikesville?
Yes — there are 8 photos of Sunrise of Pikesville in the photo gallery on this page.
What is the address of Sunrise of Pikesville?
Sunrise of Pikesville is located at 3800 Old Court Rd, Pikesville, MD 21208.
What is the phone number of Sunrise of Pikesville?
(410) 602-0033 will put you in contact with the team at Sunrise of Pikesville.
Guides for Better Senior Living
Care Cost Calculator: See Prices in Your Area
Nursing Home Data Explorer
Don’t Wait Too Long: 7 Red Flag Signs Your Parent Needs Assisted Living Now
The True Cost of Assisted Living in 2025 – And How Families Are Paying For It
Understanding Senior Living Costs: Pricing Models, Discounts & Financial Assistance
Updated on
