Sunrise of Westmont
Nursing Home, Assisted Living, Memory Care & Respite Care · Naperville, IL
CMS overall rating Info CMS (the Centers for Medicare & Medicaid Services) is the federal agency that rates nursing home quality. Its Overall Rating runs from 1 to 5 stars, combining health inspections, staffing, and quality measures, with inspections weighted most heavily.

Sunrise of Westmont

Nursing Home, Assisted Living, Memory Care & Respite Care · Naperville, IL
CMS overall rating Info CMS (the Centers for Medicare & Medicaid Services) is the federal agency that rates nursing home quality. Its Overall Rating runs from 1 to 5 stars, combining health inspections, staffing, and quality measures, with inspections weighted most heavily.
Calculator: See prices in your area
Sunrise of Westmont accepts Medicare, Medicaid, and private pay.

Overview of Sunrise of Westmont

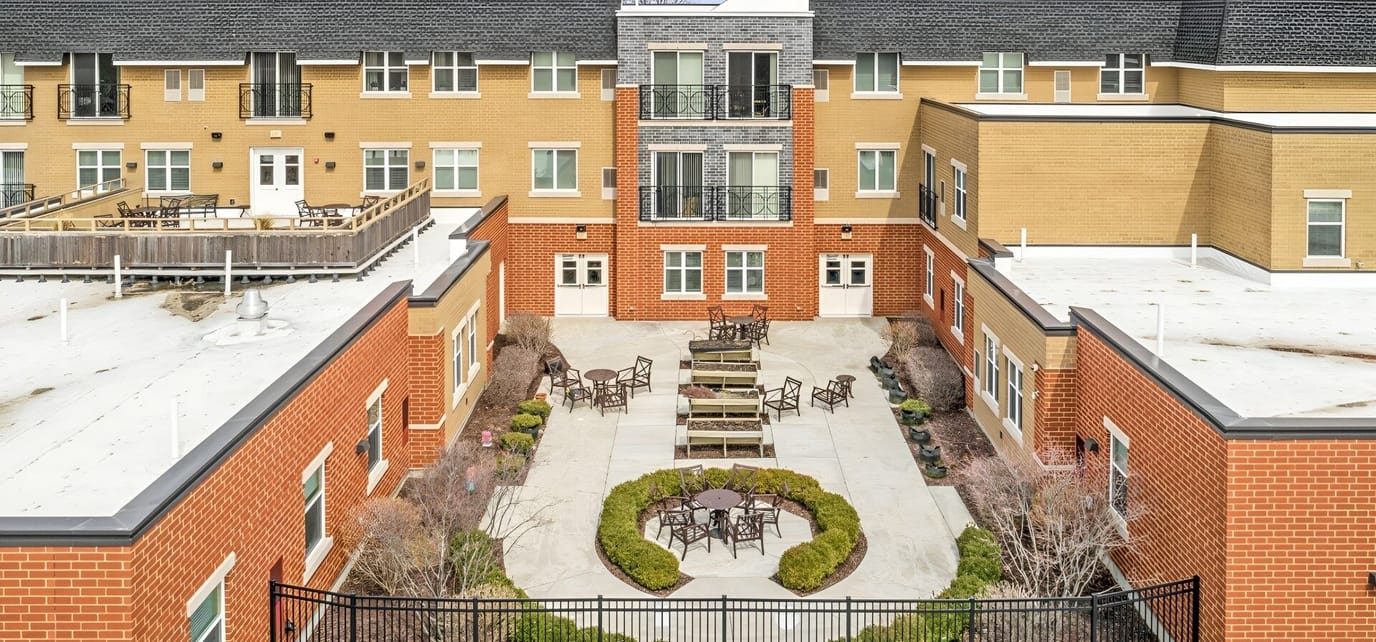
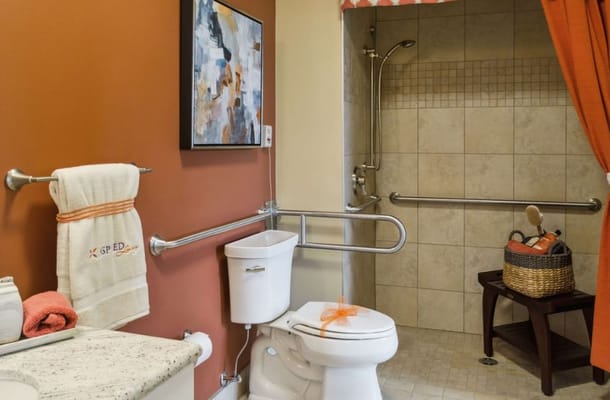
Located at 63rd Street, Westmont, IL, Sunrise of Westmont is an extraordinary senior living community offering assisted living, memory care, and short-term stays. Prioritizing seniors’ relaxation and safety, the community features cozy and pet-friendly floor plans including studio, two-bedroom apartments, and companion suites. Residents ease their minds with round-the-clock care and assistance from a compassionate, dedicated, and trained team.

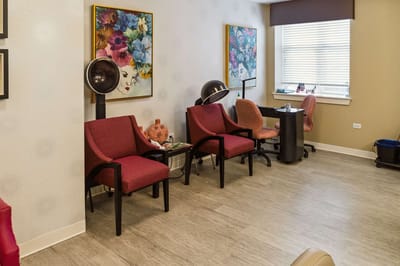
The community fosters a bright and friendly environment, orchestrating a wide array of fun activities and learning opportunities. The culinary team serves freshly made healthy and delicious meals that cater to residents’ dietary needs and cravings. Sunrise of Westmont provides a haven for relaxation and wellness with its beautiful campus filled with wonderful amenities such as exercise rooms, a salon, and a movie theater.

(630) 960-4400

Quality ratings

Measured by Centers for Medicare & Medicaid Services (CMS)

Overall rating Info The Overall CMS Rating combines results from health inspections, staffing levels and quality measures. Health inspections carry the most weight. Staffing and quality scores can increase or decrease the final rating based on performance compared to state and national standards.
▼ 60.3% Below IL avg. ▼ 60.3% Below IL avg.IL average: 2.5Click the badge to see the full State ranking.Click here to see the full State ranking.
Health Inspection Info Based on the results of the facility's three most recent standard inspections and any complaint investigations. CMS reviews the number, scope, and severity of deficiencies, with more recent findings weighted more heavily.
▼ 28.0% Below IL avg. ▼ 28.0% Below IL avg.IL average: 2.8Click the badge to see the full State ranking.Click here to see the full State ranking.
Staffing Info Measures average nursing staff hours per resident per day, including Registered Nurses (RNs) and total nursing staff. Ratings are adjusted based on the level of care residents require and are compared to state and national benchmarks.
▼ 53.2% Below IL avg. ▼ 53.2% Below IL avg.IL average: 2.1Click the badge to see the full State ranking.Click here to see the full State ranking.
Quality Measures Info Based on clinical and physical health indicators reported to CMS, such as hospital readmissions, falls, pressure ulcers, and improvements in mobility. These measures reflect how well residents' health needs are being managed.
▲ 6.6% Above IL avg. ▲ 6.6% Above IL avg.IL average: 2.8Click the badge to see the full State ranking.Click here to see the full State ranking.

Staffing hours breakdown

Info Daily nursing hours per resident by staff type, reported to CMS. Higher is generally better — compare this facility to state and national averages to see where staffing stands.

Hours per resident per day — compared to Illinois state averages

Total nursing care / resident Info This home is ranked 114th out of 172 homes in Illinois for nurse hours. Total adjusted nursing hours per resident per day, combining RN, LPN, and aide time. CMS adjusts this for case-mix so facilities can be fairly compared.
2h 39m per day
Rank #114 / 172Nurse hours — State benchmarkedThis home is ranked 114th out of 172 homes in Illinois. Shows adjusted nurse hours per resident per day benchmarked to the Illinois average, with a ranking across 172 Illinois facilities. More hours mean more direct care. The national average is about 3.5 hrs; below 3.0 is a red flag.Rankings are based only on facilities in Illinois that report data for that category. Facilities without available data are excluded from the ranking.Click the rank badge to see the full State ranking.Click here to see the full State ranking.
This facility Illinois avg (3h 6m per day)
vs Illinois avg
-15%

3 of 6 metrics below state avg

Standout metric Nurse Aide is +17% above state avg
Staff typeHours / Day / Residentvs state avg
Registered Nurse (RN) Info RNs hold the highest nursing license and can assess residents, interpret test results, and direct care plans. More RN hours per day often signals stronger clinical oversight and faster response to health changes. 23m per day ▼ 47% State avg: 43m per day · National avg: 41m per day
LPN / LVN Info Licensed Practical Nurses (LPNs) or Licensed Vocational Nurses (LVNs) deliver routine hands-on care — medication administration, wound dressing, and monitoring vital signs. They work under RN supervision and make up a large share of daily bedside care. 45m per day ▲ 16% State avg: 39m per day · National avg: 52m per day
Nurse Aide Info Certified Nurse Aides (CNAs) provide the most direct day-to-day assistance: bathing, dressing, feeding, and mobility. Nurse aide hours are typically the largest staffing category and directly affect residents' quality of life. 2h 28m per day ▲ 17% State avg: 2h 7m per day · National avg: 2h 20m per day
Weekend Total Nursing Info Combined nursing hours (RN + LPN + Nurse Aide) per resident per day on weekends. Staffing often drops on weekends — this figure reveals whether the facility maintains adequate coverage outside of weekday hours. 3h 26m per day ▲ 11% State avg: 3h 6m per day · National avg: 3h 27m per day
Physical Therapist Info Hours per resident per day provided by licensed Physical Therapists (PTs) or PT Assistants. PT services help residents recover mobility after injury or illness and are especially important for post-acute (short-stay) rehabilitation. 1m per day ▼ 63% State avg: 3m per day · National avg: 4m per day
Weekend RN Info Registered nurse hours specifically on weekends. Facilities sometimes reduce RN presence on Saturdays and Sundays — a low weekend RN figure compared to weekday hours can indicate reduced clinical oversight when most administrative staff are absent. 17m per day ▼ 49% State avg: 33m per day · National avg: 29m per day

Capacity and availability

Avg. Length of Stay
1,003 days
Bed community size
107-bed community Rank #111 / 426Bed count — State benchmarkedThis home is ranked 111th out of 426 homes in Illinois. Shows this facility's certified or reported bed count compared to other Illinois facilities. Larger communities may offer more amenities, programs, and on-site services for residents and families.Rankings are based only on facilities in Illinois that report data for that category. Facilities without available data are excluded from the ranking.Click the rank badge to see the full State ranking.Click here to see the full State ranking.
A larger shared setting that may offer more common spaces and organized community services.
Years in operation
1 year in operation
A newer community that may feature more recent facilities and programs.
Walk Score
Walk Score: 66 / 100 Rank #187 / 648Walk Score — State benchmarkedThis home is ranked 187th out of 648 homes in Illinois. Shows how walkable this facility's neighborhood is compared to the average Walk Score across Illinois facilities. Higher scores benefit residents, families, and staff.Rankings are based only on facilities in Illinois that report data for that category. Facilities without available data are excluded from the ranking.Click the rank badge to see the full State ranking.Click here to see the full State ranking.
Moderately walkable. Some errands can be accomplished on foot, with a mix of nearby amenities.

About this community

Occupancy

Occupancy rate
90%
Rank #31 / 204Occupancy rate — State benchmarkedThis home is ranked 31st out of 204 homes in Illinois. Shows this facility's occupancy rate versus the Illinois average, with its Statewide rank out of 204. Higher occupancy signals strong local demand and financial stability.Rankings are based only on facilities in Illinois that report data for that category. Facilities without available data are excluded from the ranking.Click the rank badge to see the full State ranking.Click here to see the full State ranking.
Higher than the Illinois average: 69.3%
Occupied beds
97 / 107
Average occupied beds in Illinois homes 93 beds

License Details

Facility TypeAssisted Living/shared Housing Establishment
StatusActive
IssuanceJune 13, 2025
ExpirationJune 13, 2026 Expired
CountyDupage
License Number5108938

Ownership & Operating Entity

Sunrise of Westmont is legally operated by Aspired Living Westmont Opco Llc.

Type Of Units

Permanent Units
73 units
Alzheimer's Units
34 units
Total beds
107 units

Contact Sunrise of Westmont

Inspection History

In Illinois, the Department of Public Health, Office of Health Care Regulation conducts annual unannounced surveys to assess compliance with state and federal healthcare facility standards.

Since 2025 · 1 year of data 10 deficiencies 8 inspections

Inspection Scorecard Info This scorecard compares key inspection, citation, and complaint metrics at this facility against the Illinois state average. Metrics rated ≥15% worse than average are highlighted in red; those ≥15% better are highlighted in green.

Since 2025 vs. Illinois state average
Overall vs. IL average 3 Worse Metrics worse than Illinois average:
• Total deficiencies (43% above)
• Deficiencies per year (43% above)
• Deficiencies per inspection (44% above)
1 At Avg Metrics at Illinois average:
• Total inspections (at IL avg)
0 Better No metrics in this bucket.
Latest Inspection April 20, 2026 Complaint Original Investigation;30D FRI Inspection

Deficiencies Info Deficiencies are formal regulatory issues recorded during state inspections.

This FacilityIL Averagevs. IL Avg
Total deficiencies Info Formal regulatory issues recorded by inspectors across all inspection types. 107 This facility has 43% more total deficiencies than a typical Illinois assisted living residence (10 vs. IL avg 7).↑ 43% worse
Deficiencies per year Info Average deficiencies per year since 2025. 107 This facility has 43% more deficiencies per year than a typical Illinois assisted living residence (10 vs. IL avg 7).↑ 43% worse
Deficiencies per inspection Info Average deficiencies per inspection. 1.30.9 This facility has 44% more deficiencies per inspection than a typical Illinois assisted living residence (1.3 vs. IL avg 0.9).↑ 44% worse

Inspections Info State inspections evaluate whether the facility meets health and safety standards.

This FacilityIL Averagevs. IL Avg
Total inspections Info Combined count of all routine and focused inspections. Excludes complaint investigations. 88 This facility has total inspections in line with the Illinois average (8 vs. IL avg 8).— At avg

Inspection Reports Summary Info An editor-reviewed summary of the themes and findings across this facility's recent inspection reports.

  • July 1, 2025 inspection substantiated complaints about inadequate dining staff, failure to update fall prevention plans, poor resident monitoring, and incomplete resident records with four deficiencies cited.
  • October 7, 2025 complaint investigation found failure to report a serious fall incident within 24 hours and late submission of final incident reports for two residents.
  • July 11, 2025 plan of correction addressed four deficiencies including staff training, service plans, response to calls, and medical record documentation with systemic changes planned.

Health Inspection History

Inspections since 2023
Total health inspections 12

Illinois average 10.4


Last Health inspection on Jul 2025

Total health citations
50 Rank #132 / 172Health citations — State benchmarkedThis home is ranked 132nd out of 172 homes in Illinois. Shows this facility's total health deficiency citations benchmarked to the Illinois State average, with a ranking across all 172 IL facilities. Lower citation counts earn a better rank.Rankings are based only on facilities in Illinois that report data for that category. Facilities without available data are excluded from the ranking.Click the rank badge to see the full State ranking.Click here to see the full State ranking.

Illinois average 36.8

Citations per inspection
4.17 Rank #129 / 172Citations per inspection — State benchmarkedThis home is ranked 129th out of 172 homes in Illinois. Shows average deficiency citations per CMS inspection for this facility versus the Illinois mean across 172 facilities with citation data. Lower is better.Rankings are based only on facilities in Illinois that report data for that category. Facilities without available data are excluded from the ranking.Click the rank badge to see the full State ranking.Click here to see the full State ranking.

Illinois average 3.68


Health citations are formal notices following inspections when they fail to comply with safety and care standards.

31 of 50 citations resulted from standard inspections; and 19 of 50 resulted from complaint investigations.

Breakdown of citation severity (last 3 years)
Critical health citations
1
43% worse than Illinois average

Illinois average: 0.7


Serious health citations
4
11% worse than Illinois average

Illinois average: 3.6

1 critical citation Illinois average: 0.7

4 serious citations Illinois average: 3.6

45 moderate citations Illinois average: 32

0 minor citations Illinois average: 0.5
Citations history (last 3 years)
Abuse/Neglect moderate citation Jul 23, 2025
Corrected

Environmental moderate citation Jul 23, 2025
Corrected

Infection Control moderate citation Jul 23, 2025
Corrected

Nutrition moderate citation Jul 23, 2025
Corrected

Staffing Data

Reporting period: October 1 – December 31, 2025 (Q4 2025). Source: CMS Payroll-Based Journal report.

Total staff 143
Employees 66
Contractors 77
Staff to resident ratio 1.86 : 1
0% compared with Illinois average
Illinois average ratio: 1.80 : 1 Illinois average ratio: 1.80 : 1See full Illinois ranking
Avg staff/day 36
Average shift 8.5 hours
12% better than Illinois average
Illinois average: 7.6 hours Illinois average shift: 7.6 hoursSee full Illinois ranking
Total staff hours (quarter) 27,983

Nursing staff breakdown

Q4 2025 · Oct 1 – Dec 31 More info This data comes from the CMS Payroll-Based Journal report covering October 1 – December 31, 2025.
Registered Nurse

Manages medical care and health needs.

RN Staff Info 26 total: 6 full-time employees and 20 contractors. 26
Average shift length Info Average shift length. Calculated as total hours divided by days worked and average staff per day. 9.8 hours
Licensed Practical Nurse

Assists with medical care and medications.

LPN Staff Info 24 total: 9 full-time employees and 15 contractors. 24
Average shift length Info Average shift length. Calculated as total hours divided by days worked and average staff per day. 9.7 hours
Certified Nursing Assistant

Helps with daily care and mobility.

CNA Staff Info 67 total: 40 full-time employees and 27 contractors. 67
Average shift length Info Average shift length. Calculated as total hours divided by days worked and average staff per day. 8.4 hours

Contractor staffing

Q4 2025 · Oct 1 – Dec 31 More info This data comes from the CMS Payroll-Based Journal report covering October 1 – December 31, 2025.

Total hours from contractors

12.9%

3,604 contractor hours this quarter

Certified Nursing Assistant: 27 Registered Nurse: 20 Licensed Practical Nurse: 15 Physical Therapy Assistant: 4 Speech Language Pathologist: 3 Physical Therapy Aide: 2 Qualified Social Worker: 2 Respiratory Therapy Technician: 1 Medical Director: 1 Occupational Therapy Assistant: 1 Occupational Therapy Aide: 1

Staff by category

Q4 2025 · Oct 1 – Dec 31 More info This data comes from the CMS Payroll-Based Journal report covering October 1 – December 31, 2025.
Certified Nursing Assistant40276716,05892100%8.4
Licensed Practical Nurse915244,88992100%9.7
Registered Nurse620261,9829199%9.8
Other Dietary Services Staff4041,6018896%7.9
Administrator1014966267%8
Physical Therapy Aide0224796267%7.7
Dietitian1014706065%7.8
Mental Health Service Worker1014705964%8
Dental Services Staff1014585964%7.8
Nurse Practitioner2023985358%7.5
Physical Therapy Assistant0441653134%5.3
Speech Language Pathologist0331632527%6.5
Respiratory Therapy Technician0111213740%3.3
Clinical Nurse Specialist1011041314%8
Qualified Social Worker022652628%2.5
Occupational Therapy Assistant0112433%8
Medical Director011221112%2
Occupational Therapy Aide0112067%3.3
67 Certified Nursing Assistant
% of Days 100%
24 Licensed Practical Nurse
% of Days 100%
26 Registered Nurse
% of Days 99%
4 Other Dietary Services Staff
% of Days 96%
1 Administrator
% of Days 67%
2 Physical Therapy Aide
% of Days 67%
1 Dietitian
% of Days 65%
1 Mental Health Service Worker
% of Days 64%
1 Dental Services Staff
% of Days 64%
2 Nurse Practitioner
% of Days 58%
4 Physical Therapy Assistant
% of Days 34%
3 Speech Language Pathologist
% of Days 27%
1 Respiratory Therapy Technician
% of Days 40%
1 Clinical Nurse Specialist
% of Days 14%
2 Qualified Social Worker
% of Days 28%
1 Occupational Therapy Assistant
% of Days 3%
1 Medical Director
% of Days 12%
1 Occupational Therapy Aide
% of Days 7%

Penalties and fines

Includes penalties issued in 2024

Federal penalties imposed by CMS for regulatory violations, including civil money penalties (fines) and denials of payment for new Medicare/Medicaid admissions.

Source: CMS Penalties Database (Data as of Jan 2026)

Total fines amount $76K Rank #122 / 173Federal fines — State benchmarkedThis home is ranked 122nd out of 173 homes in Illinois. Shows this facility's cumulative CMS federal fine dollars versus the Illinois average among facilities with fines, and where it ranks among 173 facilities in the pool. Lower total dollars mean a better rank.Rankings are based only on facilities in Illinois that report data for that category. Facilities without available data are excluded from the ranking.Click the rank badge to see the full State ranking.Click here to see the full State ranking.
47% lower than Illinois average

Illinois average: $143K

Number of fines 2
33% fewer fines than Illinois average

Illinois average: 3.0

Payment Denials Info Serious action where Medicare and/or Medicaid temporarily stops payments for new residents until issues are fixed. 1
6% fewer payment denials than Illinois average

Illinois average: 1.1

Fines amount comparison
This facility $76K
Illinois average $143K
Penalty History

Penalties are imposed by CMS for violations of federal nursing home regulations.

1 penalty in the past 3 years

May 1, 2024 · $12K

Civil Money Penalty Info Fines imposed for noncompliance, which can be assessed per day or per instance of violation. May 1, 2024
$12K

Last updated: Jan 2026

Quality of care over time

These measures show how residents usually do over time at this home, based on health outcomes and preventive care.

High-risk clinical events score Info A composite score based on pressure ulcers, falls with injury, weight loss, walking ability decline, and activities of daily living decline. 4.6
52% better than Illinois average

Illinois average: 9.7

Functional decline score Info A composite score based on activities of daily living decline, walking ability decline, and incontinence. 9.5
49% better than Illinois average

Illinois average: 18.6

Long-stay resident measures
Need for Help with Daily Activities Increased Info Percent of long-stay residents whose need for help with daily activities has increased 5.5%
65% better than Illinois average

Illinois average: 15.5%

Walking Ability Worsened Info Percent of long-stay residents whose ability to move independently worsened 5.7%
69% better than Illinois average

Illinois average: 18.4%

Low Risk Residents with Bowel/Bladder Incontinence Info Percent of low risk long-stay residents who lose control of their bowels or bladder 17.2%
20% better than Illinois average

Illinois average: 21.6%

Falls with Major Injury Info Percent of long-stay residents experiencing one or more falls with major injury 2.3%
31% better than Illinois average

Illinois average: 3.4%

High Risk Residents with Pressure Ulcers Info Percent of long-stay high risk residents with pressure ulcers 6.5%
24% worse than Illinois average

Illinois average: 5.3%

Urinary Tract Infection Info Percent of long-stay residents with a urinary tract infection 2.7%
50% worse than Illinois average

Illinois average: 1.8%

Lost Too Much Weight Info Percent of long-stay residents who lose too much weight 3.2%
52% better than Illinois average

Illinois average: 6.5%

Depressive Symptoms Info Percent of long-stay residents who have depressive symptoms 14.4%
70% better than Illinois average

Illinois average: 48.1%

Antipsychotic Use Info Percent of long-stay residents who received an antipsychotic medication 19.5%
In line with Illinois average

Illinois average: 20.2%

Pneumococcal Vaccine Info Percent of long-stay residents assessed and appropriately given the pneumococcal vaccine 85.8%
In line with Illinois average

Illinois average: 89.2%

Influenza Vaccine Info Percent of long-stay residents assessed and appropriately given the seasonal influenza vaccine 100.0%
9% better than Illinois average

Illinois average: 91.6%

Breakdown by payment type

Medicare

31% of new residents, usually for short-term rehab.

Typical stay 22 days

Private pay

16% of new residents, often for short stays.

Typical stay 1 - 2 years

Medicaid

53% of new residents, often for long-term daily care.

Typical stay 4 years

Facility Characteristics

Source: CMS Long-Term Care Facility Characteristics (Data as of Jan 2026)

Total residents 77
Medicaid
72
93.5% of residents
Private pay or other
5
6.5% of residents
Programs & Services
Residents Group

Residents meet regularly to discuss policies, care quality, and activities

Nurse Aide Training

State-approved Nurse Aide Training and Competency Evaluation Program on-site

Active Resident Council

Organized group of residents that meets regularly to discuss facility policies, quality of life, and activities.

Finances and operations

Based on CMS SNF Cost Report for fiscal year ending in 06/2024.

Governmental community
Operated by a subsidized facility district.
Net patient revenue Info Net patient revenue — what the home actually collects for resident care, after contractual allowances, bad debt and discounts are subtracted from its gross charges (CMS cost report, Worksheet G-3). It covers resident care only; money the home earns from other sources is shown separately as "Other income."
$9.5M
Net patient income Info Net patient income: net patient revenue minus the home's total operating expenses. A positive figure means it earns more from resident care than it spends to deliver it; a negative figure means the opposite. It excludes non-operating "other income."
-$1.7M
Governmental community Operated by a subsidized facility district.
Net patient revenue Info Net patient revenue — what the home actually collects for resident care, after contractual allowances, bad debt and discounts are subtracted from its gross charges (CMS cost report, Worksheet G-3). It covers resident care only; money the home earns from other sources is shown separately as "Other income."
$9.5M Rank #132 / 171Revenue — State benchmarkedThis home is ranked 132nd out of 171 homes in Illinois. Shows this facility's annual revenue compared to the Illinois average. Higher revenue generally means more resources for staffing and capital — read alongside Payroll %.Rankings are based only on facilities in Illinois that report data for that category. Facilities without available data are excluded from the ranking.Click the rank badge to see the full State ranking.Click here to see the full State ranking.
Net patient income Info Net patient income: net patient revenue minus the home's total operating expenses. A positive figure means it earns more from resident care than it spends to deliver it; a negative figure means the opposite. It excludes non-operating "other income."
-$1.7M
Other income Info Money the home earns outside of resident care — such as investments, grants, rentals and other non-operating sources (CMS cost report, Worksheet G-3). It is tracked separately from net patient revenue: it is not part of that figure, and it is not included in net patient income.
$558.9K
Payroll costs Info Staff salaries plus wage-related costs — benefits such as payroll taxes, health insurance and retirement — from the home's own accounting records (CMS cost report, Worksheet A). Contract or agency labor is counted separately, under other operating costs. Rank #111 / 171Payroll — State benchmarkedThis home is ranked 111th out of 171 homes in Illinois. Shows total annual staff payroll benchmarked to the Illinois average. Higher payroll investment relative to peers often signals better staffing and less reliance on cheaper contract labor.Rankings are based only on facilities in Illinois that report data for that category. Facilities without available data are excluded from the ranking.Click the rank badge to see the full State ranking.Click here to see the full State ranking.
$6.0M 63.3% of net patient revenue Info Payroll as a share of revenue: staff salaries and wage-related benefits divided by net patient revenue. A higher figure means more of each revenue dollar goes to staff pay. Rank #35 / 171Payroll % — State benchmarkedThis home is ranked 35th out of 171 homes in Illinois. Shows payroll as a percentage of revenue versus the Illinois average. Well-run Illinois facilities typically land around 54–67% — the top third Statewide. Below 25% may signal understaffing or heavy agency use — read with Staffing ratings.Rankings are based only on facilities in Illinois that report data for that category. Facilities without available data are excluded from the ranking.Click the rank badge to see the full State ranking.Click here to see the full State ranking.
Other operating costs Info Everything it costs to run the home apart from payroll — food, utilities, supplies, maintenance, contract labor and administration. Calculated as total operating expense minus payroll (staff salaries and wage-related benefits).
$5.1M
Total costs Info The home's total operating expense for the year — all the costs of running it, salaries included (CMS cost report, Worksheet G-3).
$11.1M

What does this home offer?

Pets allowed icon
Pets allowed icon

Pets Allowed

Housing options icon

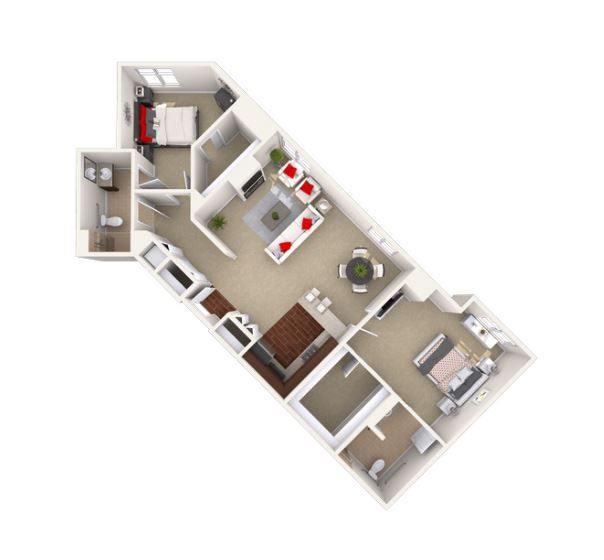
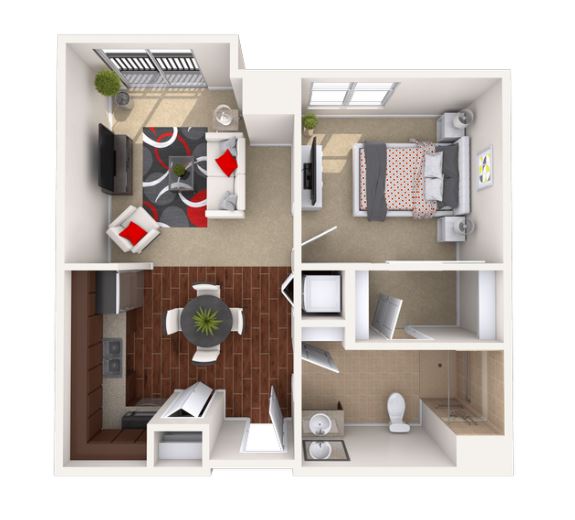
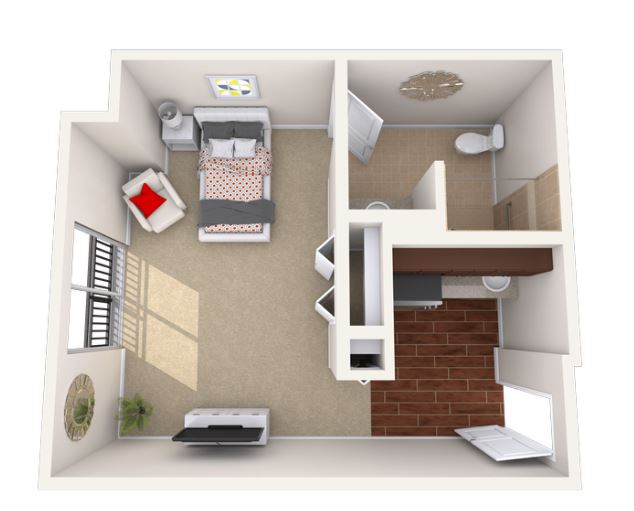
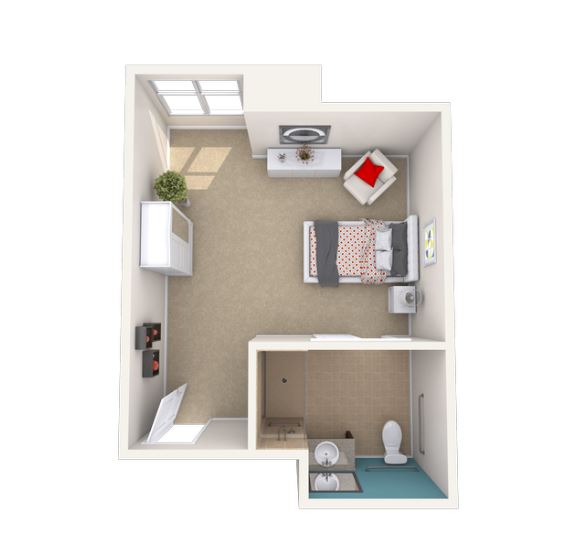
Housing Options: Studio / Suite / 1 Bed / 2 Bed

Building type icon
Building type icon

Building Type: 3-story

Transportation services icon

Transportation Services

Fitness and recreation icon

Fitness and Recreation

Type of Rooms Available

1 Bed
1 Bed
1 Bed
1 / 4
1 Bed
1

Who this home usually serves

TYPE OF STAY

Mostly long-term care residents

Most residents stay for extended periods and receive ongoing daily care.

Most new residents arrive under Medicaid (53% of admissions), and a typical Medicaid stay runs around 4 years.

Admissions
32 total

Coverage residents most often arrive under.

Medicare 31%
Private pay 16%
Medicaid 53%
Discharges
29 total

Coverage residents most often leave under.

Medicare 34%
Private pay 14%
Medicaid 52%

Living Spaces & Floor Plans for Sunrise of Westmont

Sunrise Of Westmontp3
Sunrise Of Westmont P2
Sunrise Of Westmont P1
Sunrise Of Westmont P4

Places of interest near Sunrise of Westmont

Address 9.2 miles from city center Info Estimated distance in miles from Westmont's city center to Sunrise of Westmont's address, calculated via Google Maps. — 8.52 miles to nearest hospital (Endeavor Health Edward Hospital)

Calculate Travel Distance to Sunrise of Westmont

Add your location

Address

Compare Assisted Living around Naperville

The information below is reported by the Illinois Department of Public Health, Office of Health Care Regulation.

Sunrise of Westmont
AL
NH
MC
RC
Westmont -
107
Facility 107
IL AVG 86
Rank #111 / 426
-
66
Facility 66
IL AVG 51
Rank #187 / 648
Studio / Suite / 1 Bed / 2 Bed
The Springs at Monarch Landing
AL
MC
NH
RC
Naperville (Naperville Park District) -
28
Facility 28
IL AVG 86
Rank #390 / 426
-
27
Facility 27
IL AVG 51
Rank #517 / 648
Private Rooms / Semi-Private Rooms
Meadowbrook Naperville
AL
MC
NH
RC
Naperville (Raymond Drive) -
249
Facility 249
IL AVG 86
Rank #8 / 426
-
52
Facility 52
IL AVG 51
Rank #310 / 648
-
Alden Estates of Naperville
AL
HC
MC
NC
NH
RC
Naperville (Naperville Park District) -
203
Facility 203
IL AVG 86
Rank #26 / 426
-
45
Facility 45
IL AVG 51
Rank #380 / 648
-

Financial Assistance for
Assisted Living in Illinois

Sunrise of Westmont is located in Westmont, Illinois.
Here are the financial assistance programs available to residents in Illinois.

Get Financial aid guidance

Community Care Program

Illinois CCP

Age 60+
General Illinois resident, at risk of nursing home placement.
Income Limits (2025) ~$1,215/month individual
Asset Limits $17,500 individual, excludes home, car
IL

High demand in urban areas; waitlists possible.

Benefits
In-home care (3-5 hours/day) Adult day services ($65/day) Emergency home response systems ($30/month)

Illinois Respite Program

IL Respite (via NFCSP)

Age Caregiver of someone 60+ (or with dementia)
General Illinois resident.
Income Limits No strict limit; prioritizes low-income.
Asset Limits Not applicable.
IL

Limited slots; urban/rural balance.

Benefits
In-home respite (4-6 hours/day) Adult day care (~$65/day) Short-term facility care (up to 5 days)

Supportive Living Program (SLP)

Illinois Medicaid Supportive Living Program

Age 65+ or 22-64 with disability
General Illinois resident, Medicaid-eligible, needs moderate assistance (not nursing home-level).
Income Limits (2025) ~$2,829/month (300% FBR, individual); QIT allowed.
Asset Limits $2,000 (individual), $3,000 (couple) (excludes home, car).
IL

~200 SLP sites statewide; room/board not covered.

Benefits
Personal care (5-7 hours/day, e.g., bathing, mobility) Meals Housekeeping Medication management Respite (~240 hours/year)

Persons Who Are Elderly Waiver

Illinois Medicaid Elderly Waiver

Age 65+
General Illinois resident, Medicaid-eligible, nursing home-level care need.
Income Limits (2025) ~$2,829/month 300% FBR, individual
Asset Limits $2,000 (individual), $3,000 (couple).
IL

Part of HealthChoice Illinois; consumer-directed options available.

Benefits
Personal care (5-7 hours/day, e.g., dressing, eating) Homemaker Adult day care (~$60/day) Respite (240 hours/year) Home mods ($1,000 avg.)

Medicare Savings Program (MSP)

Illinois Medicare Savings Program

Age 65+ or disabled
General Illinois resident, Medicare Part A/B.
Income Limits (2025) ~$2,510/month (QMB), ~$3,380/month (SLMB), ~$3,598/month (QI)—individual.
Asset Limits $9,430 (individual), $14,130 (couple).
IL

Three tiers; no waitlist.

Benefits
Covers Part B premiums ($174.70/month) Deductibles ($240/year) Copays (~20%)

Optional State Supplementation (OSS)

Illinois Optional State Supplementation

Age 65+ or disabled
General Illinois resident, in approved facility, SSI recipient or low-income.
Income Limits (2025) ~$1,004/month including SSI
Asset Limits $2,000 (individual), $3,000 (couple).
IL

~$50-$500/month based on facility type.

Benefits
Cash (~$50-$500/month) for room/board in personal care homes or SLFs

VA Aid and Attendance (A&A) and Housebound Benefits

Illinois VA Aid and Attendance/Housebound

Age 65+ or disabled veteran/spouse
General Illinois resident, wartime service, need for ADL help (A&A) or homebound.
Income Limits (2025) Net income < ~$1,984/month (veteran with dependent, A&A); pension offsets income.
Asset Limits ~$155,356 net worth limit
IL

High veteran demand in urban/rural areas.

Benefits
Cash (~$1,433-$2,642/month veteran, ~$951-$1,318 spouse) for care costs (e.g., in-home, assisted living)

Frequently Asked Questions about Sunrise of Westmont

What neighborhood is Sunrise of Westmont in?

Sunrise of Westmont is in the Westmont neighborhood of Westmont.

Who is the owner of Sunrise of Westmont?

The legal owner and operator of Sunrise of Westmont is Aspired Living Westmont Opco Llc.

Is Sunrise of Westmont in a walkable area?

Sunrise of Westmont has a walk score of 66. Moderately walkable. Some errands can be accomplished on foot, with a mix of nearby amenities.

What is the license number of Sunrise of Westmont?

According to IL state health department records, Sunrise of Westmont's license number is 5108938.

When does Sunrise of Westmont's license expire?

According to IL state health department records, Sunrise of Westmont's license expires on June 13, 2026.

What is the occupancy rate at Sunrise of Westmont?

Sunrise of Westmont's occupancy is 90%.

How many beds does Sunrise of Westmont have?

Sunrise of Westmont has 107 beds.

Guides for Better Senior Living

Care Cost Calculator: See Prices in Your Area

Nursing Home Data Explorer

Don’t Wait Too Long: 7 Red Flag Signs Your Parent Needs Assisted Living Now

The True Cost of Assisted Living in 2025 – And How Families Are Paying For It

Understanding Senior Living Costs: Pricing Models, Discounts & Financial Assistance