


Symphony Manor
Assisted Living, Memory Care & Respite Care · Baltimore, MD
Symphony Manor
Assisted Living, Memory Care & Respite Care · Baltimore, MD
Overview of Symphony Manor
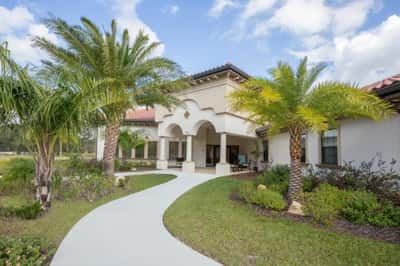
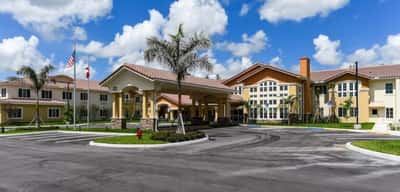
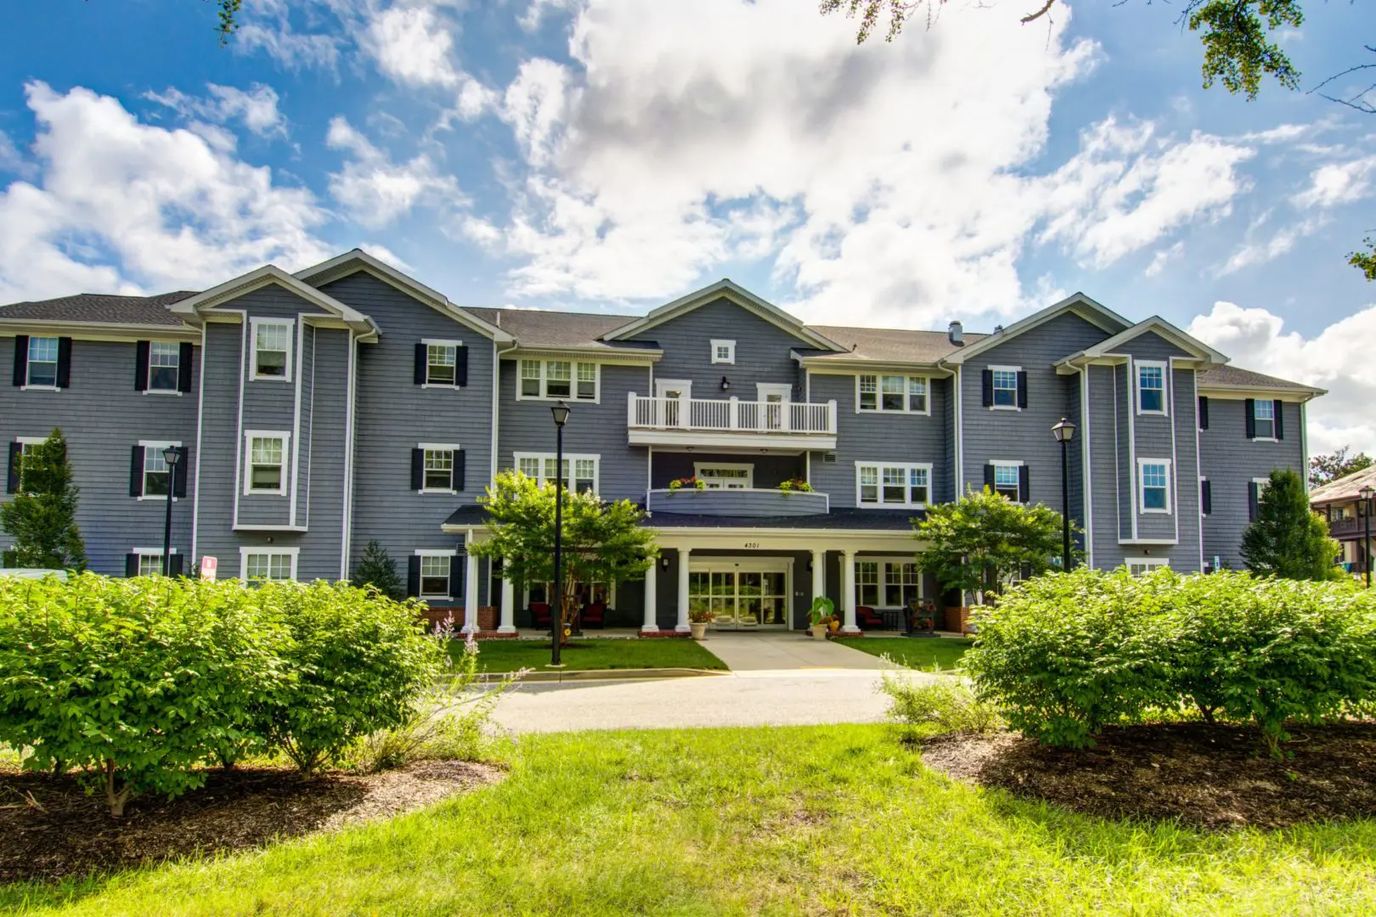
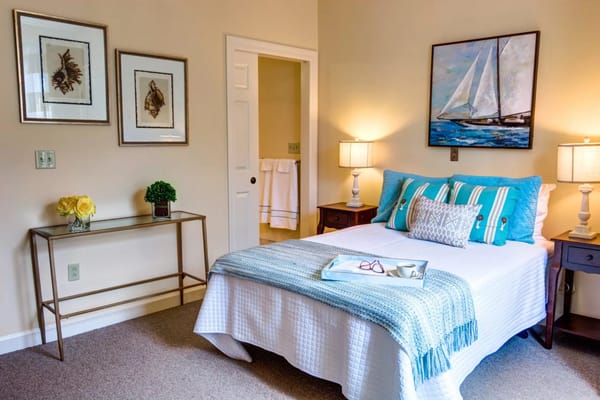
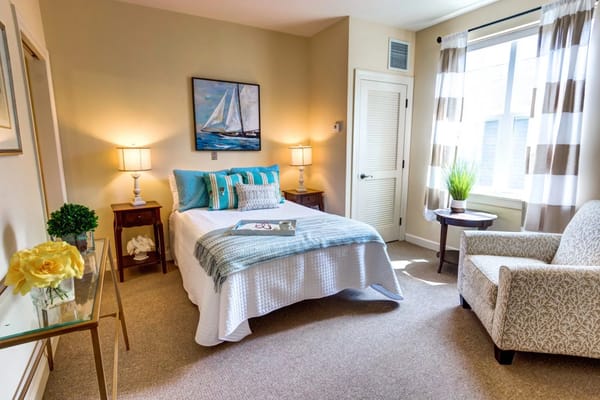
Symphony Manor boasts their breathtaking views of Baltimore. Symphony Manor is considerably one of the premier assisted living communities in Baltimore, that presents a home-like experience with personalized care provided for each resident. An assisted living facility, Symphony Manor provides a unique accommodation for specific needs of residents. Albeit with the kind of assistance they receive, management and staff surely promotes an independent life where they are still able to do what they want. At Symphony Manor, residents feel more comfortable and safe in a community they trust because meaningful relationships are also built in the community as staff are encouraged to provide genuine care. Symphony Manor aims to enhance the quality of life for all their seniors who need additional assistance with everyday living; hence, making them one of the trusted assisted living communities in Baltimore that is warm and welcoming to its residents and their families.
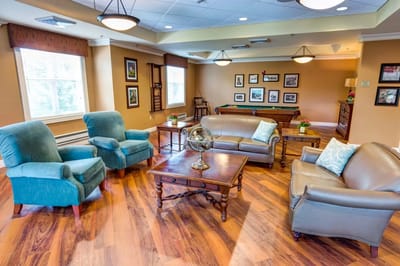
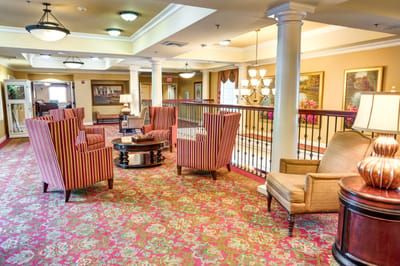
An upscale community that guarantees cozy apartments where residents can feel comfortable after a day of doing activities. There’s a list of activities residents are encouraged to sign up for– recreational, physical, and mental. The assisted living community, residents still are able to live a comfortable and easy experience as they are encouraged to live life on their own terms. With all these convenient accommodations, it’s still encouraged by staff to have residents live an independent lifestyle– they can still do whatever it is they like while still receiving help. The assisted living life plan community has encouraged a vibrant social life for seniors to mingle and create new memories with residents their age.
69-bed community Rank #195 / 697Bed count — State benchmarkedThis home is ranked 195th out of 697 homes in Maryland. Shows this facility's certified or reported bed count compared to other Maryland facilities. Larger communities may offer more amenities, programs, and on-site services for residents and families.Rankings are based only on facilities in Maryland that report data for that category. Facilities without available data are excluded from the ranking.Click the rank badge to see the full State ranking.Click here to see the full State ranking.
A moderately sized community that may balance personal attention with shared amenities and social activities.
15 years in operation Rank #132 / 208Years in operation — State benchmarkedThis home is ranked 132nd out of 208 homes in Maryland. Shows how long this facility has been in operation compared to other Maryland facilities. Longer operating histories may benefit residents, families, and staff.Rankings are based only on facilities in Maryland that report data for that category. Facilities without available data are excluded from the ranking.Click the rank badge to see the full State ranking.Click here to see the full State ranking.
A community with a solid operating history and experience delivering ongoing care.
Walk Score: 71 / 100 Rank #175 / 985Walk Score — State benchmarkedThis home is ranked 175th out of 985 homes in Maryland. Shows how walkable this facility's neighborhood is compared to the average Walk Score across Maryland facilities. Higher scores benefit residents, families, and staff.Rankings are based only on facilities in Maryland that report data for that category. Facilities without available data are excluded from the ranking.Click the rank badge to see the full State ranking.Click here to see the full State ranking.
Very walkable. Most errands can be accomplished on foot, and many essentials are within a short walk.
About this community
Facility TypeAssisted Living
CountyBaltimore City
Private Room
$200 - $200 per day
Hospice Affiliations
Staffing
Key information about the people who lead and staff this community.
ContactMs. Vonda Homan
Dedicated Alzheimer's Unit
Mild Alzheimer's Level
Moderate Alzheimer's Level
Severe Alzheimer's Level
Demographics
Resident demographic information for this facility.
Gender
- Female 79.4%
- Male 20.6%
Age Distribution
- 75-84 44.1%
- 95+ 23.5%
- 85-94 17.7%
- 65-74 14.7%
Ethnicity
- White 79.4%
- African American 19.1%
- Asian 1.5%
What does this home offer?
Minimum Age: 55 Years Old
Pets Allowed
Room Sizes: 310 sq. ft
Housing Options: Studio
Building Type: Apartments
Transportation Services
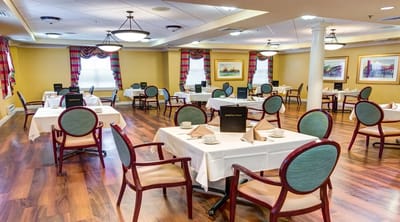
Fitness and Recreation
Care Cost
Type of Rooms Available
1 / 4
Studio
1
310 sq. ft
Places of interest near Symphony Manor
![]() 4.6 miles from city center
4.6 miles from city center
![]() Estimated distance in miles from Baltimore's city center to Symphony Manor's address, calculated via Google Maps.
— 1.54 miles to nearest hospital (Sinai Hospital)
Estimated distance in miles from Baltimore's city center to Symphony Manor's address, calculated via Google Maps.
— 1.54 miles to nearest hospital (Sinai Hospital)
Calculate Travel Distance to Symphony Manor
Add your location
Compare Assisted Living around Baltimore
The information below is reported by the Maryland Department of Health, Office of Health Care Quality.
| Sunrise of Annapolis | AL MC | Annapolis | 106
Facility
106
MD AVG
43
Rank
#105 / 697 | Yes |
38
Facility
38
MD AVG
43
Rank
#542 / 985 | Studio / 1 Bed / 2 Bed | 30
Facility
30
MD AVG
21
Rank
#44 / 208 | - |
31% Male Residents — State Benchmarked 31% of residents are male, compared to the Maryland average of 31%. This facility caters to a majority female resident pool (69% female), consistent with the broader assisted living trend where women significantly outnumber men. |
69% Female Residents — State Benchmarked 69% of residents are female, compared to the Maryland average of 69%. Women comprise the large majority, consistent with national assisted living demographics where women live longer and enter care facilities at higher rates. |
90% White Residents — State Benchmarked 90% of residents are reported as White, compared to the Maryland average of 81%. A higher White share than is typical for assisted living in Maryland in this dataset — compare with peer facilities for local context. |
6% African American Residents — State Benchmarked 6% of residents are reported as African American or Black, compared to the Maryland average of 13%. In line with the Maryland average for African American residents among facilities reporting this breakdown. |
4% Other Ethnicity Residents — State Benchmarked 4% of residents fall into categories other than White or African American (combined), compared to the Maryland average of 6%. This column aggregates Hispanic, Asian, multiracial, and any other labeled groups that are not classified as White or African American. Reported subgroups in this total: American Indian (1%), Hawaiian/Pacific Islander (1%), Hispanic (1%). |
12% Residents Age 65–74 — State Benchmarked 12% of residents are 65–74, compared to the Maryland average of 13%. In line with the statewide profile for this youngest senior bracket in assisted living. |
22% Residents Age 75–84 — State Benchmarked 22% of residents are 75–84, compared to the Maryland average of 31%. Below the state norm — the resident mix may skew either younger or older than this typical middle bracket. |
65% Residents Age 85–94 — State Benchmarked 65% of residents are 85–94, compared to the Maryland average of 44%. A high concentration of very elderly residents signals a higher-acuity facility with experience caring for advanced age-related needs. | - |
| Brightview White Marsh | AL MC | Nottingham | 99
Facility
99
MD AVG
43
Rank
#131 / 697 | No |
49
Facility
49
MD AVG
43
Rank
#431 / 985 | Studio / 1 Bed | 25
Facility
25
MD AVG
21
Rank
#83 / 208 | - |
17% Male Residents — State Benchmarked 17% of residents are male, compared to the Maryland average of 31%. This facility caters to a majority female resident pool (83% female), consistent with the broader assisted living trend where women significantly outnumber men. |
83% Female Residents — State Benchmarked 83% of residents are female, compared to the Maryland average of 69%. Women comprise the large majority, consistent with national assisted living demographics where women live longer and enter care facilities at higher rates. |
98% White Residents — State Benchmarked 98% of residents are reported as White, compared to the Maryland average of 81%. A higher White share than is typical for assisted living in Maryland in this dataset — compare with peer facilities for local context. |
2% African American Residents — State Benchmarked 2% of residents are reported as African American or Black, compared to the Maryland average of 13%. A lower African American share than is typical in Maryland; local markets still vary widely. |
0% Other Ethnicity Residents — State Benchmarked 0% of residents fall into categories other than White or African American (combined), compared to the Maryland average of 6%. This column aggregates Hispanic, Asian, multiracial, and any other labeled groups that are not classified as White or African American. |
3% Residents Age 65–74 — State Benchmarked 3% of residents are 65–74, compared to the Maryland average of 13%. Fewer younger seniors suggests the resident population skews older, likely requiring higher acuity care and more hands-on support. |
17% Residents Age 75–84 — State Benchmarked 17% of residents are 75–84, compared to the Maryland average of 31%. Below the state norm — the resident mix may skew either younger or older than this typical middle bracket. |
51% Residents Age 85–94 — State Benchmarked 51% of residents are 85–94, compared to the Maryland average of 44%. A high concentration of very elderly residents signals a higher-acuity facility with experience caring for advanced age-related needs. |
29% Residents Age 95+ — State Benchmarked 29% of residents are 95 or older, compared to the Maryland average of 16%. A high proportion of the oldest-old suggests strong end-of-life care experience and very-high-acuity capabilities. |
| Brightview Catonsville | AL MC | Catonsville (South Rolling Road) | 95
Facility
95
MD AVG
43
Rank
#145 / 697 | Yes |
23
Facility
23
MD AVG
43
Rank
#704 / 985 | Studio / 1 Bed / 2 Bed | 24
Facility
24
MD AVG
21
Rank
#92 / 208 | - |
37% Male Residents — State Benchmarked 37% of residents are male, compared to the Maryland average of 31%. This facility caters to a majority female resident pool (63% female), consistent with the broader assisted living trend where women significantly outnumber men. |
63% Female Residents — State Benchmarked 63% of residents are female, compared to the Maryland average of 69%. Closer to an even gender split than most assisted living facilities, which typically have 65–75% female residents. |
94% White Residents — State Benchmarked 94% of residents are reported as White, compared to the Maryland average of 81%. A higher White share than is typical for assisted living in Maryland in this dataset — compare with peer facilities for local context. |
3% African American Residents — State Benchmarked 3% of residents are reported as African American or Black, compared to the Maryland average of 13%. A lower African American share than is typical in Maryland; local markets still vary widely. |
3% Other Ethnicity Residents — State Benchmarked 3% of residents fall into categories other than White or African American (combined), compared to the Maryland average of 6%. This column aggregates Hispanic, Asian, multiracial, and any other labeled groups that are not classified as White or African American. Reported subgroups in this total: Hispanic (3%). |
1% Residents Age 65–74 — State Benchmarked 1% of residents are 65–74, compared to the Maryland average of 13%. Fewer younger seniors suggests the resident population skews older, likely requiring higher acuity care and more hands-on support. |
34% Residents Age 75–84 — State Benchmarked 34% of residents are 75–84, compared to the Maryland average of 31%. This is the second most common age bracket in assisted living, representing residents with moderate care needs. |
40% Residents Age 85–94 — State Benchmarked 40% of residents are 85–94, compared to the Maryland average of 44%. This is typically the most common age bracket in assisted living — this facility is in line with the statewide norm. |
22% Residents Age 95+ — State Benchmarked 22% of residents are 95 or older, compared to the Maryland average of 16%. A high proportion of the oldest-old suggests strong end-of-life care experience and very-high-acuity capabilities. |
| Brightview Mays Chapel Ridge | AL IL MC | Timonium (Dixon Hill) | 89
Facility
89
MD AVG
43
Rank
#160 / 697 | No |
52
Facility
52
MD AVG
43
Rank
#402 / 985 | Studio / 1 Bed / 2 Bed | 50
Facility
50
MD AVG
21
Rank
#1 / 208 | A+ |
13% Male Residents — State Benchmarked 13% of residents are male, compared to the Maryland average of 31%. This facility caters to a majority female resident pool (87% female), consistent with the broader assisted living trend where women significantly outnumber men. |
87% Female Residents — State Benchmarked 87% of residents are female, compared to the Maryland average of 69%. Women comprise the large majority, consistent with national assisted living demographics where women live longer and enter care facilities at higher rates. |
99% White Residents — State Benchmarked 99% of residents are reported as White, compared to the Maryland average of 81%. A higher White share than is typical for assisted living in Maryland in this dataset — compare with peer facilities for local context. |
0% African American Residents — State Benchmarked 0% of residents are reported as African American or Black, compared to the Maryland average of 13%. A lower African American share than is typical in Maryland; local markets still vary widely. |
1% Other Ethnicity Residents — State Benchmarked 1% of residents fall into categories other than White or African American (combined), compared to the Maryland average of 6%. This column aggregates Hispanic, Asian, multiracial, and any other labeled groups that are not classified as White or African American. Reported subgroups in this total: Asian (1%). |
3% Residents Age 65–74 — State Benchmarked 3% of residents are 65–74, compared to the Maryland average of 13%. Fewer younger seniors suggests the resident population skews older, likely requiring higher acuity care and more hands-on support. |
30% Residents Age 75–84 — State Benchmarked 30% of residents are 75–84, compared to the Maryland average of 31%. This is the second most common age bracket in assisted living, representing residents with moderate care needs. |
48% Residents Age 85–94 — State Benchmarked 48% of residents are 85–94, compared to the Maryland average of 44%. This is typically the most common age bracket in assisted living — this facility is in line with the statewide norm. |
18% Residents Age 95+ — State Benchmarked 18% of residents are 95 or older, compared to the Maryland average of 16%. In line with the statewide profile for the oldest resident bracket. |
| Symphony Manor | AL MC RC | Baltimore (Roland Park) | 69
Facility
69
MD AVG
43
Rank
#195 / 697 | Yes |
71
Facility
71
MD AVG
43
Rank
#175 / 985 | Studio | 15
Facility
15
MD AVG
21
Rank
#132 / 208 | - |
21% Male Residents — State Benchmarked 21% of residents are male, compared to the Maryland average of 31%. This facility caters to a majority female resident pool (79% female), consistent with the broader assisted living trend where women significantly outnumber men. |
79% Female Residents — State Benchmarked 79% of residents are female, compared to the Maryland average of 69%. Women comprise the large majority, consistent with national assisted living demographics where women live longer and enter care facilities at higher rates. |
79% White Residents — State Benchmarked 79% of residents are reported as White, compared to the Maryland average of 81%. Close to the average for this category among assisted living facilities in Maryland with reported race/ethnicity data. |
19% African American Residents — State Benchmarked 19% of residents are reported as African American or Black, compared to the Maryland average of 13%. In line with the Maryland average for African American residents among facilities reporting this breakdown. |
1% Other Ethnicity Residents — State Benchmarked 1% of residents fall into categories other than White or African American (combined), compared to the Maryland average of 6%. This column aggregates Hispanic, Asian, multiracial, and any other labeled groups that are not classified as White or African American. Reported subgroups in this total: Asian (1%). |
15% Residents Age 65–74 — State Benchmarked 15% of residents are 65–74, compared to the Maryland average of 13%. In line with the statewide profile for this youngest senior bracket in assisted living. |
44% Residents Age 75–84 — State Benchmarked 44% of residents are 75–84, compared to the Maryland average of 31%. A high concentration in this mid-range bracket, where residents typically need moderate support with daily activities. |
18% Residents Age 85–94 — State Benchmarked 18% of residents are 85–94, compared to the Maryland average of 44%. The population here skews younger than the statewide norm, which may indicate a more active, lower-acuity community. |
24% Residents Age 95+ — State Benchmarked 24% of residents are 95 or older, compared to the Maryland average of 16%. A high proportion of the oldest-old suggests strong end-of-life care experience and very-high-acuity capabilities. |
Financial Assistance for
Assisted Living in Maryland
Symphony Manor is located in Baltimore, Maryland.
Here are the financial assistance programs available to residents in Maryland.
More homes from the same operator
Operated by
Elegance Living
Frequently Asked Questions about Symphony Manor
What neighborhood is Symphony Manor in?
Symphony Manor is in the Roland Park neighborhood of Baltimore.
Is Symphony Manor in a walkable area?
Symphony Manor has a walk score of 71. Very walkable. Most errands can be accomplished on foot, and many essentials are within a short walk.
How many beds does Symphony Manor have?
Symphony Manor has 69 beds.
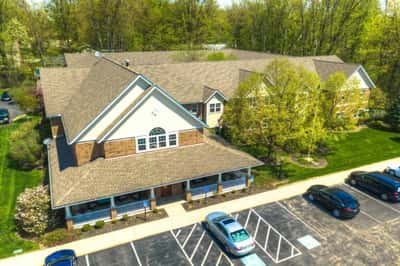
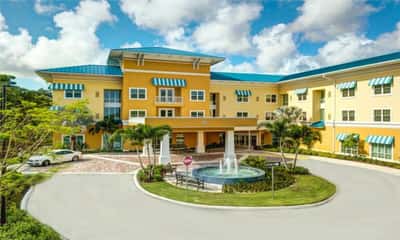
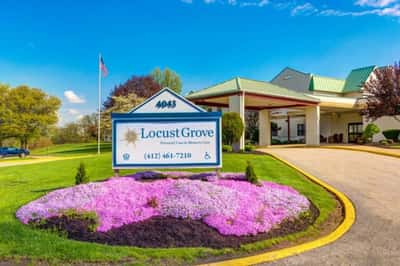
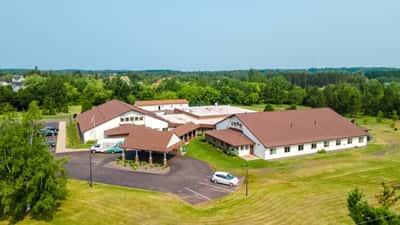
Are there photos of Symphony Manor?
Yes — there are 4 photos of Symphony Manor in the photo gallery on this page.
What is the address of Symphony Manor?
Symphony Manor is located at 4301 Roland Ave, Baltimore, MD 21210.
What is the phone number of Symphony Manor?
(716) 683-5150 will put you in contact with the team at Symphony Manor.
What county is Symphony Manor located in?
Symphony Manor is in Baltimore City County.
Guides for Better Senior Living
Care Cost Calculator: See Prices in Your Area
Assisted Living Explorer
Don’t Wait Too Long: 7 Red Flag Signs Your Parent Needs Assisted Living Now
The True Cost of Assisted Living in 2025 – And How Families Are Paying For It
Understanding Senior Living Costs: Pricing Models, Discounts & Financial Assistance
Updated on
