Tabor Hills
Nursing Home, Assisted Living, Independent Living & Respite Care · Morgantown, WV
CMS overall rating Info CMS (the Centers for Medicare & Medicaid Services) is the federal agency that rates nursing home quality. Its Overall Rating runs from 1 to 5 stars, combining health inspections, staffing, and quality measures, with inspections weighted most heavily.

Tabor Hills

Nursing Home, Assisted Living, Independent Living & Respite Care · Morgantown, WV
CMS overall rating Info CMS (the Centers for Medicare & Medicaid Services) is the federal agency that rates nursing home quality. Its Overall Rating runs from 1 to 5 stars, combining health inspections, staffing, and quality measures, with inspections weighted most heavily.
Calculator: See prices in your area
Tabor Hills accepts Medicare, Medicaid, and private pay.

Overview of Tabor Hills

Tabor Hills, a campus of caring with a rich history spanning back to 1894, has evolved into a sanctuary catering to both orphans and seniors. Spanning 52 acres of exquisitely landscaped grounds, this institution offers a holistic array of options, including supportive living, independent living, and healthcare services, providing a seamless blend of senior living housing options. Its comprehensive approach encompasses subacute care, outpatient rehabilitation, and long-term nursing home care, all thoughtfully designed to cater to diverse needs.

Nestled within Naperville, Illinois, Tabor Hills thrives as an authentic haven with lush outdoor spaces, interconnected by tranquil walking paths. The facility also features an inviting pool, set within a picturesque suburban neighborhood, offering seniors a serene backdrop to rest and rejuvenate. With its rich legacy, thriving ambiance, and commitment to both senior living housing and nursing home care, Tabor Hills remains a steadfast and nurturing presence dedicated to enriching the lives of its cherished residents.

(630) 778-6677

Quality ratings

Measured by Centers for Medicare & Medicaid Services (CMS)

Overall rating Info The Overall CMS Rating combines results from health inspections, staffing levels and quality measures. Health inspections carry the most weight. Staffing and quality scores can increase or decrease the final rating based on performance compared to state and national standards.
▲ 84.8% Above WV avg. ▲ 84.8% Above WV avg.WV average: 2.7Click the badge to see the full State ranking.Click here to see the full State ranking.
Health Inspection Info Based on the results of the facility's three most recent standard inspections and any complaint investigations. CMS reviews the number, scope, and severity of deficiencies, with more recent findings weighted more heavily.
▲ 42.3% Above WV avg. ▲ 42.3% Above WV avg.WV average: 2.8Click the badge to see the full State ranking.Click here to see the full State ranking.
Staffing Info Measures average nursing staff hours per resident per day, including Registered Nurses (RNs) and total nursing staff. Ratings are adjusted based on the level of care residents require and are compared to state and national benchmarks.
▲ 101.3% Above WV avg. ▲ 101.3% Above WV avg.WV average: 2.5Click the badge to see the full State ranking.Click here to see the full State ranking.
Quality Measures Info Based on clinical and physical health indicators reported to CMS, such as hospital readmissions, falls, pressure ulcers, and improvements in mobility. These measures reflect how well residents' health needs are being managed.
▲ 60.1% Above WV avg. ▲ 60.1% Above WV avg.WV average: 3.1Click the badge to see the full State ranking.Click here to see the full State ranking.

Staffing hours breakdown

Info Daily nursing hours per resident by staff type, reported to CMS. Higher is generally better — compare this facility to state and national averages to see where staffing stands.

Hours per resident per day — compared to West Virginia state averages

Total nursing care / resident Info This home is ranked 24th out of 172 homes in West Virginia for nurse hours. Total adjusted nursing hours per resident per day, combining RN, LPN, and aide time. CMS adjusts this for case-mix so facilities can be fairly compared.
4h 34m per day
Rank #24 / 172Nurse hours — State benchmarkedThis home is ranked 24th out of 172 homes in Illinois. Shows adjusted nurse hours per resident per day benchmarked to the Illinois average, with a ranking across 172 Illinois facilities. More hours mean more direct care. The national average is about 3.5 hrs; below 3.0 is a red flag.Rankings are based only on facilities in Illinois that report data for that category. Facilities without available data are excluded from the ranking.Click the rank badge to see the full State ranking.Click here to see the full State ranking.
This facility West Virginia avg (3h 37m per day)
vs West Virginia avg
+26%

1 of 6 metrics below state avg

Standout metric Weekend RN is +263% above state avg
Staff typeHours / Day / Residentvs state avg
Registered Nurse (RN) Info RNs hold the highest nursing license and can assess residents, interpret test results, and direct care plans. More RN hours per day often signals stronger clinical oversight and faster response to health changes. 1h 59m per day ▲ 181% State avg: 42m per day · National avg: 41m per day
LPN / LVN Info Licensed Practical Nurses (LPNs) or Licensed Vocational Nurses (LVNs) deliver routine hands-on care — medication administration, wound dressing, and monitoring vital signs. They work under RN supervision and make up a large share of daily bedside care. 28m per day ▼ 48% State avg: 55m per day · National avg: 52m per day
Nurse Aide Info Certified Nurse Aides (CNAs) provide the most direct day-to-day assistance: bathing, dressing, feeding, and mobility. Nurse aide hours are typically the largest staffing category and directly affect residents' quality of life. 2h 45m per day ▲ 33% State avg: 2h 5m per day · National avg: 2h 20m per day
Weekend Total Nursing Info Combined nursing hours (RN + LPN + Nurse Aide) per resident per day on weekends. Staffing often drops on weekends — this figure reveals whether the facility maintains adequate coverage outside of weekday hours. 4h 16m per day ▲ 32% State avg: 3h 14m per day · National avg: 3h 27m per day
Physical Therapist Info Hours per resident per day provided by licensed Physical Therapists (PTs) or PT Assistants. PT services help residents recover mobility after injury or illness and are especially important for post-acute (short-stay) rehabilitation. 4m per day ▲ 41% State avg: 3m per day · National avg: 4m per day
Weekend RN Info Registered nurse hours specifically on weekends. Facilities sometimes reduce RN presence on Saturdays and Sundays — a low weekend RN figure compared to weekday hours can indicate reduced clinical oversight when most administrative staff are absent. 1h 26m per day ▲ 263% State avg: 24m per day · National avg: 29m per day

Capacity and availability

This home usually has availability

Lower occupancy than the West Virginia average: 89.9%
Occupancy rate
62.2% Rank #144 / 204Occupancy rate — State benchmarkedThis home is ranked 144th out of 204 homes in Illinois. Shows this facility's occupancy rate versus the Illinois average, with its Statewide rank out of 204. Higher occupancy signals strong local demand and financial stability.Rankings are based only on facilities in Illinois that report data for that category. Facilities without available data are excluded from the ranking.Click the rank badge to see the full State ranking.Click here to see the full State ranking.
Avg. Length of Stay
62 days
Bed community size
96-bed community Rank #136 / 426Bed count — State benchmarkedThis home is ranked 136th out of 426 homes in Illinois. Shows this facility's certified or reported bed count compared to other Illinois facilities. Larger communities may offer more amenities, programs, and on-site services for residents and families.Rankings are based only on facilities in Illinois that report data for that category. Facilities without available data are excluded from the ranking.Click the rank badge to see the full State ranking.Click here to see the full State ranking.
A larger shared setting that may offer more common spaces and organized community services.
Walk Score
Walk Score: 21 / 100 Rank #550 / 648Walk Score — State benchmarkedThis home is ranked 550th out of 648 homes in Illinois. Shows how walkable this facility's neighborhood is compared to the average Walk Score across Illinois facilities. Higher scores benefit residents, families, and staff.Rankings are based only on facilities in Illinois that report data for that category. Facilities without available data are excluded from the ranking.Click the rank badge to see the full State ranking.Click here to see the full State ranking.
Car-dependent. Most errands require a car, with limited nearby walkable options.
BBB Rating
BBB Rating: A+ (Not Accredited)
An independent rating from the Better Business Bureau based on factors such as complaint history, transparency, and business practices.
How BBB ratings work

Staffing

Key information about the people who lead and staff this community.

Leadership

ContactGloria Pediack

Contact Tabor Hills

Health Inspection History

Inspections since 2022
Total health inspections 3

West Virginia average 4.8


Last Health inspection on May 2024
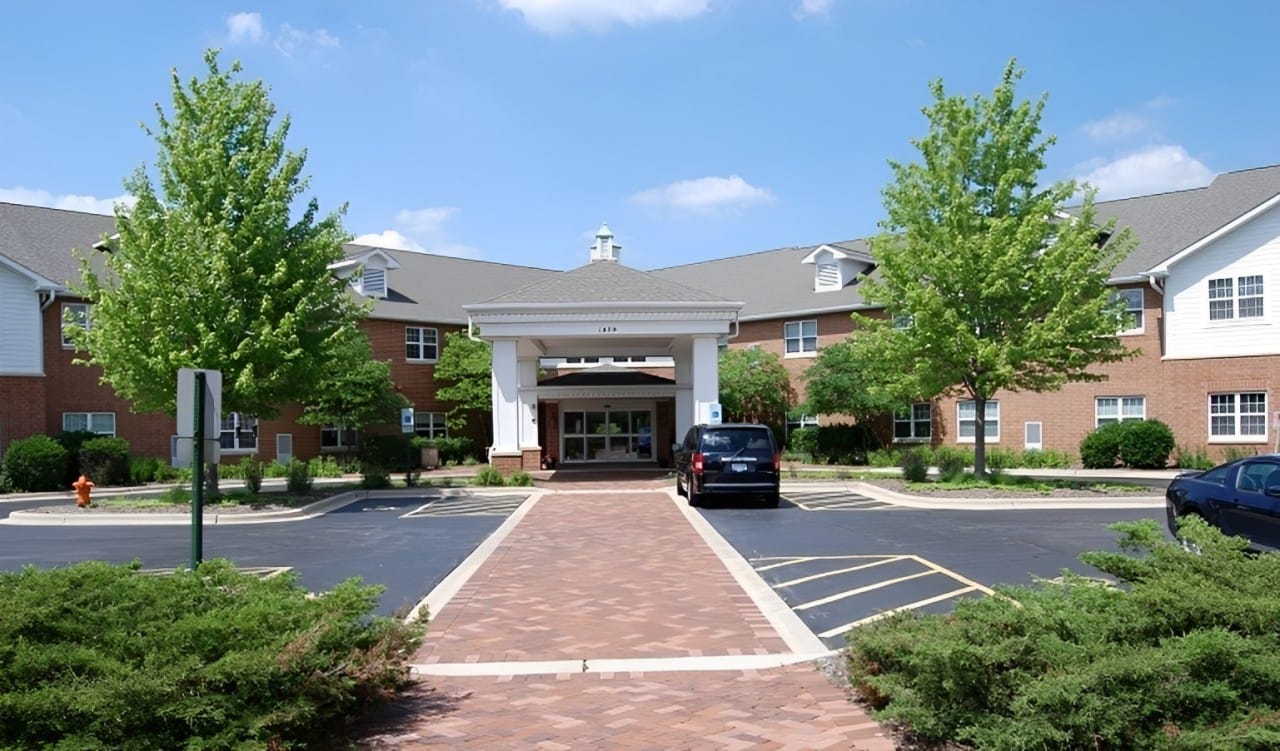
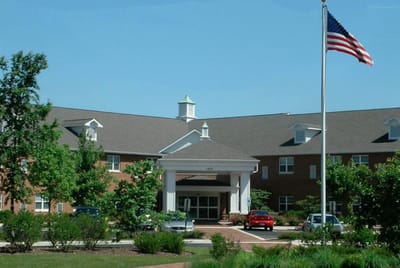
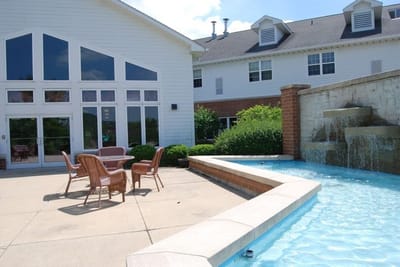
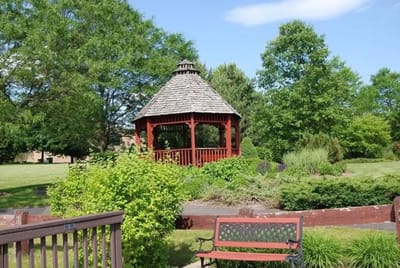
Total health citations
14 Rank #21 / 172Health citations — State benchmarkedThis home is ranked 21st out of 172 homes in Illinois. Shows this facility's total health deficiency citations benchmarked to the Illinois State average, with a ranking across all 172 IL facilities. Lower citation counts earn a better rank.Rankings are based only on facilities in Illinois that report data for that category. Facilities without available data are excluded from the ranking.Click the rank badge to see the full State ranking.Click here to see the full State ranking.

West Virginia average 43.1

Citations per inspection
4.67 Rank #143 / 172Citations per inspection — State benchmarkedThis home is ranked 143rd out of 172 homes in Illinois. Shows average deficiency citations per CMS inspection for this facility versus the Illinois mean across 172 facilities with citation data. Lower is better.Rankings are based only on facilities in Illinois that report data for that category. Facilities without available data are excluded from the ranking.Click the rank badge to see the full State ranking.Click here to see the full State ranking.

West Virginia average 9.25


Health citations are formal notices following inspections when they fail to comply with safety and care standards.

All 14 citations resulted from standard inspections.

Breakdown of citation severity (last 4 years)
Critical health citations
0
100% better than West Virginia average

West Virginia average: 0.8


Serious health citations
0
100% better than West Virginia average

West Virginia average: 0.5

0 critical citations West Virginia average: 0.8

0 serious citations West Virginia average: 0.5

14 moderate citations West Virginia average: 41.5

0 minor citations West Virginia average: 0.3
Citations history (last 4 years)
Infection Control moderate citation May 09, 2024
Corrected

Nutrition moderate citation May 09, 2024
Corrected

Quality of Care moderate citation May 09, 2024
Corrected

Quality of Care moderate citation May 09, 2024
Corrected

Staffing Data

Reporting period: October 1 – December 31, 2025 (Q4 2025). Source: CMS Payroll-Based Journal report.

Total staff 170
Employees 78
Contractors 92
Staff to resident ratio 2.66 : 1
79% more staff per resident than West Virginia average
West Virginia average ratio: 1.48 : 1 West Virginia average ratio: 1.48 : 1See full West Virginia ranking
Avg staff/day 47
Average shift 8.8 hours
5% better than West Virginia average
West Virginia average: 8.4 hours West Virginia average shift: 8.4 hoursSee full West Virginia ranking
Total staff hours (quarter) 38,222

Nursing staff breakdown

Q4 2025 · Oct 1 – Dec 31 More info This data comes from the CMS Payroll-Based Journal report covering October 1 – December 31, 2025.
Registered Nurse

Manages medical care and health needs.

RN Staff Info 24 total: 18 full-time employees and 6 contractors. 24
Average shift length Info Average shift length. Calculated as total hours divided by days worked and average staff per day. 10 hours
Licensed Practical Nurse

Assists with medical care and medications.

LPN Staff Info 12 total: 4 full-time employees and 8 contractors. 12
Average shift length Info Average shift length. Calculated as total hours divided by days worked and average staff per day. 9.8 hours
Certified Nursing Assistant

Helps with daily care and mobility.

CNA Staff Info 89 total: 45 full-time employees and 44 contractors. 89
Average shift length Info Average shift length. Calculated as total hours divided by days worked and average staff per day. 8.9 hours

Contractor staffing

Q4 2025 · Oct 1 – Dec 31 More info This data comes from the CMS Payroll-Based Journal report covering October 1 – December 31, 2025.

Total hours from contractors

13.6%

5,201 contractor hours this quarter

Certified Nursing Assistant: 44 Licensed Practical Nurse: 8 Respiratory Therapy Technician: 7 Registered Nurse: 6 Physical Therapy Assistant: 6 Qualified Social Worker: 6 Physical Therapy Aide: 5 Speech Language Pathologist: 5 Qualified Activities Professional: 4 Occupational Therapy Assistant: 1

Staff by category

Q4 2025 · Oct 1 – Dec 31 More info This data comes from the CMS Payroll-Based Journal report covering October 1 – December 31, 2025.
Certified Nursing Assistant45448918,24192100%8.9
Registered Nurse186248,52292100%10
Clinical Nurse Specialist7074,0609098%9
Licensed Practical Nurse48121,9968997%9.8
RN Director of Nursing2021,1047379%8.3
Speech Language Pathologist0559617683%7.8
Physical Therapy Assistant0666207683%7
Physical Therapy Aide0556035964%7.2
Administrator1015286672%8
Nurse Practitioner1015286672%8
Respiratory Therapy Technician0774386571%6.4
Qualified Social Worker0664116672%4.8
Qualified Activities Professional0441658592%1.9
Occupational Therapy Assistant0114578%6.4
89 Certified Nursing Assistant
% of Days 100%
24 Registered Nurse
% of Days 100%
7 Clinical Nurse Specialist
% of Days 98%
12 Licensed Practical Nurse
% of Days 97%
2 RN Director of Nursing
% of Days 79%
5 Speech Language Pathologist
% of Days 83%
6 Physical Therapy Assistant
% of Days 83%
5 Physical Therapy Aide
% of Days 64%
1 Administrator
% of Days 72%
1 Nurse Practitioner
% of Days 72%
7 Respiratory Therapy Technician
% of Days 71%
6 Qualified Social Worker
% of Days 72%
4 Qualified Activities Professional
% of Days 92%
1 Occupational Therapy Assistant
% of Days 8%

Penalties and fines

Federal penalties imposed by CMS for regulatory violations, including civil money penalties (fines) and denials of payment for new Medicare/Medicaid admissions.

Source: CMS Penalties Database

No penalties in the past 3 years

No civil money penalties or payment denials were reported in the last 3 years.

Quality of care over time

These measures show how residents usually do over time at this home, based on health outcomes and preventive care.

High-risk clinical events score Info A composite score based on pressure ulcers, falls with injury, weight loss, walking ability decline, and activities of daily living decline. 5.4
45% better than West Virginia average

West Virginia average: 9.7

Functional decline score Info A composite score based on activities of daily living decline, walking ability decline, and incontinence. 16.2
13% better than West Virginia average

West Virginia average: 18.6

Long-stay resident measures
Need for Help with Daily Activities Increased Info Percent of long-stay residents whose need for help with daily activities has increased 8.7%
44% better than West Virginia average

West Virginia average: 15.5%

Walking Ability Worsened Info Percent of long-stay residents whose ability to move independently worsened 12.8%
31% better than West Virginia average

West Virginia average: 18.4%

Low Risk Residents with Bowel/Bladder Incontinence Info Percent of low risk long-stay residents who lose control of their bowels or bladder 27.2%
26% worse than West Virginia average

West Virginia average: 21.6%

Falls with Major Injury Info Percent of long-stay residents experiencing one or more falls with major injury 0.0%
100% better than West Virginia average

West Virginia average: 3.4%

High Risk Residents with Pressure Ulcers Info Percent of long-stay high risk residents with pressure ulcers 1.4%
73% better than West Virginia average

West Virginia average: 5.3%

Urinary Tract Infection Info Percent of long-stay residents with a urinary tract infection 4.5%
149% worse than West Virginia average

West Virginia average: 1.8%

Lost Too Much Weight Info Percent of long-stay residents who lose too much weight 4.0%
39% better than West Virginia average

West Virginia average: 6.5%

Depressive Symptoms Info Percent of long-stay residents who have depressive symptoms 0.6%
99% better than West Virginia average

West Virginia average: 48.1%

Antipsychotic Use Info Percent of long-stay residents who received an antipsychotic medication 14.0%
31% better than West Virginia average

West Virginia average: 20.2%

Pneumococcal Vaccine Info Percent of long-stay residents assessed and appropriately given the pneumococcal vaccine 100.0%
12% better than West Virginia average

West Virginia average: 89.2%

Influenza Vaccine Info Percent of long-stay residents assessed and appropriately given the seasonal influenza vaccine 100.0%
9% better than West Virginia average

West Virginia average: 91.6%

Short-stay resident measures
Pneumococcal Vaccine Info Percent of short-stay residents assessed and appropriately given the pneumococcal vaccine 98.9%
45% better than West Virginia average

West Virginia average: 68.3%

Antipsychotic medication increase Info Percent of short-stay residents who newly received an antipsychotic medication 1.4%
42% better than West Virginia average

West Virginia average: 2.3%

Influenza Vaccine Info Percent of short-stay residents assessed and appropriately given the seasonal influenza vaccine 93.8%
49% better than West Virginia average

West Virginia average: 63.0%

Breakdown by payment type

Medicare

70% of new residents, usually for short-term rehab.

Typical stay 20 days

Private pay

25% of new residents, often for short stays.

Typical stay 8 - 9 months

Medicaid

5% of new residents, often for long-term daily care.

Typical stay 2 - 3 years

Facility Characteristics

Source: CMS Long-Term Care Facility Characteristics (Data as of Jan 2026)

Total residents 64
Medicare
12
18.8% of residents
Medicaid
30
46.9% of residents
Private pay or other
22
34.4% of residents
Programs & Services
Residents Group

Residents meet regularly to discuss policies, care quality, and activities

Active Resident Council

Organized group of residents that meets regularly to discuss facility policies, quality of life, and activities.

Finances and operations

Based on CMS SNF Cost Report for fiscal year ending in 09/2023.

Governmental community
Operated by a subsidized facility district.
Net patient revenue Info Net patient revenue — what the home actually collects for resident care, after contractual allowances, bad debt and discounts are subtracted from its gross charges (CMS cost report, Worksheet G-3). It covers resident care only; money the home earns from other sources is shown separately as "Other income."
$13.1M
Net patient income Info Net patient income: net patient revenue minus the home's total operating expenses. A positive figure means it earns more from resident care than it spends to deliver it; a negative figure means the opposite. It excludes non-operating "other income."
-$2.8M
Governmental community Operated by a subsidized facility district.
Net patient revenue Info Net patient revenue — what the home actually collects for resident care, after contractual allowances, bad debt and discounts are subtracted from its gross charges (CMS cost report, Worksheet G-3). It covers resident care only; money the home earns from other sources is shown separately as "Other income."
$13.1M Rank #93 / 171Revenue — State benchmarkedThis home is ranked 93rd out of 171 homes in Illinois. Shows this facility's annual revenue compared to the Illinois average. Higher revenue generally means more resources for staffing and capital — read alongside Payroll %.Rankings are based only on facilities in Illinois that report data for that category. Facilities without available data are excluded from the ranking.Click the rank badge to see the full State ranking.Click here to see the full State ranking.
Net patient income Info Net patient income: net patient revenue minus the home's total operating expenses. A positive figure means it earns more from resident care than it spends to deliver it; a negative figure means the opposite. It excludes non-operating "other income."
-$2.8M
Other income Info Money the home earns outside of resident care — such as investments, grants, rentals and other non-operating sources (CMS cost report, Worksheet G-3). It is tracked separately from net patient revenue: it is not part of that figure, and it is not included in net patient income.
$208.1K
Payroll costs Info Staff salaries plus wage-related costs — benefits such as payroll taxes, health insurance and retirement — from the home's own accounting records (CMS cost report, Worksheet A). Contract or agency labor is counted separately, under other operating costs. Rank #37 / 171Payroll — State benchmarkedThis home is ranked 37th out of 171 homes in Illinois. Shows total annual staff payroll benchmarked to the Illinois average. Higher payroll investment relative to peers often signals better staffing and less reliance on cheaper contract labor.Rankings are based only on facilities in Illinois that report data for that category. Facilities without available data are excluded from the ranking.Click the rank badge to see the full State ranking.Click here to see the full State ranking.
$9.8M 74.9% of net patient revenue Info Payroll as a share of revenue: staff salaries and wage-related benefits divided by net patient revenue. A higher figure means more of each revenue dollar goes to staff pay. Rank #6 / 171Payroll % — State benchmarkedThis home is ranked 6th out of 171 homes in Illinois. Shows payroll as a percentage of revenue versus the Illinois average. Well-run Illinois facilities typically land around 54–67% — the top third Statewide. Below 25% may signal understaffing or heavy agency use — read with Staffing ratings.Rankings are based only on facilities in Illinois that report data for that category. Facilities without available data are excluded from the ranking.Click the rank badge to see the full State ranking.Click here to see the full State ranking.
Other operating costs Info Everything it costs to run the home apart from payroll — food, utilities, supplies, maintenance, contract labor and administration. Calculated as total operating expense minus payroll (staff salaries and wage-related benefits).
$6.1M
Total costs Info The home's total operating expense for the year — all the costs of running it, salaries included (CMS cost report, Worksheet G-3).
$15.9M

What does this home offer?

Pets allowed icon
Pets allowed icon

Pets Allowed

Room sizes icon
Room sizes icon

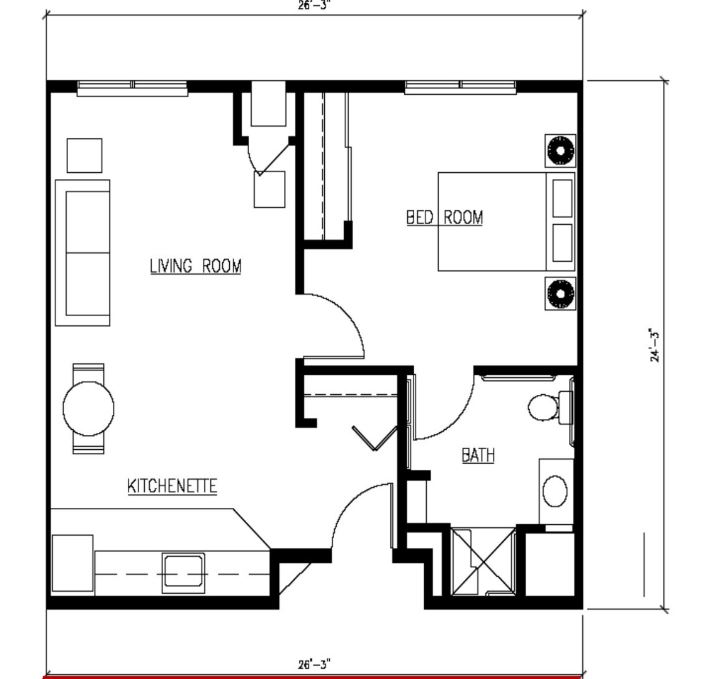
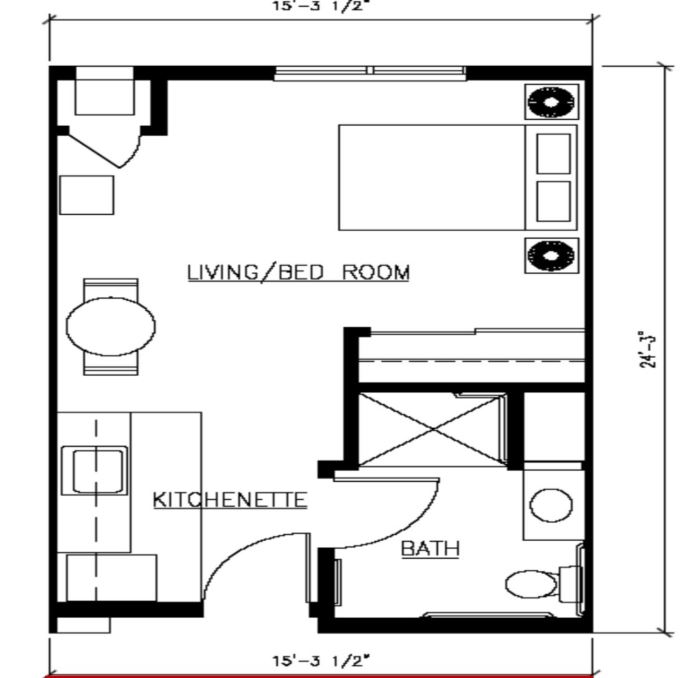
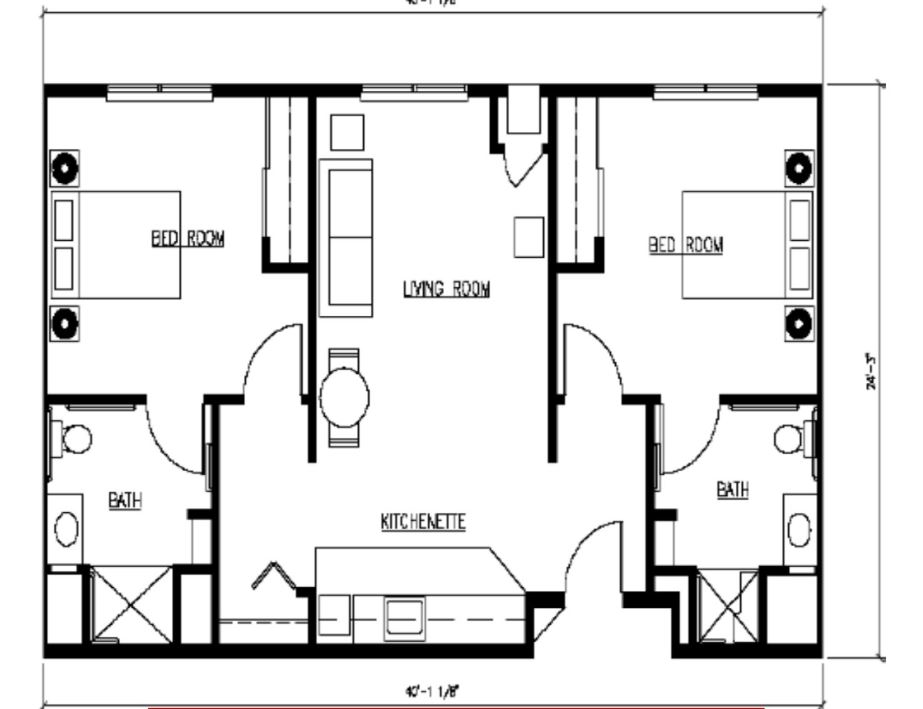
Room Sizes: 337 / 579 / 896 sq. ft

Housing options icon

Housing Options: Studio / 1 Bed / 2 Bed

Building type icon
Building type icon

Building Type: Two-story

Transportation services icon

Transportation Services

Fitness and recreation icon

Fitness and Recreation

Who this home usually serves

TYPE OF STAY

Mostly short-term rehab stays

Most residents typically stay for a few weeks or months before returning home or moving on.

Most new residents arrive under Medicare (70% of admissions), and a typical Medicare stay runs around 20 days.

Admissions
326 total

Coverage residents most often arrive under.

Medicare 70%
Private pay 25%
Medicaid 5%
Discharges
353 total

Coverage residents most often leave under.

Medicare 48%
Private pay 41%
Medicaid 12%

Living Spaces & Floor Plans for Tabor Hills

Tabor Hills 1Bed
Tabor Hills Studio
Tabor Hills 2Bed

Places of interest near Tabor Hills

Address 4.7 miles from city center Info Estimated distance in miles from Naperville's city center to Tabor Hills's address, calculated via Google Maps. — 3.29 miles to nearest hospital (Endeavor Health Edward Hospital)

Calculate Travel Distance to Tabor Hills

Add your location

Address

Compare Nursing Homes around Morgantown

The information below is reported by the West Virginia Department of Health and Human Resources, Office of Health Facility Licensure.

5 facilities compared · CMS & WV Dept. of Health data

Tabor Hills
NH
AL
IL
RC
Naperville (Naperville Park District)96 62.2% -10%4.57 -1%+47%$0144.7-72A+ 21 John Bozett$13.1M$9.8M74.9%145840
Sundale Nursing Home
NH
MC
PC
Morgantown
100
Facility 100
WV AVG 82
Rank #25 / 78
85.0%
Facility 85.0%
WV AVG 89.9%
Rank #41 / 73
-5%
4.17
Facility 4.17
WV AVG 3.62
Rank #7 / 48
-9%+15%
$0
Facility $0
WV AVG $52.9k
Rank #1 / 50
31
Facility 31
WV AVG 43.1
Rank #15 / 50
7.8
Facility 7.8
WV AVG 9.3
Rank #13 / 50
-92-
47
Facility 47
WV AVG 37
Rank #28 / 89
Crossgates Medical Inc
$14.0M
Facility $14.0M
WV AVG $14.1M
Rank #32 / 48
$8.8M
Facility $8.8M
WV AVG $3.9M
Rank #4 / 48
62.7%
Facility 62.7%
WV AVG 30.3%
Rank #1 / 48
515083
Friendship Village of South Hills
NH
AL
IL
MC
Upper St Clair (Boyce)102 78.4% 0%3.93 +3%-5%$0155.0-78- 8 Dina Stover$30.2M$14.6M48.3%395688
Madison Center
NH
HC
PC
RC
Morgantown
62
Facility 62
WV AVG 82
Rank #49 / 78
95.2%
Facility 95.2%
WV AVG 89.9%
Rank #15 / 73
+6%
2.81
Facility 2.81
WV AVG 3.62
Rank #41 / 48
-37%-22%
$30.4k
Facility $30.4k
WV AVG $52.9k
Rank #34 / 50
49
Facility 49
WV AVG 43.1
Rank #34 / 50
16.3
Facility 16.3
WV AVG 9.3
Rank #49 / 50
453-
5
Facility 5
WV AVG 37
Rank #82 / 89
825 Summit Street Operations, LLC
$9.3M
Facility $9.3M
WV AVG $14.1M
Rank #33 / 48
$3.7M
Facility $3.7M
WV AVG $3.9M
Rank #29 / 48
40.3%
Facility 40.3%
WV AVG 30.3%
Rank #21 / 48
515104
Morgantown Healthcare and Rehabilitation Center
NH
AL
Morgantown (Van Voorhis Road)
100
Facility 100
WV AVG 82
Rank #25 / 78
68.0%
Facility 68.0%
WV AVG 89.9%
Rank #61 / 73
-24%
3.07
Facility 3.07
WV AVG 3.62
Rank #34 / 48
+31%-15%
$148.5k
Facility $148.5k
WV AVG $52.9k
Rank #49 / 50
84
Facility 84
WV AVG 43.1
Rank #49 / 50
14.0
Facility 14.0
WV AVG 9.3
Rank #45 / 50
378-
43
Facility 43
WV AVG 37
Rank #37 / 89
Morgantown Heights Of Journey, LLC
$11.4M
Facility $11.4M
WV AVG $14.1M
Rank #34 / 48
$3.8M
Facility $3.8M
WV AVG $3.9M
Rank #36 / 48
33.2%
Facility 33.2%
WV AVG 30.3%
Rank #41 / 48
515049

Financial Assistance for
Nursing Home in West Virginia

Tabor Hills is located in Naperville, West Virginia.
Here are the financial assistance programs available to residents in West Virginia.

Get Financial aid guidance

Aged and Disabled Waiver

WV Medicaid A&D Waiver

Age 65+ or disabled
General West Virginia resident, Medicaid-eligible, nursing home-level care need.
Income Limits (2025) ~$2,829/month 300% FBR, individual
Asset Limits $2,000 (individual), $3,000 (couple).
WV

Rural state; limited providers in some areas.

Benefits
Personal care (5-7 hours/day) Respite (240 hours/year) Adult day care (~$60/day) Home aides

West Virginia Lighthouse Program

WV Lighthouse

Age 60+
General West Virginia resident, at risk of nursing home.
Income Limits ~$2,000/month individual, varies
Asset Limits $5,000 individual
WV

Limited funding; rural focus.

Benefits
In-home care (3-5 hours/week) Respite (up to 10 days/year) Transportation (~5 trips/month)

Older Americans Act (OAA) Services

West Virginia OAA Services

Age 60+
General WV resident; no income/asset limits.
Income Limits (2025) None; donations encouraged.
Asset Limits Not assessed.
WV

Includes Meals on Wheels; serves ~20,000 annually; rural emphasis.

Benefits
Meals (~$5-$7/meal) Transportation Homemaker services (~4 hours/week) Respite (~5 days/year) Legal aid

Medicare Savings Program (MSP)

West Virginia Medicare Savings Program

Age 65+ or disabled
General WV resident, Medicare Part A/B.
Income Limits (2025) ~$2,510/month (QMB), ~$3,380/month (SLMB), ~$3,598/month (QI)—individual.
Asset Limits $9,430 (individual), $14,130 (couple).
WV

Includes Extra Help for Part D; no waitlist.

Benefits
Covers Part B premiums ($174.70/month) Deductibles ($240/year) Copays (~20%)

Low-Income Energy Assistance Program (LIEAP)

West Virginia LIEAP

Age 60+ prioritized
General WV resident, low-income household.
Income Limits (2025) ~$3,970/month 185% FPL
Asset Limits Not assessed.
WV

Covers gas, electric, wood; emergency aid available.

Benefits
Heating aid ($300-$1,000/season) Emergency aid ($500 max)

Family Caregiver Support Program (FCSP)

West Virginia Family Caregiver Support Program

Age
General Caregivers of 60+ needing care or 55+ caregivers of others; WV resident; 2+ ADLs.
Income Limits (2025) No strict cap; prioritizes low-income ~$24,980/year
Asset Limits Not assessed.
WV

Includes grandparent caregivers; serves ~1,500 annually.

Benefits
Respite (4-6 hours/week or 5 days/year) Adult day care ($60/day) Training Supplies (~$500/year)

VA Aid and Attendance (A&A) and Housebound Benefits

West Virginia VA Aid and Attendance/Housebound

Age 65+ or disabled veteran/spouse
General WV resident, wartime service, ADL help (A&A) or homebound.
Income Limits (2025) Net income < ~$1,984/month (veteran with dependent, A&A); pension offsets income.
Asset Limits ~$155,356 net worth
WV

High rural veteran use; supports care costs.

Benefits
Cash (~$1,433-$2,642/month veteran, ~$951-$1,318 spouse) for care costs

Homestead Exemption for Seniors

West Virginia Homestead Exemption

Age 65+ or totally disabled
General WV resident, homeowner (homestead).
Income Limits (2025) None; tax-based eligibility.
Asset Limits Not assessed.
WV

$20,000 assessed value exemption; saves ~$200-$400/year.

Benefits
Tax exemption (~$200-$400/year avg.)

Senior Farmers’ Market Nutrition Program (SFMNP)

West Virginia SFMNP

Age 60+
General WV resident, low-income.
Income Limits (2025) ~$2,322/month 185% FPL
Asset Limits Not assessed.
WV

Vouchers (~$50/season); serves ~10,000 annually.

Benefits
Vouchers (~$50/season) for produce at farmers’ markets

Frequently Asked Questions about Tabor Hills

What neighborhood is Tabor Hills in?

Tabor Hills is in the Naperville Park District neighborhood of Naperville.

Is Tabor Hills in a walkable area?

Tabor Hills has a walk score of 21. Car-dependent. Most errands require a car, with limited nearby walkable options.

What is the occupancy rate at Tabor Hills?

Tabor Hills's occupancy is 62.2%.

Are there photos of Tabor Hills?

Yes — there are 6 photos of Tabor Hills in the photo gallery on this page.

What is the address of Tabor Hills?

Tabor Hills is located at 1347 Crystal Ave, Naperville, IL 60563.

What is the phone number of Tabor Hills?

(630) 778-6677 will put you in contact with the team at Tabor Hills.

Is Tabor Hills Medicare or Medicaid certified?

Yes — Tabor Hills is a CMS-certified provider of Medicare and Medicaid.

Guides for Better Senior Living

Care Cost Calculator: See Prices in Your Area

Nursing Home Data Explorer

Don’t Wait Too Long: 7 Red Flag Signs Your Parent Needs Assisted Living Now

The True Cost of Assisted Living in 2025 – And How Families Are Paying For It

Understanding Senior Living Costs: Pricing Models, Discounts & Financial Assistance